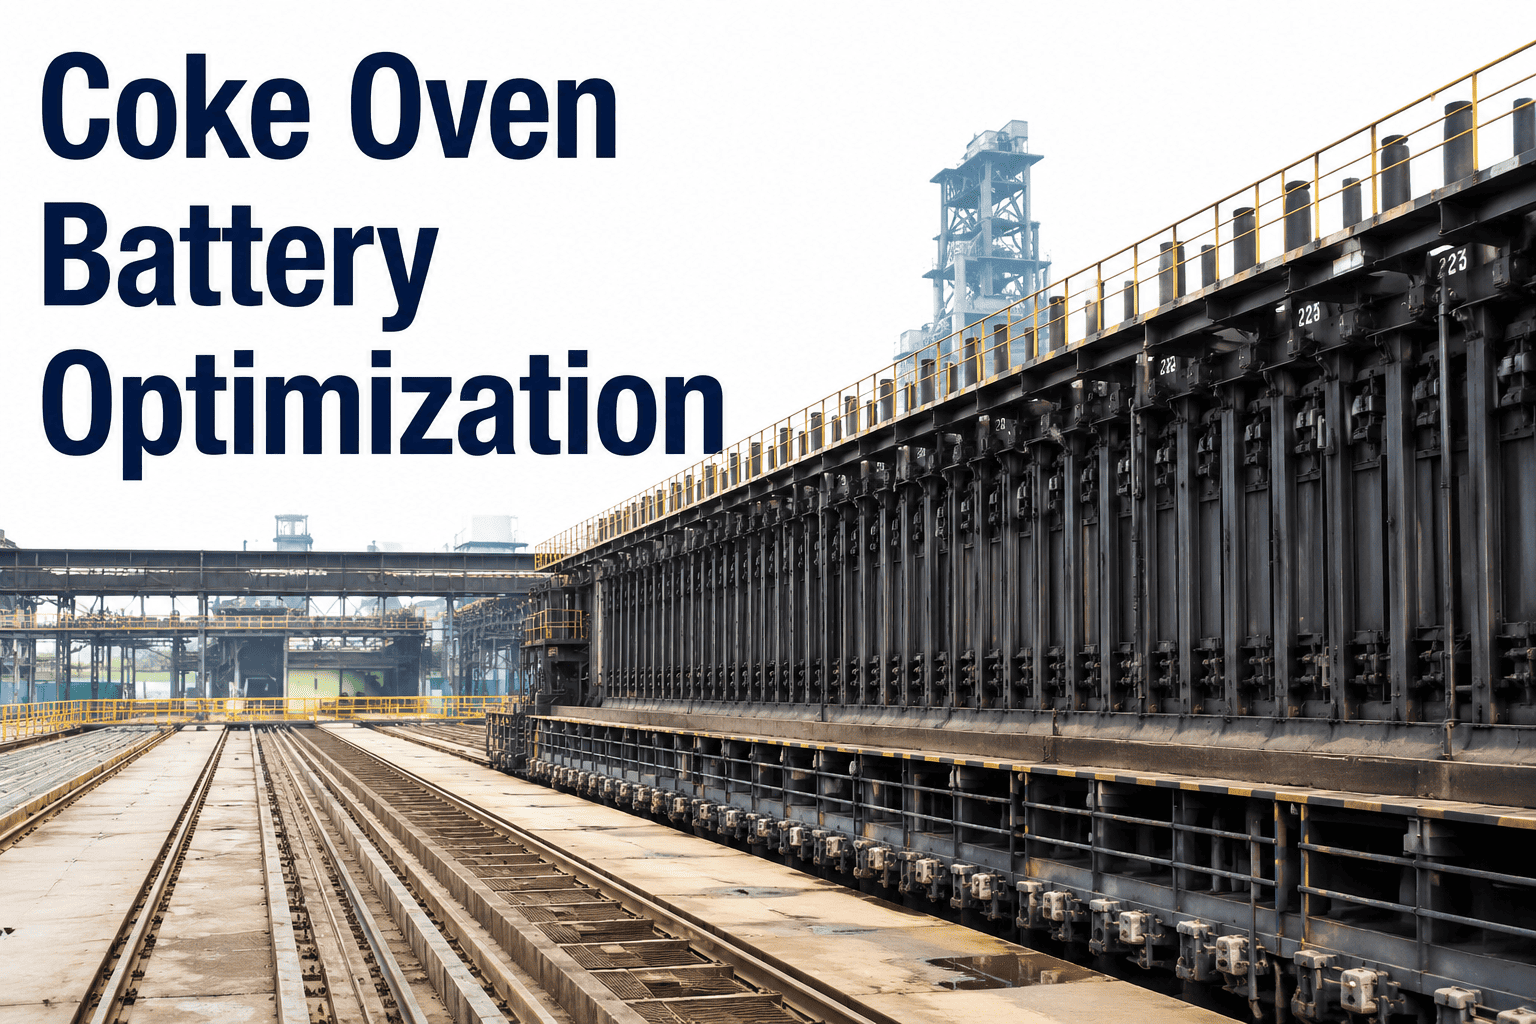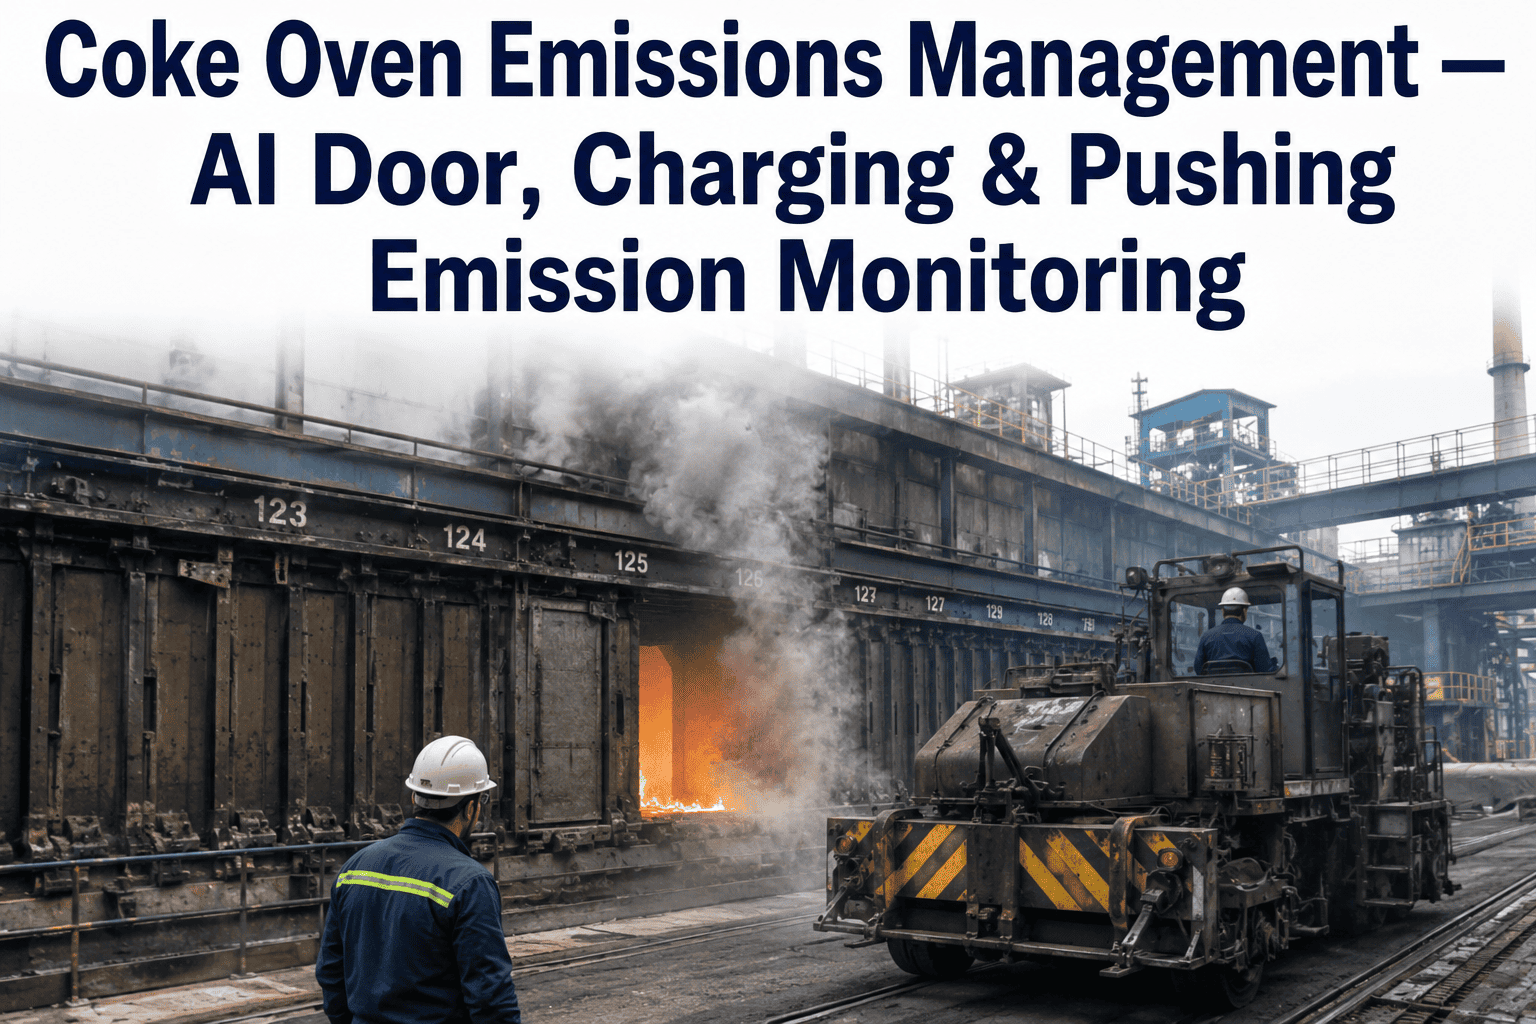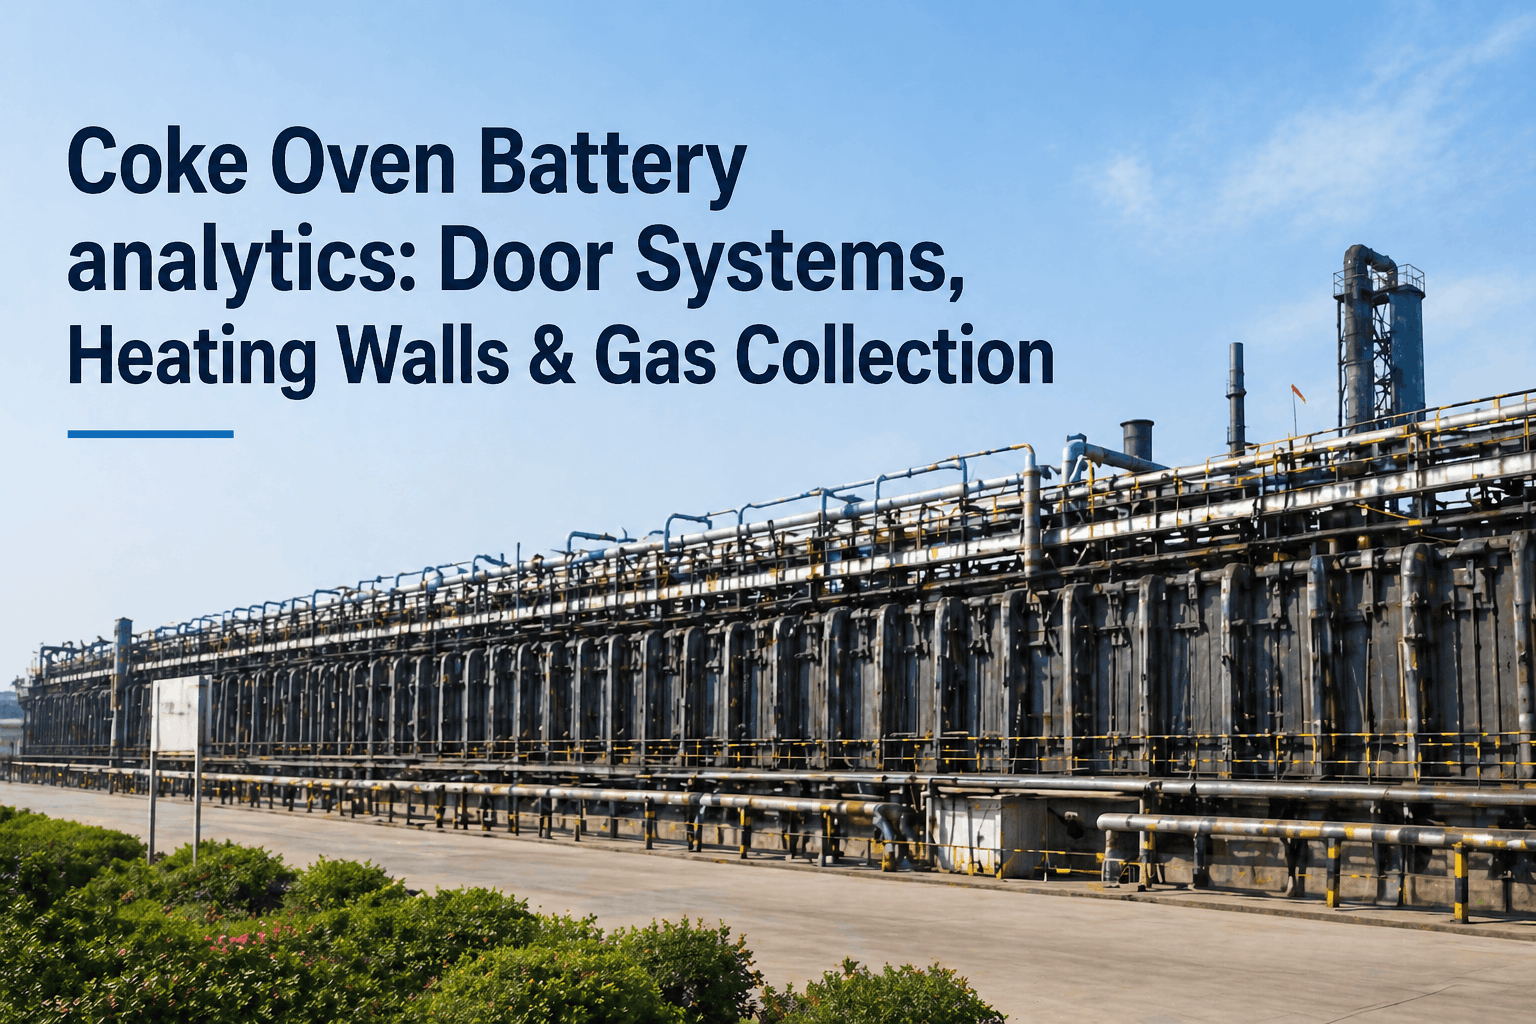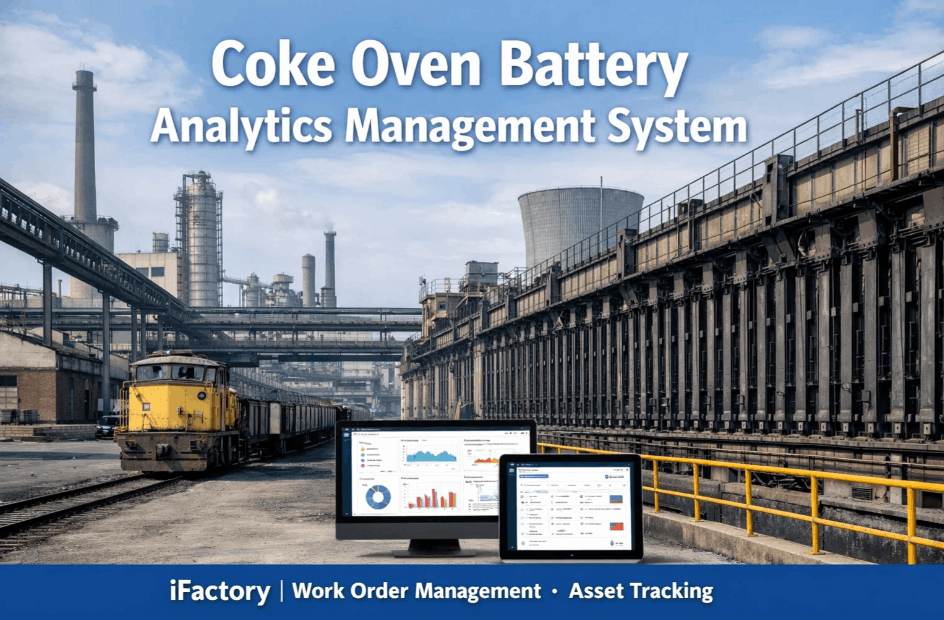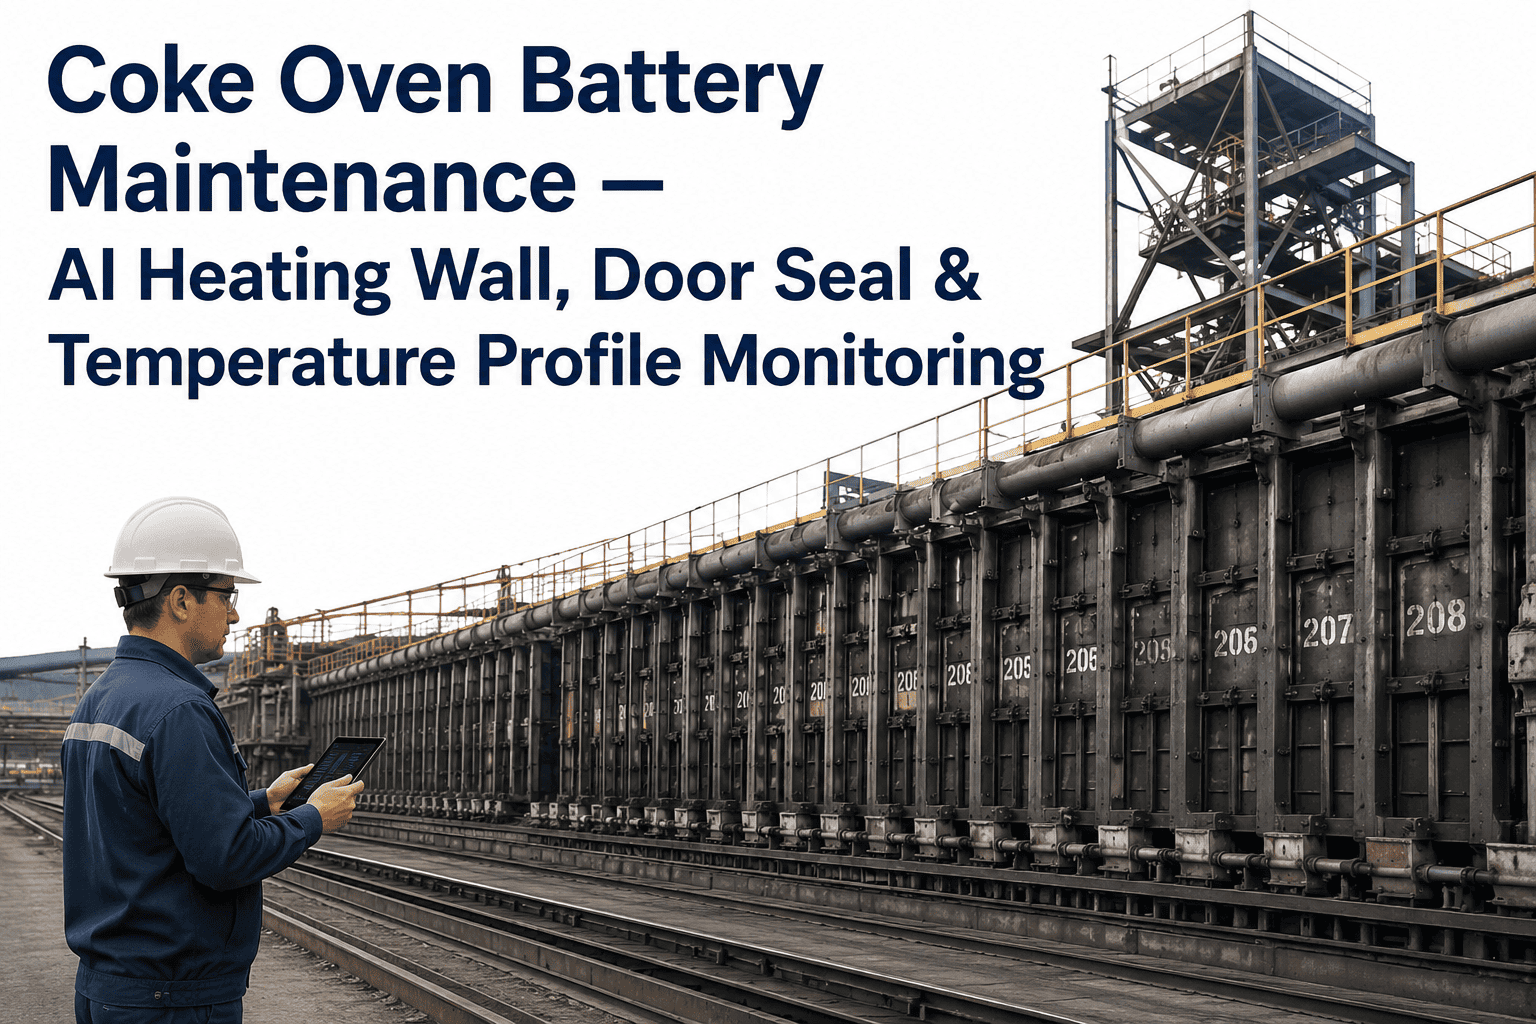
A coke oven battery runs for twenty to forty years if the refractory holds, and it fails early almost every time the same way: a heating wall cracks quietly for months before anyone notices, a door seal starts leaking days before it's caught on a walk-around, or a temperature zone drifts just enough to soften coke quality without tripping any alarm. Process engineers inspecting walls and doors by eye and thermocouple spot-checks are working with a fraction of the picture a battery actually needs. AI-based thermal and visual monitoring closes that gap by watching every wall, every door, and every flue continuously, catching the early signature of wall cracking and door leakage before it shows up as a coke quality problem or an emissions event. See how the monitoring model reads your battery's own thermal signature when you book a demo.
Every heating wall, every door, every flue temperature — watched continuously, not walked past once a shift.
Battery refractory degrades slowly until it doesn't. AI thermal imaging and door monitoring catch the drift in heating wall condition and door seal integrity weeks before it becomes a coke quality problem, an emissions exceedance, or an unplanned reline.
Three places a battery quietly fails
Battery integrity comes down to three interconnected systems, and a weakness in any one of them eventually shows up in the other two. Understanding how they interact is the first step to catching problems while they're still cheap to fix.
Walk-around inspection versus continuous AI monitoring
Most batteries still rely on a technician walking the battery top and pusher side on a fixed schedule, recording observations by hand. That approach worked when batteries were newer and margins for error were wider. On an aging asset it leaves too much time between checks, and it depends heavily on which technician is walking that shift and how much of the battery they can realistically cover in the time allotted. A battery with 50 to 70 ovens per side, each with its own doors and dozens of flues, is simply too much surface area for a person to inspect closely and consistently, shift after shift, without gaps forming in coverage.
The comparison below isn't an argument that manual inspection has no value — an experienced technician's judgment on the pusher side is still worth having. It's a picture of where continuous monitoring closes the specific gaps that manual inspection structurally cannot close, regardless of how experienced the inspection team is.
| Monitoring dimension | Manual walk-around | AI thermal and vision monitoring |
|---|---|---|
| Inspection frequency | Once or twice per shift | Continuous, every oven, every cycle |
| Wall crack detection | Visible only once crack is advanced | Flags thermal signature of early hairline cracking |
| Door leak detection | Smell or visible flare, already leaking | Detects gas signature before visible flame |
| Temperature profile | Sample thermocouple readings | Full flue-by-flue thermal map every cycle |
| Recordkeeping | Paper or spreadsheet log | Timestamped image and data trail per oven |
| Trend analysis | Manual review, easy to miss slow drift | Automated trend alerts on gradual degradation |
How a heating wall crack actually progresses
Wall cracking rarely announces itself as a single event. It moves through recognizable stages, and each stage has a different thermal and visual signature that a monitoring model is trained to recognize — which is exactly why catching it early depends on watching continuously rather than sampling occasionally.
iFactory maps thermal history against wall condition so engineers can prioritize the ovens that need attention this quarter, not after the next reline.
Reading the flue-by-flue temperature map
A single average battery temperature tells an engineer almost nothing useful. What matters is the flue-by-flue distribution — how each individual flue compares to its neighbors and to its own historical pattern across the coking cycle. A battery that looks fine on an averaged dashboard can still have three or four flues drifting outside spec, quietly producing coke that fails a downstream customer's size or strength specification before anyone traces it back to the oven that caused it.
AI-based thermal mapping builds this picture automatically, cycle after cycle, without requiring an engineer to manually log and compare readings. The model tracks each flue against its own baseline rather than a single battery-wide target, because normal variation between flues is expected and a fixed threshold either misses real problems or triggers so many false alerts that engineers stop trusting it. Once a flue's readings start diverging from its own established pattern in a way that correlates with known wall or combustion issues, it gets flagged with enough context — which flue, how long the drift has been building, and which adjacent flues are affected — for an engineer to act on it directly rather than starting an investigation from scratch.
This matters most during grade changeovers and coal blend changes, when temperature profiles shift intentionally and engineers need to distinguish an expected transition from an unrelated developing fault happening at the same time. A model trained on your battery's operating history separates the two automatically, so a coal blend change doesn't mask an oven that's actually starting to develop a wall problem underneath the expected temperature shift.
Four sources of door seal leakage
Door leaks are one of the most visible and most preventable fugitive emission sources on a coke oven battery, and they come from a small, repeatable set of root causes. Identifying which one is driving a given leak determines whether the fix is a gasket swap or a jamb resurfacing.
The battery monitoring stack
Continuous battery monitoring is built from sensing, inference, and integration layers working together, deployed as a single system rather than separate point solutions bolted onto the battery over time.
Frequently asked questions
What early detection is actually worth
The economics of battery monitoring come down to one comparison: the cost of catching a wall problem at stage one versus the cost of discovering it at stage four. A micro-crack caught early is a repair scheduled into a planned outage — often a localized patch that keeps the oven in service with minimal disruption. The same crack left unmonitored until it's visible on a walk-around is frequently a partial reline, which means an oven or a section of the battery out of production for weeks, plus the capital cost of the refractory work itself.
Door leaks carry a parallel economic case, though the driver is different. A leaking door is a continuous fugitive emissions source, and depending on your permit conditions and local air quality regulations, sustained leakage can accumulate toward reportable thresholds or trigger a compliance review. Beyond the regulatory exposure, coke oven gas escaping through a door seal is a direct loss of fuel value and a standing safety hazard for anyone working the pusher side or battery top near that oven. Catching leak signatures at the earliest stage — before they're visible as flame or smell — turns a compliance and safety issue into a routine gasket or jamb maintenance item.
Coke quality variability is the third and often least visible cost. When flue temperature drifts slowly across a section of the battery, the coke produced doesn't fail outright — it drifts toward the edge of specification on CSR, CRI, or size distribution, and depending on how blast furnace operations are buffering against that variability, it can show up downstream as reduced furnace productivity or a higher coke rate long before anyone connects it back to a specific battery zone. Continuous temperature mapping closes that attribution gap directly, tying coke quality trends back to the oven and time period that produced them.
iFactory combines thermal imaging, wall and door condition modeling, and battery-wide records in one system built for coke oven operations. Book a demo and see it against your own battery's thermal history.