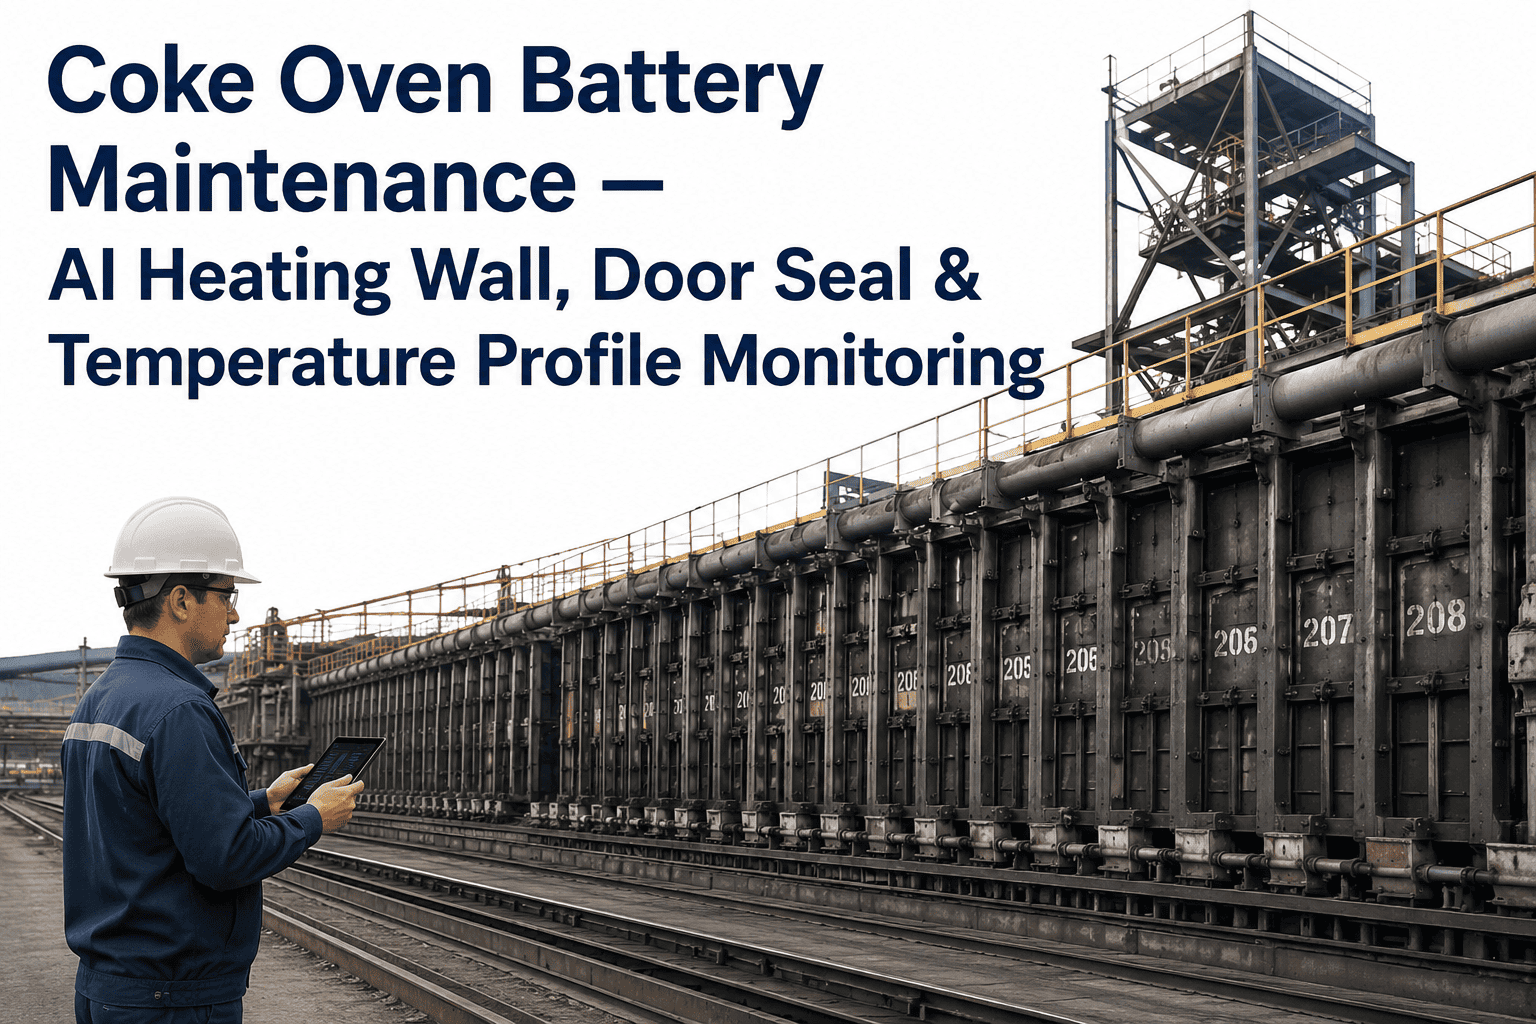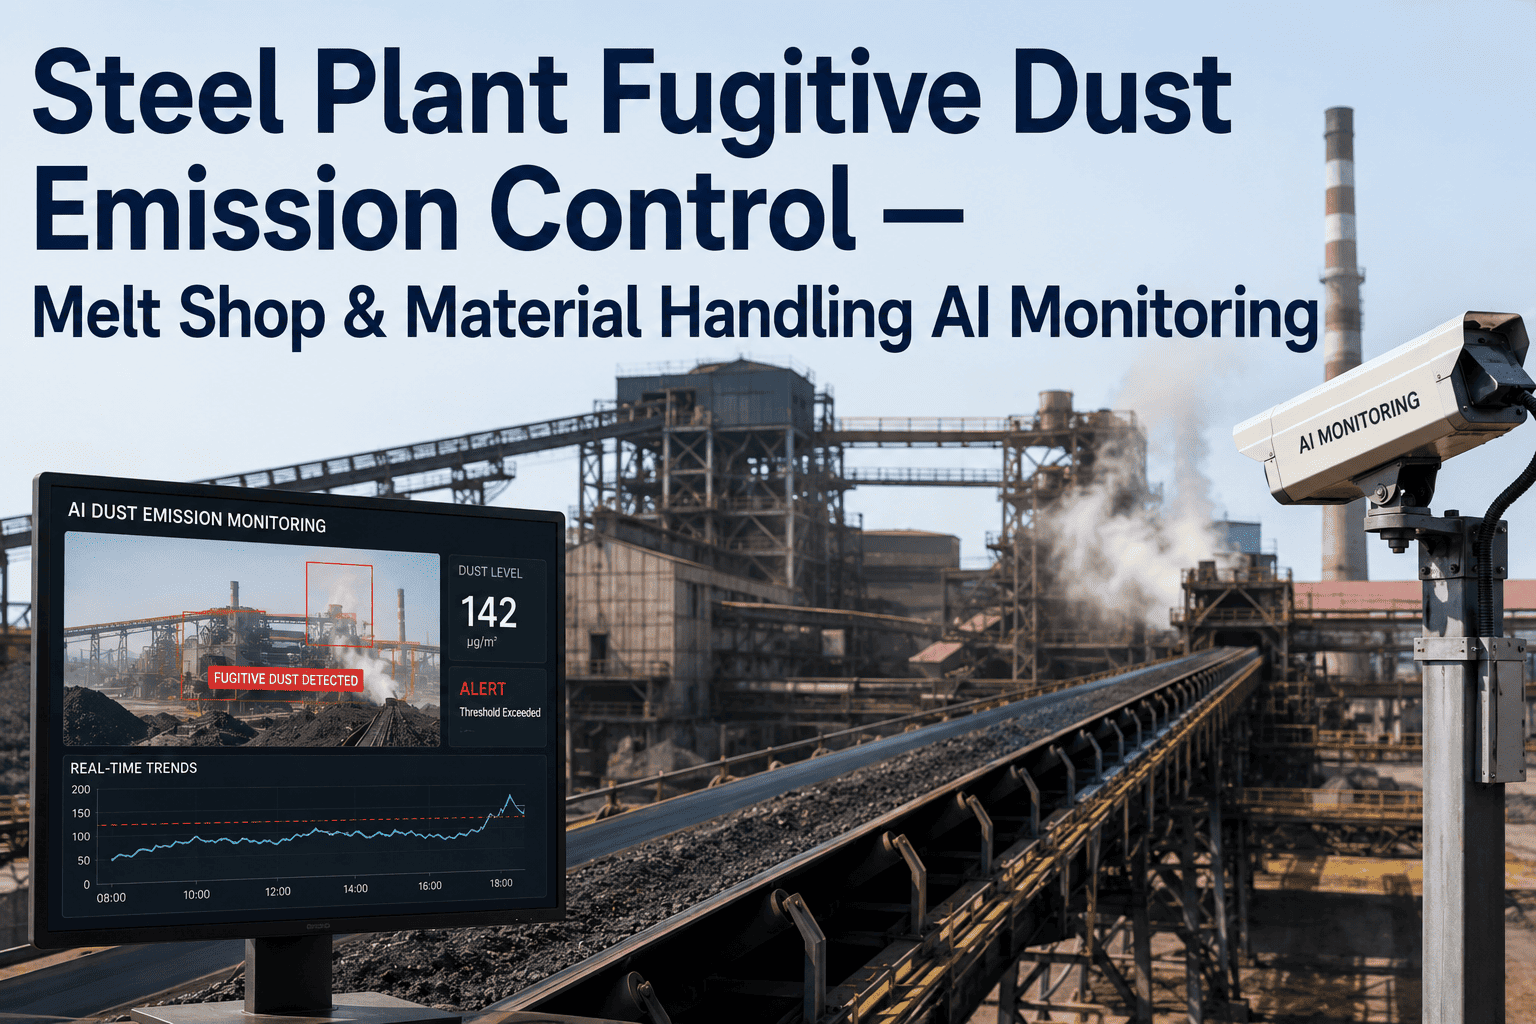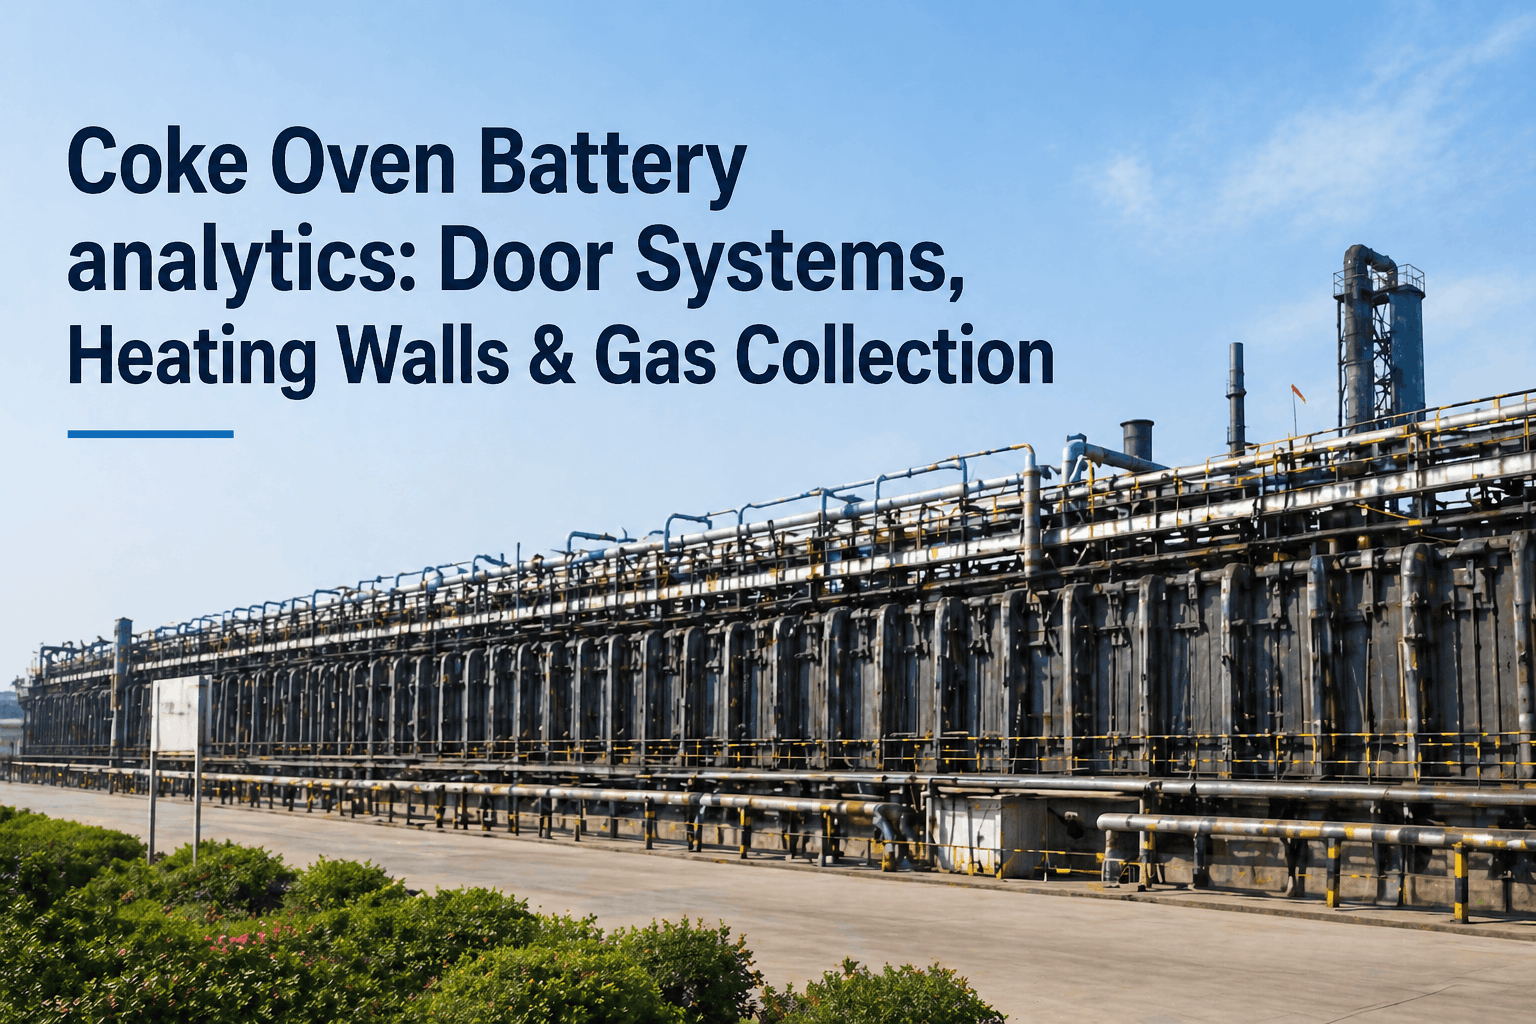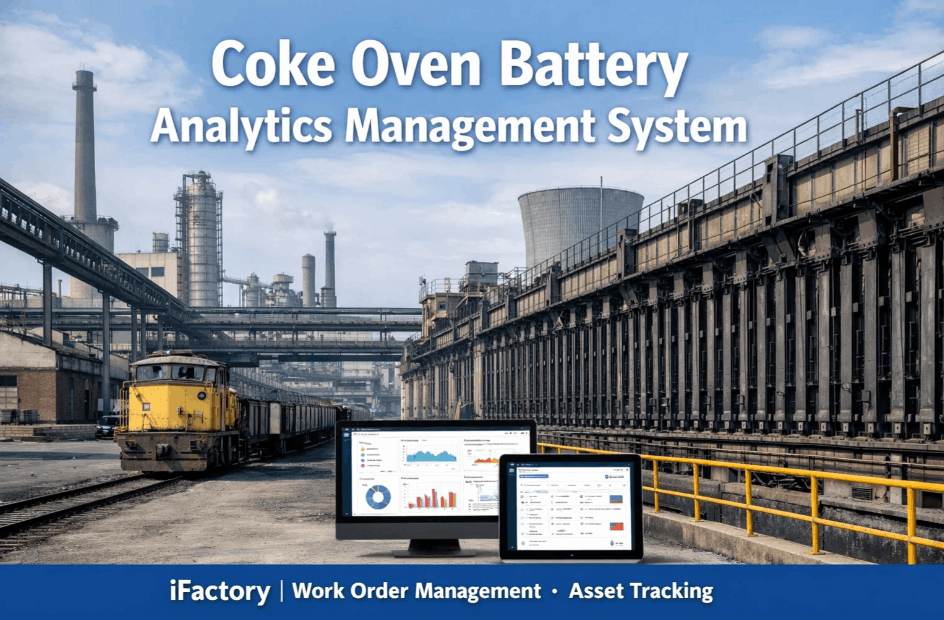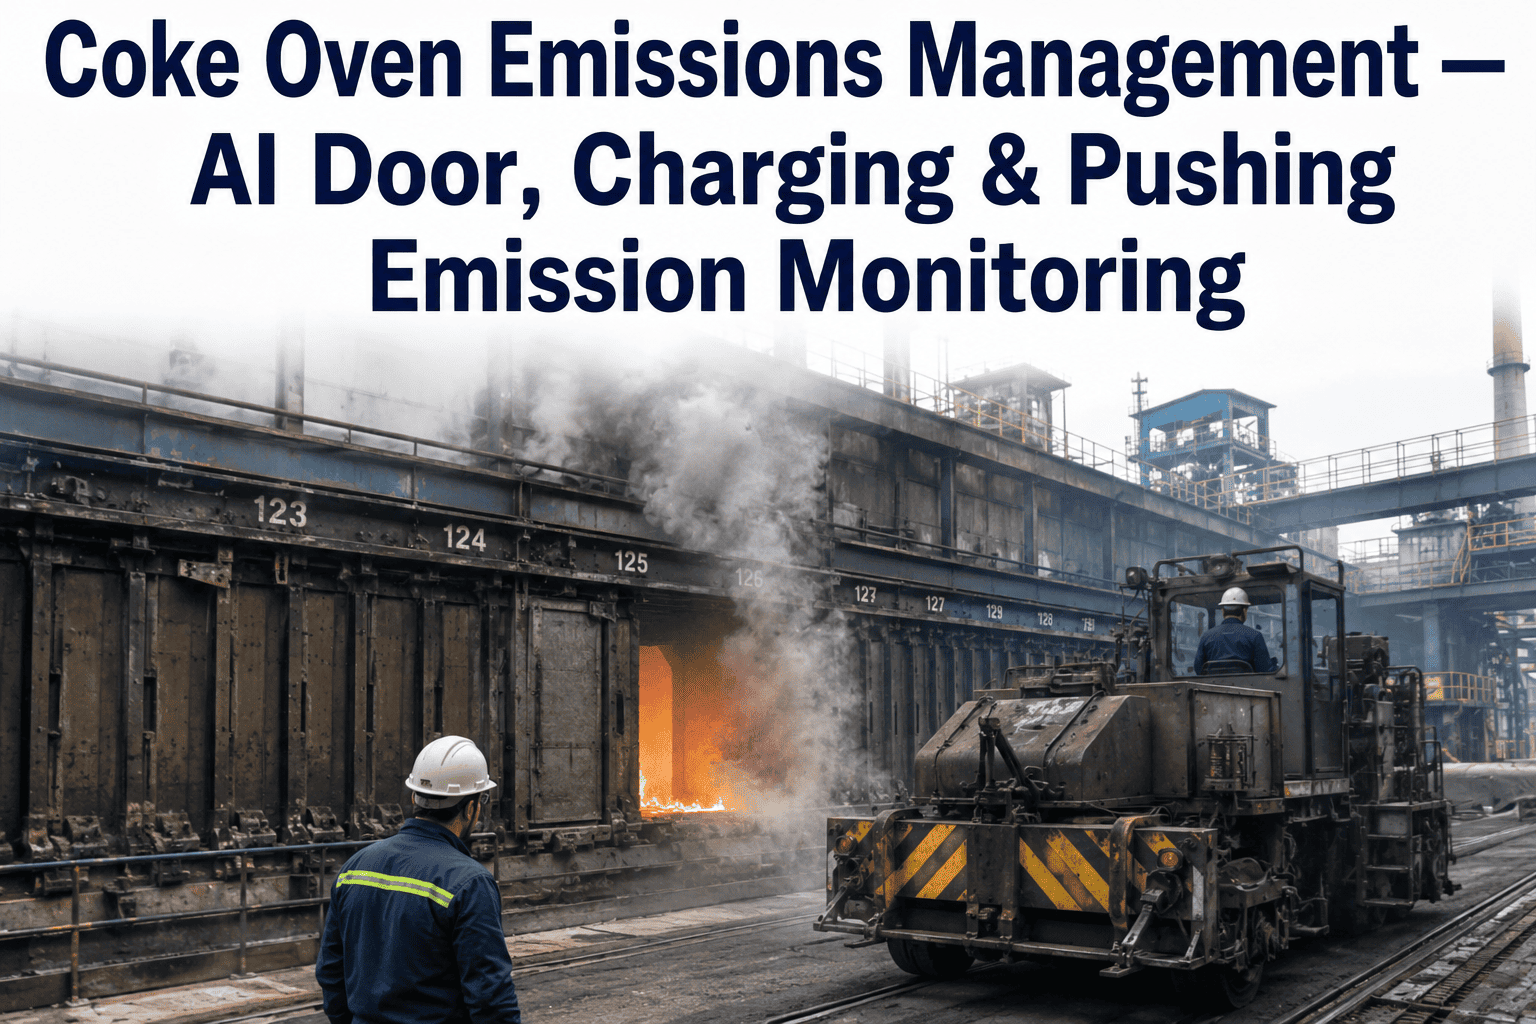
Coke ovens are one of the most heavily regulated emission sources inside an integrated steel plant, and door leaks, charging emissions, and pushing smoke are the three events regulators and inspectors watch most closely. Each one is a visible, quantifiable release that a walk-around inspection either catches in the moment or misses entirely until the next scheduled compliance check. AI-based visual and thermal monitoring turns these into continuously tracked metrics instead of point-in-time observations, giving EHS managers a defensible, timestamped record for every door, every charge, and every push. See how it builds your MACT compliance record when you book a demo.
Three emission events regulators track most closely. Now tracked continuously instead of once a shift.
Door leak rate, charging emission capture, and pushing smoke duration are the coke oven battery's most visible compliance metrics. AI monitoring turns them into a continuous, defensible record instead of a periodic spot check.
Why door leak rate carries outsized compliance weight
Among the three tracked emission sources, door leakage draws the most sustained regulatory attention, and for good reason: it's continuous rather than event-based, it's the most visible metric during any site inspection, and it's the one most directly tied to a battery's overall maintenance condition. A regulator or inspector doing a facility walk doesn't need special timing to observe a leaking door — it's visible any time they choose to look, which makes leak rate a proxy metric for how well the whole battery is being maintained, not just the doors themselves.
This is also why door leak rate is the metric most susceptible to a gap between what a periodic survey captures and what's actually happening on the battery day to day. A survey conducted on a good day, right after a maintenance push on door repairs, can understate the leak rate a battery experiences on an average day between compliance surveys. Continuous monitoring closes exactly this gap, because the record reflects actual day-to-day condition rather than a snapshot timed to a scheduled inspection window — which matters both for genuine environmental performance and for the credibility of the compliance record itself if it's ever challenged.
For EHS managers, the practical value shows up well before any formal survey. A continuously updated leak rate trend means maintenance priorities can be set based on which doors are actually degrading fastest, rather than waiting for the next survey to reveal a leak rate that's crept upward across dozens of doors simultaneously — a scenario that's both harder to fix quickly and harder to explain during an inspection.
Three emission sources, three different signatures
Each of the three tracked coke oven emission events has a distinct visual and thermal signature, a different root cause profile, and a different monitoring approach. Treating them as one generic "battery emissions" problem misses the specifics that actually drive compliance risk.
The compliance survey walk versus continuous visual monitoring
Most batteries meet their compliance obligations through periodic visible emissions surveys — a trained observer walking the battery and doors on a defined schedule, recording leak counts and durations by eye. This meets the regulatory minimum, but it's a sample, not a census, and the gap between what a survey captures and what the battery actually experiences day to day is exactly where compliance risk tends to accumulate unnoticed.
| Monitoring dimension | Periodic compliance survey | AI continuous monitoring |
|---|---|---|
| Door coverage | All doors, but only at survey time | All doors, continuously |
| Leak trend detection | Comparison across separate surveys | Real-time trend per door |
| Charging capture verification | Observed during scheduled survey charges | Verified on every charge event |
| Pushing smoke duration | Timed manually during observed pushes | Measured automatically on every push |
| Recordkeeping | Survey report, periodic | Continuous timestamped image and data log |
What a continuous record actually changes during an inspection
When a regulatory inspection or a permit renewal review happens, the difference between a periodic survey record and a continuous monitoring record becomes very concrete. A periodic record can answer what the leak rate was on the days surveys were conducted. A continuous record can answer what the leak rate has been every day across the reporting period, with image-backed evidence for specific events an inspector wants to examine more closely. That's a materially stronger position when a facility is demonstrating good-faith compliance effort, particularly if a specific incident or exceedance is under review and the facility needs to show the broader operating context around it rather than just the isolated event.
This also changes how EHS teams handle citizen complaints or third-party observations, which are increasingly common near industrial facilities. A complaint about visible smoke or odor on a specific date can be checked directly against the continuous record for that battery and time window, giving the EHS team an evidence-based response rather than relying on operator recollection of whether anything unusual happened that day. Whether the record confirms or contradicts the complaint, having it available in a timestamped, structured format is what allows the response to be fast and credible rather than defensive.
iFactory builds a timestamped, image-backed compliance record for every door, charge, and push automatically, ready for audit or permit review.
The door leak monitoring checklist
Door leak rate is the single most cited coke oven compliance metric, and managing it well comes down to tracking a consistent set of conditions across the door fleet rather than reacting to individual leak reports as they're noticed. These four elements, tracked together, give an EHS manager a genuinely proactive maintenance program instead of a reactive one built around responding to the next survey result.
Charging and pushing: what the model actually watches for
Charging and pushing emissions are brief, high-intensity events, which means the monitoring approach has to catch the right moment automatically rather than relying on a human observer timing a stopwatch during a scheduled survey window. Both events happen dozens of times a day across a battery, and a survey that observes even a handful of them still only represents a small fraction of total charging and pushing activity across a full operating period.
The emissions monitoring stack
A defensible continuous emissions record depends on sensing, event detection, and recordkeeping layers working together as one integrated system rather than separate cameras with no shared data trail. Each layer below plays a distinct role, and the value of the whole system depends on all four operating together consistently rather than any one layer alone.
What a compliance exceedance actually costs beyond the fine
The direct penalty for a documented emissions exceedance is usually the smallest part of the real cost. A pattern of exceedances or a poor compliance survey result frequently triggers heightened regulatory scrutiny — more frequent inspections, tighter permit conditions at renewal, or in more serious cases a consent decree that locks the facility into a defined corrective action plan with its own compliance deadlines and reporting burden. Any of these outcomes represents a multi-year cost and operational constraint that dwarfs the initial penalty amount, which is why EHS teams increasingly treat continuous monitoring as risk management rather than a reporting convenience.
There's also a community and permitting dimension that matters over the longer term. Facilities seeking permit modifications, capacity expansions, or new project approvals are evaluated in part on their compliance track record, and a battery with a documented history of proactive leak management and continuous monitoring is in a materially stronger position during that review than one whose compliance history consists of periodic survey results with gaps between them. In that sense, the value of a continuous, well-documented compliance record compounds over time — it's not just protection against the next inspection, it's an asset the facility carries into every future regulatory interaction.
Frequently asked questions
iFactory brings door, charging, and pushing emissions monitoring into one system built for coke oven EHS teams. Book a demo and see it against your battery's own permit thresholds.