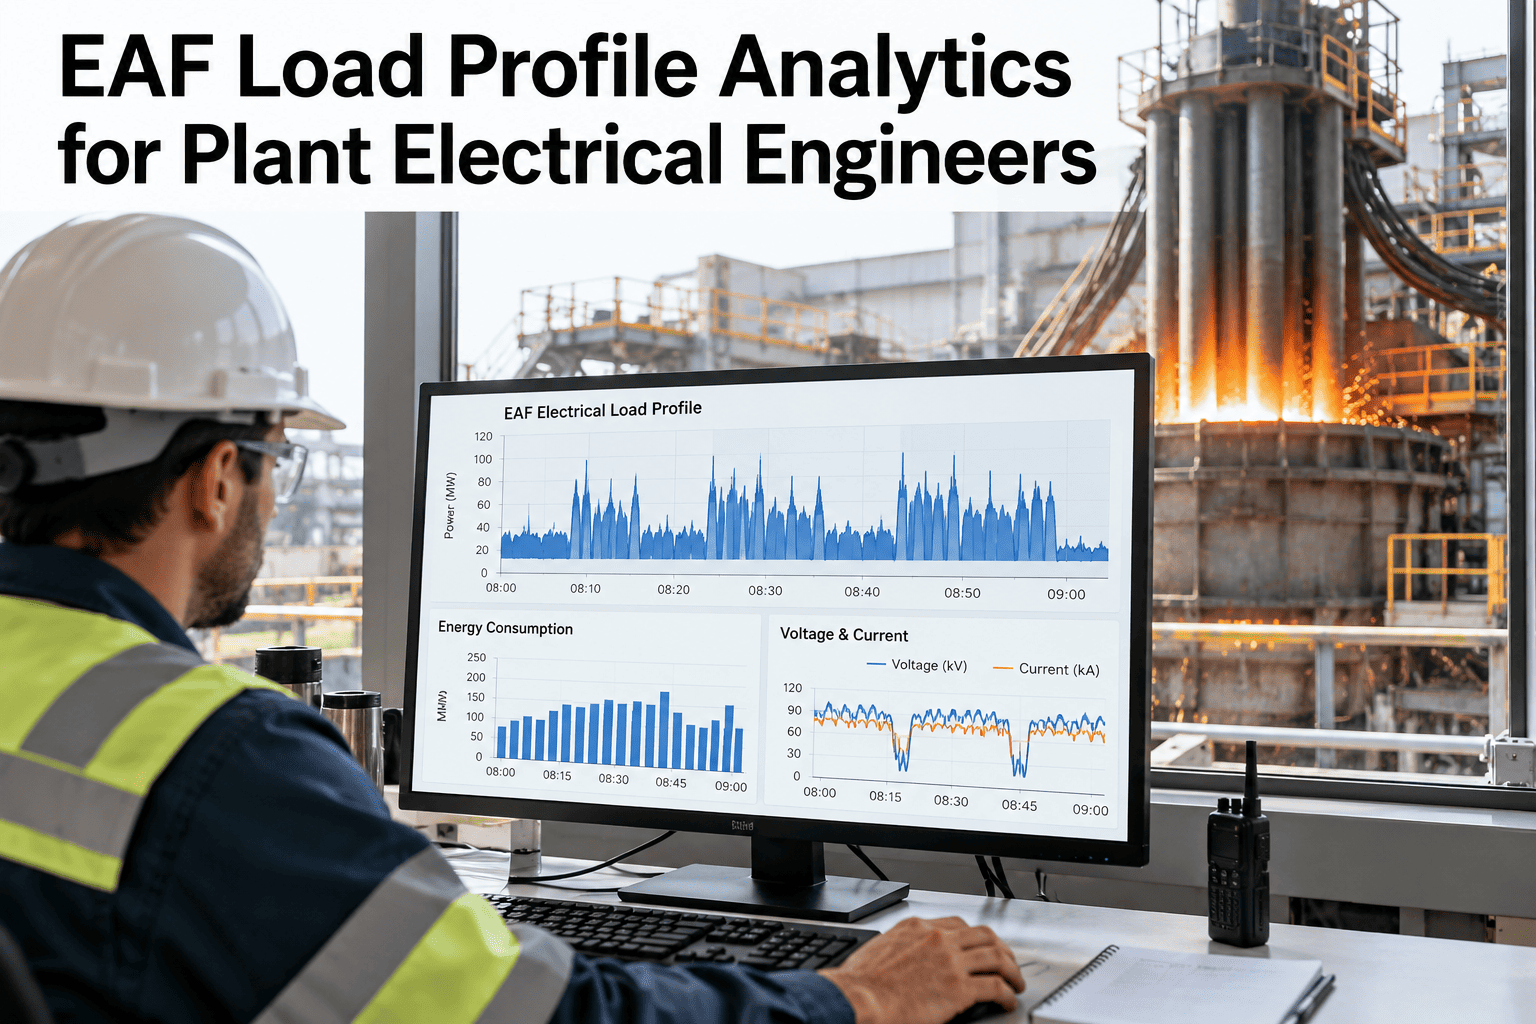
An electric arc furnace is one of the most demanding loads on any grid connection. Demand climbs and falls through each heat, current swings rapidly during early melting and the arc injects harmonics and flicker into the supply. Billing meters smooth much of that behavior into 15-minute averages, while the grid operator cares about what happens inside the interval. Electrical engineers need both views to manage peak charges and prove grid code compliance. Plant teams can review a high-resolution load profile built from their own meter and power quality data and see what averages hide.
Read the Load Profile the Way the Grid Sees It
iFactory steel analytics reviews 15-minute demand, harmonic content and flicker together, so electrical engineers manage peaks and compliance with one view.
An EAF Heat as a Load Profile
Each phase of a heat draws power differently. The shape explains where peaks and power quality events come from.
Conceptual shape. Real profiles vary with furnace, practice and scrap mix.
What 15-Minute Demand Analysis Should Report
The billing interval drives cost, so measure how your load behaves in each one.
| Metric | What It Shows | Why It Matters |
|---|---|---|
| Peak interval demand | Highest average in any interval | Sets demand charge exposure |
| Load factor | Average demand against peak | Shows how well load is spread |
| Ramp rate | How fast demand rises between intervals | Affects grid and transformer stress |
| Time near threshold | Intervals close to contract limits | Highlights peak risk |
| Power factor | Real power against apparent power | Affects penalties and incentives |
Power Quality Topics Engineers Must Cover
Peak demand is only part of the grid relationship. These three topics usually appear in grid code requirements.
Harmonic content
Distortion from the arc and converters, measured as total and individual harmonic levels
Flicker
Rapid voltage variation that affects other users, measured by short and long-term severity indices
Grid code compliance
Limits at the connection point, with reporting that proves the plant stays inside them
From Meter Data to Findings
A repeatable workflow turns raw measurements into decisions.
See Your Furnace Load Profile Beyond the Averages
Share meter and power quality data for a week of heats. We will show demand, harmonics and flicker lined up against each phase.
Where Power Quality Events Cluster in a Heat
Events are not spread evenly. Knowing which phase causes most of them tells you where to act.
Illustrative clustering. Your own measurements decide the real pattern.
Compliance Status at a Glance
A simple grade keeps engineering and operations on the same page.
Billing Meter Data vs High-Resolution Analytics
Both matter, but they answer different questions.
Responding to a Flicker or Harmonic Complaint
Take it step by step so evidence comes before conclusions.
What Experienced Electrical Engineers Look For in EAF Load Analytics
Frequently Asked Questions
Why analyze demand in 15-minute intervals?
Many contracts measure demand in fixed intervals, so the highest interval sets the charge. Looking at your load in the same blocks shows exactly where peaks come from. Comparing the same intervals before and after an operating change also shows whether a new practice actually lowered the peak. Check your own peak intervals against contract terms with our team to see the cost impact.
What causes flicker from an arc furnace?
Rapid changes in arc current during melting cause voltage variation at the connection point. The effect depends on grid strength and the furnace operation. Measuring flicker by heat phase shows when it occurs and what to change. Measuring at the furnace transformer and at the connection point helps separate plant effects from grid effects.
How do harmonics from the furnace get measured?
Power quality analyzers record voltage and current distortion at the connection point over time. Engineers compare total and individual harmonic levels against limits. Permanent monitors are worth considering at the connection point, since compliance questions often arise months after the event. Plan which measurement points your plant needs before starting a monitoring program.
Can analytics reduce peak demand without hurting production?
Often by shifting or smoothing parts of the load, such as staggering heats between furnaces. The gain depends on your schedule and constraints. Analytics shows which peaks are avoidable and which come from the melting process itself. Even small shifts of a few minutes between furnace start times can lower the combined peak, and analytics helps find the right offset.
What do we need to start?
Interval meter data, power quality records and furnace event logs with consistent timestamps. A few weeks is enough for a first review. Include furnace event logs if you can, because linking electrical readings to heat phases is where most of the insight comes from. See whether your current data supports a first analysis on a short call.
Show the Grid and the Contract What the Furnace Really Does
Bring your meter data and a recent heat log. We will line up demand and power quality against each phase of the melt.