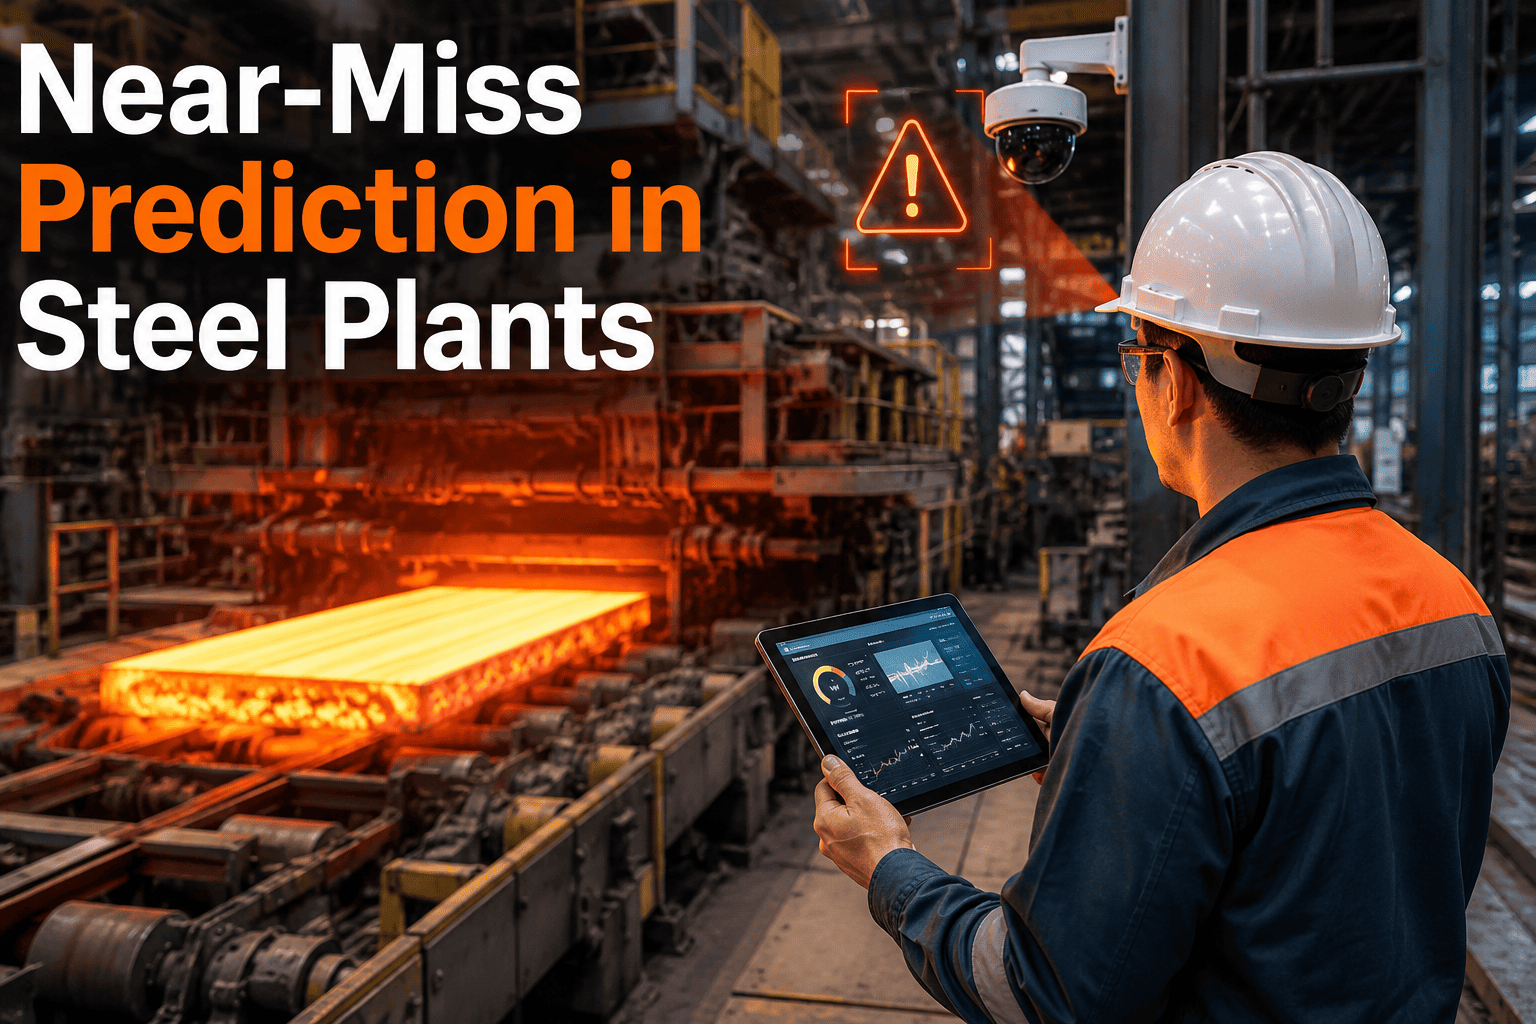
Most steel plants collect thousands of near-miss reports every year and file almost all of them away without a second look, treating each one as an isolated event rather than a signal. A slag spill that misses a walkway, a crane load that swings wider than expected, a forklift that brakes hard near a blind corner — on their own these look like nothing worth escalating. Read together across units and years, the same reports form a pattern that shows exactly where the next real incident is statistically most likely to happen, which is the entire reason near-miss data exists in the first place. iFactory reads that corpus at scale and turns it into an area-level risk score your safety team can act on before the pattern becomes a headline, a method detailed further in iFactory's support documentation.
Why Near-Misses Are the Leading Indicator Everyone Files and Nobody Reads
Lagging indicators like recordable injury rate and lost-time incidents tell you what already went wrong. Near-miss reports tell you what is about to go wrong, but only if someone actually cross-references them against unit, shift, equipment age, and time of year instead of closing each ticket the week it was filed. Most EHS teams do not have the bandwidth to do that cross-referencing by hand across five years of reports and a dozen production units, so the near-miss log becomes a compliance record rather than a prediction engine.
Single Report vs. Cross-Year Pattern — What Changes When You Widen the Lens
A safety coordinator reading one report in isolation can only ask whether the immediate hazard was corrected. Widening the same report against every other one filed in that bay over the past three years surfaces something very different: whether this is the fourth time a similar condition has appeared near the same conveyor transfer point, and whether it clusters around a specific shift, a specific maintenance interval, or a specific ambient temperature range.
How the Prediction Model Reads Your Historical Corpus
What Feeds the Model — Beyond the Report Text Itself
Near-miss narratives alone are a good starting point, but the strongest risk predictions combine that text with the operational context surrounding each report, since the same hazard description can carry very different risk depending on when and where it occurred.
Near-Miss Categories and What They Typically Precede
Not every near-miss category carries the same predictive weight, and understanding which categories most often precede a recordable incident helps safety teams prioritize which patterns deserve immediate attention versus routine tracking.
| Near-Miss Category | Common Setting in Steel Plants | Typical Precursor Weight |
|---|---|---|
| Overhead Crane Load Swing | Melt shop, casting bay, and material handling zones | High — frequently precedes struck-by incidents when recurring |
| Hot Metal Splash or Spill | Ladle transfer, tundish, and continuous casting areas | Very High — closely tied to burn injury patterns |
| Conveyor Pinch Point | Sinter plant, coke handling, and finishing lines | Moderate — risk rises sharply with guard maintenance backlog |
| Mobile Equipment Near-Collision | Yard operations, scrap handling, and loading docks | High — correlates with shift-change and low-visibility periods |
Getting From Insight to Action Without Overloading Your EHS Team
A risk ranking only helps if it changes what happens on the floor, which means the output needs to reach the right supervisor at the right time rather than sitting in a quarterly report. The most effective rollouts pair area-level scoring with a lightweight alert that flags a zone as trending upward before the next scheduled safety walk, so corrective action happens on the same cadence as the risk itself rather than months later. Plants that put this in front of shift supervisors, not just corporate EHS, see the fastest improvement in closure rates because the person closest to the area is the one seeing the signal first.
Conclusion — Your Near-Miss Log Already Contains the Answer
The incidents steel plants most want to prevent are rarely a surprise in hindsight — the warning signs were filed as near-miss reports months or years earlier, scattered across shifts and units where no single reviewer could connect them. Reading that corpus at scale, tagged by area and root cause, turns a compliance archive into a genuine early-warning system. Book a demo to see your own near-miss history reprocessed into a live area risk ranking.
Frequently Asked Questions — Near-Miss Prediction for Steel Plants
Most plants see meaningful pattern detection starting with two to three years of historical reports, since that window typically captures a full range of seasonal conditions and at least one maintenance cycle for major equipment. Plants with less history can still benefit, though the ranking will lean more heavily on recent reports until enough data accumulates to detect longer seasonal or maintenance-linked patterns. The model continues to improve as new reports are filed, so accuracy compounds over time rather than requiring a large upfront dataset before any value is delivered. iFactory's support documentation covers the minimum data thresholds in more detail.
It sits alongside your existing reporting system rather than replacing it, connecting to the data your teams already file so there is no change to how supervisors and workers submit reports today. The model reads historical and ongoing report data as an input and produces the area-level risk ranking as a separate output layer, which means adoption does not require retraining your workforce on a new reporting workflow. This approach also means the ranking reflects your actual reporting culture rather than a generic industry template, since it is built entirely from your plant's own history.
Yes, shift-level breakdown is one of the most commonly requested views, since many recurring hazards cluster around specific shift-change windows, night shift visibility conditions, or fatigue-prone hours rather than being evenly distributed across the day. The ranking can be filtered by shift, by area, or by both together, which helps supervisors understand whether a rising risk score reflects a physical condition, a scheduling pattern, or a combination of the two. This level of granularity is what allows corrective action to be targeted rather than applied plant-wide when the underlying issue is localized to one shift.
Older free-text reports are processed against a standardized root cause taxonomy built specifically for heavy industrial and steel plant hazard categories, extracting the contributing factors described in the narrative even when the original report was not filed with structured tags. This retroactive tagging is reviewed against a sample of reports with your EHS team early in the process to confirm the taxonomy matches how your plant actually categorizes hazards, since terminology can vary meaningfully between plants and regions. Once validated, the same tagging logic is applied consistently across the full historical corpus.
Ownership usually splits between corporate EHS, which uses the ranking for quarterly trend review and audit preparation, and shift supervisors, who receive area-specific alerts when a zone under their responsibility trends upward. Plants that only route the ranking to corporate EHS tend to see slower closure times, since the insight arrives too late in the cycle to change floor-level behavior before the next incident window. Routing the same signal to both levels, with different update frequencies for each, tends to produce the fastest measurable improvement in near-miss-to-incident ratios.