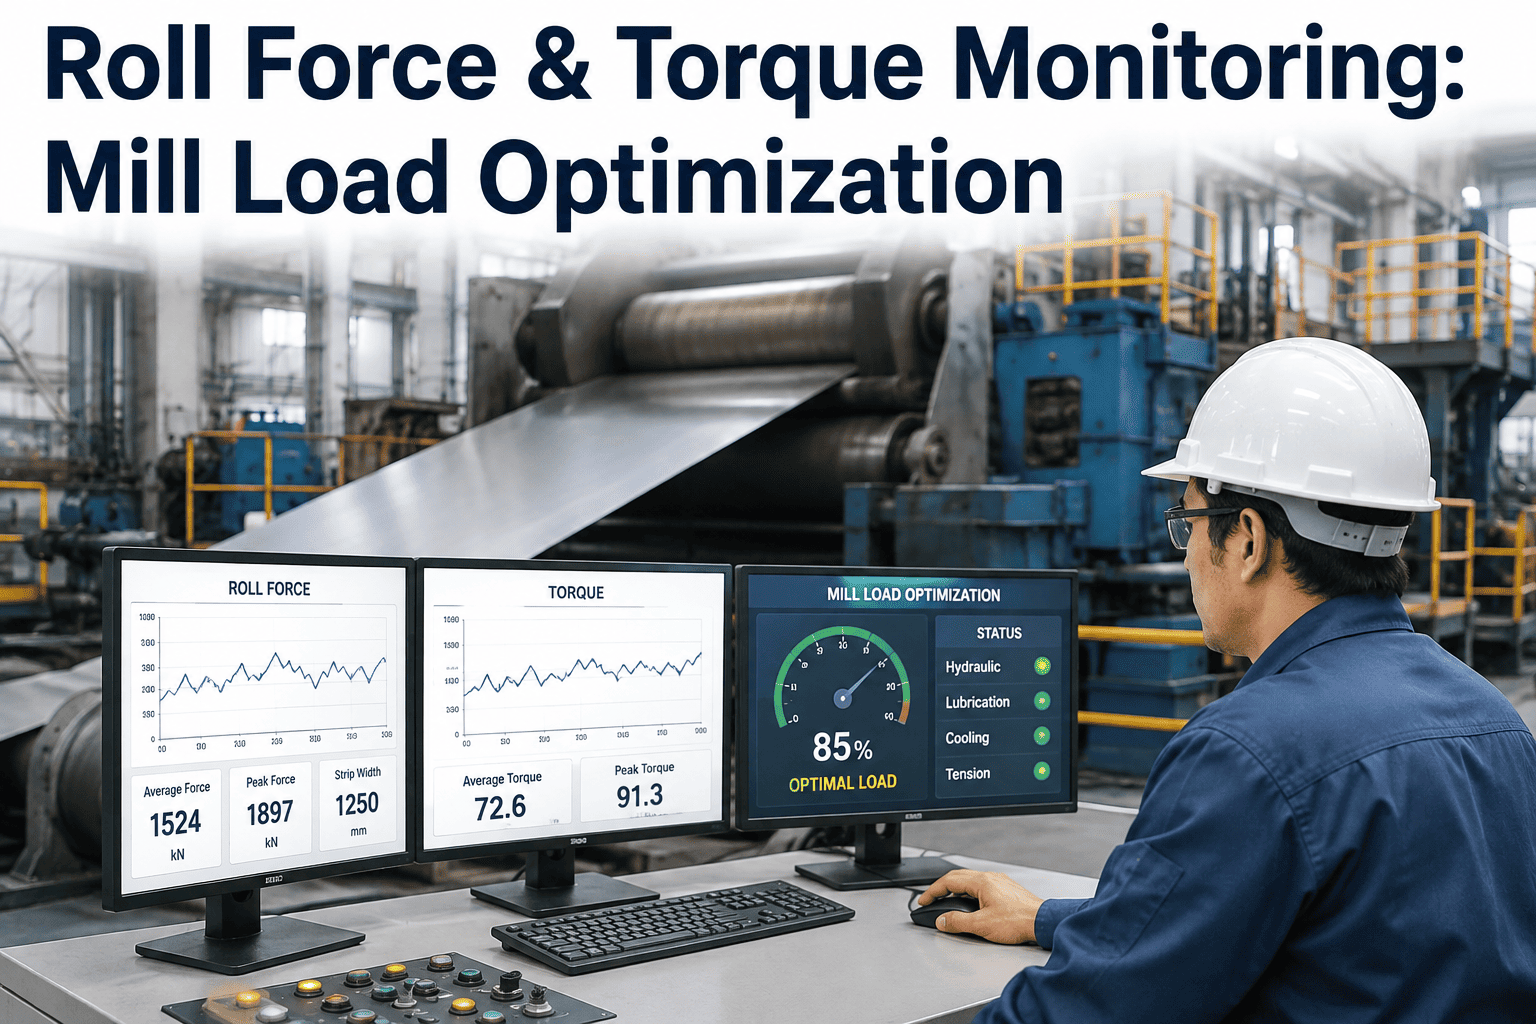
An uneven load split across rolling mill stands quietly erodes product quality long before it trips an overload alarm. One stand absorbing more force than its neighbors wears its rolls faster, drifts gauge tolerance, and pushes its motor closer to thermal limits every single pass. Getting load distribution right is less about a single sensor reading and more about watching how force and torque move together across the whole stand sequence, which is precisely the kind of cross-parameter view iFactory's process monitoring platform was built to surface for mill engineers.
ROLLING MILL · LOAD OPTIMIZATION
Roll Force and Torque Monitoring for Balanced Mill Load Optimization
Track load distribution across every stand, catch motor overloading early, and adjust rolling parameters before uneven force translates into gauge deviation or premature roll wear.
What Uneven Roll Force Actually Costs
±15%
typical force variation between stands before it starts showing up as visible gauge deviation
20-30%
faster roll wear reported on stands consistently absorbing more than their designed load share
Real-time
force and torque data needed to catch load imbalance before a quality deviation is produced
1 pass
is often enough for a torque spike to signal an emerging motor or drive train issue
What Drives Roll Force and Torque Imbalance
01
Uneven Pass Schedule Design
A reduction schedule that does not account for actual material hardness variation forces some stands to absorb a disproportionate share of the total reduction.
02
Roll Wear Progressing at Different Rates
As work rolls wear unevenly across stands, the force required to achieve the same reduction shifts, gradually pulling the load distribution out of its original design.
03
Incoming Material Temperature Variation
Slab or billet temperature inconsistency changes material flow stress at each stand, requiring dynamic force adjustment that a static schedule cannot provide.
04
Drive Response Differences Between Stands
Aging or under-maintained drives respond more slowly to load changes than newer stands, creating a lag that shows up as torque spikes during acceleration.
See Load Distribution Across Every Stand in Real Time
iFactory correlates force, torque, and motor load data across the full stand sequence, flagging imbalance before it becomes a quality or reliability issue.
Force and Torque Parameters Worth Tracking
Load Monitoring Parameter Reference
| Parameter | What to Watch For | Corrective Lever |
|---|---|---|
| Roll separating force per stand | Deviation from designed pass schedule | Adjust screw-down or pass reduction |
| Motor torque per stand | Sustained values near rated capacity | Rebalance speed and reduction split |
| Force variation across the coil | Trending drift within a single coil | Check roll wear and thermal camber |
| Torque spike frequency | Repeated spikes during threading or acceleration | Review drive tuning and acceleration ramp |
| Stand-to-stand load ratio | Drift away from original design ratio | Reschedule reduction distribution |
Outcomes From Consistent Load Monitoring
Tighter Gauge Control
Balanced force distribution reduces the deflection variability that drives gauge deviation, keeping product within tolerance more consistently across a coil.
Extended Roll Campaign Life
Rolls wearing at a similar rate across stands can run longer between changes, reducing both roll consumption cost and the frequency of changeover downtime.
Lower Motor and Drive Stress
Distributing load closer to design intent keeps individual motors further from their thermal and torque limits, extending drive component life.
Data-Driven Schedule Refinement
Historical force and torque trends by product grade give process engineers real evidence for refining the pass schedule instead of relying on static tables alone.
Steps to Start Optimizing Mill Load Distribution
Step 1
Baseline Current Force and Torque by Stand
Collect several weeks of data across your main product grades to understand the actual, not theoretical, load distribution across stands.
Step 2
Identify Consistently Overloaded Stands
Flag any stand running consistently above its designed share of total force or torque as a priority for schedule review.
Step 3
Adjust Pass Schedule or Roll Rotation
Rebalance reduction distribution or accelerate the roll change rotation for the overloaded stand based on what the baseline data actually shows.
Step 4
Monitor Continuously, Not Periodically
Keep force and torque tracking running continuously so drift caused by ongoing roll wear or material variation is caught early rather than at the next scheduled review.
Roll Force and Torque Monitoring — Common Questions
How much force imbalance between stands is considered a real problem?
There is no single universal threshold since it depends on mill design and product mix, but a consistent deviation of more than 10 to 15 percent from the designed load ratio across multiple coils is generally worth investigating. The more important signal is a sustained trend rather than a single reading, since normal process variation will always produce some fluctuation.
Can load monitoring data help extend the interval between roll changes?
Yes. When force and torque data show a stand's roll wear is progressing more slowly than assumed, that data supports safely extending its campaign length, while a stand showing faster wear can be flagged for earlier rotation. This turns roll change scheduling into a data-driven decision rather than a fixed interval applied uniformly.
Do we need new load cells installed, or can existing sensors be used?
Most mills already have force transducers and motor current or torque sensors in place for basic process control. iFactory's platform typically connects to that existing instrumentation first, adding analysis and cross-stand correlation rather than requiring a new sensor installation before any value can be delivered.
How does torque monitoring help beyond what force monitoring already shows?
Force data shows how much load a stand is absorbing, while torque data reveals how the drive system is responding to that load, including acceleration behavior and drive train stress. Together they distinguish a process-driven load issue from a drive or mechanical issue, which changes whether the fix belongs to process engineering or maintenance.
Is load optimization only relevant for new mill commissioning, or ongoing operation too?
Load balance drifts continuously as rolls wear and product mix changes, so it is an ongoing operational concern rather than a one-time commissioning task. Mills that treat load distribution as a continuously monitored parameter, rather than a setting configured once, see more consistent quality and roll life over time.
LOAD OPTIMIZATION · PROCESS MONITORING
Balance Your Mill Load Before It Costs You Quality
See how iFactory tracks force and torque across every stand to keep your rolling mill running closer to design intent.