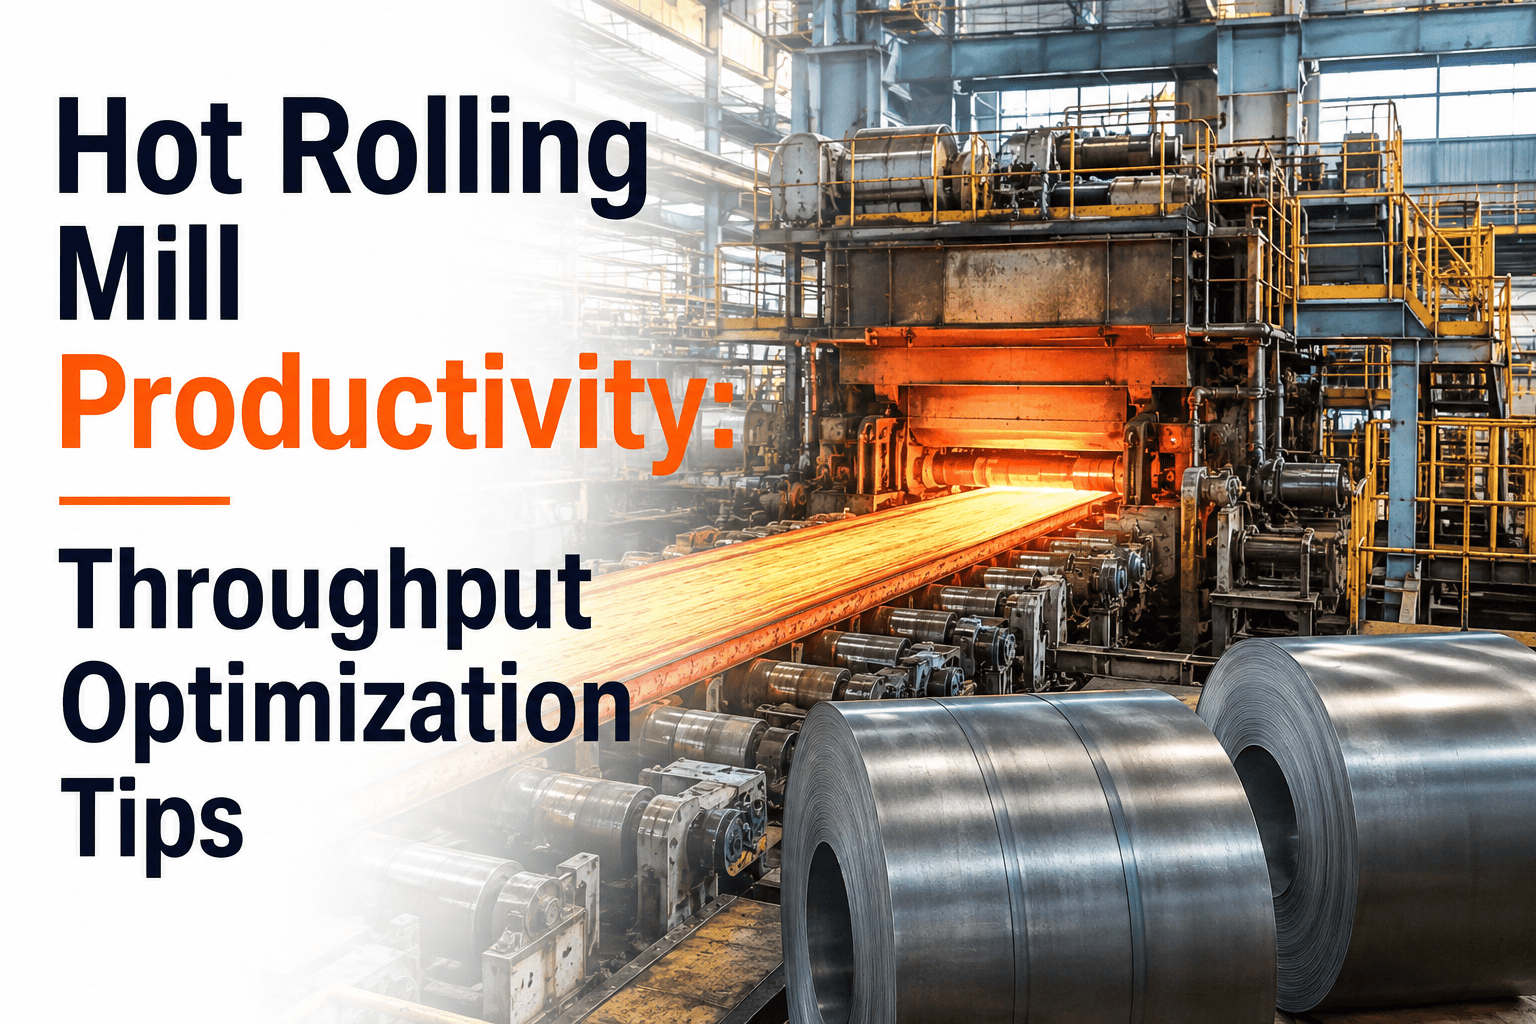
Hot Rolling Mill Productivity: Throughput Optimization Tips

By James Smith on August 26, 2026

hot-rolling-mill-productivity-optimization-throughput

Ask a rolling mill manager how many tons per hour the mill is capable of and you will get a confident number based on the equipment specification sheet. Ask how many tons per hour it actually produced last month and the number is almost always lower, sometimes dramatically so, and the gap between those two figures is rarely explained by one dramatic failure. It is explained by dozens of small delays, a few minutes waiting for a slab here, a schedule change there, a coil that needed rework, none of which show up as a single line item on a maintenance report but which together quietly consume a meaningful share of available production hours. Finding and closing that gap is a systematic exercise, not a guessing game, and the fastest way to see where your own mill is losing time is to book a demo with our team.

HOT ROLLING · THROUGHPUT · BOTTLENECK ANALYSIS

The Gap Between Rated Capacity and Actual Output Is Where the Real Opportunity Lives

Most hot rolling mills are not limited by their equipment, they are limited by accumulated delay that nobody has systematically measured. iFactory helps mill teams find exactly where tons per hour are being lost and turn that analysis into a prioritized improvement plan.

THE HIDDEN COST OF SMALL DELAYS

Why the Biggest Productivity Loss Is Never One Big Event

A dramatic equipment failure gets noticed, investigated, and fixed, precisely because it is dramatic. The far larger cumulative loss usually comes from a pattern of small delays that individually look insignificant, a few extra minutes waiting for the next slab to arrive at the reheat furnace, a schedule adjustment that creates an unplanned gap, or a coil pulled for inspection that briefly idles the line.

None of these events alone would justify a maintenance ticket or a formal investigation, but added up across a shift, a week, and a month, they can represent a larger share of lost throughput than every major breakdown combined. The reason this pattern persists in so many mills is simple, without systematic delay tracking, nobody has the data needed to see the pattern in the first place.

WHERE DELAYS COME FROM

Four Categories Where Rolling Mill Delay Consistently Hides

Material Availability Delay
Time lost waiting for the next slab or billet to reach the mill, often tied to upstream scheduling or reheat furnace timing rather than the mill itself.
Schedule Transition Delay
Gaps created when the rolling schedule changes product, gauge, or width, requiring roll gap and speed adjustments that briefly interrupt continuous throughput.
Quality Hold Delay
Line slowdowns or stoppages triggered by a coil flagged for inspection or rework, a necessary quality step that still consumes available production time.
Equipment Micro-Stops
Brief stoppages below the threshold most maintenance systems log as a formal event, individually minor but frequent enough to add up meaningfully over a month.
DELAY ANALYSIS METHOD

A Systematic Way to Find Where Your Mill Is Actually Losing Time

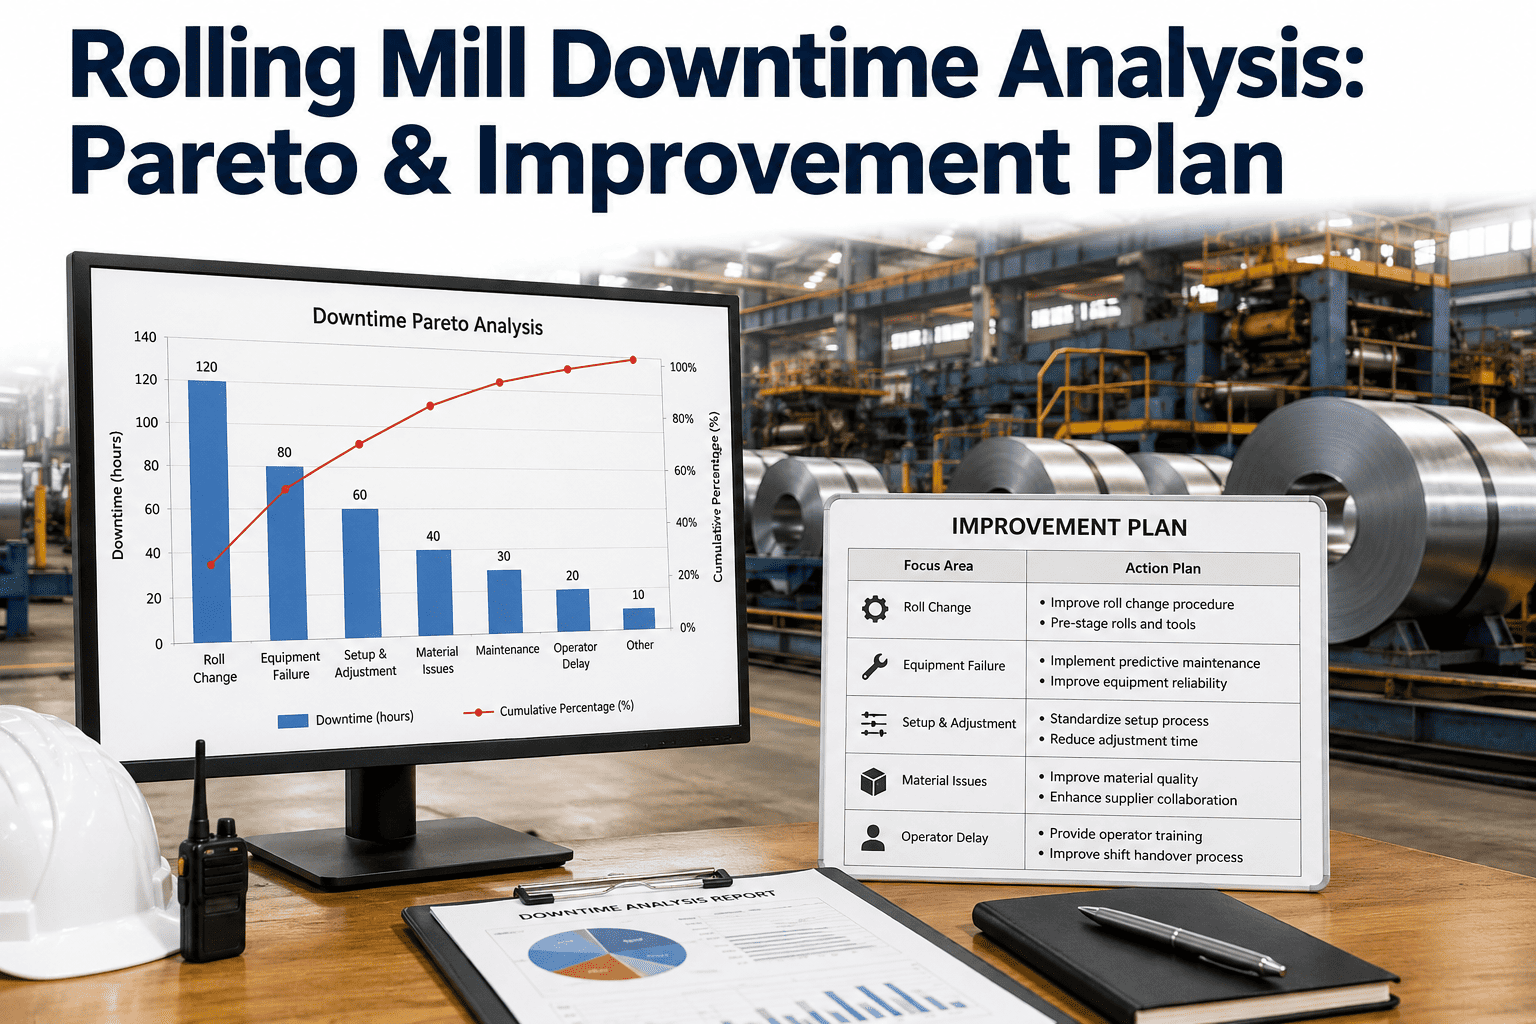
Closing the gap between rated and actual capacity starts with accurately categorizing every minute of lost production time, not estimating it. A mill that tracks delay systematically, by category, by shift, and by root cause, builds the evidence base needed to prioritize improvement effort where it will move throughput the most.

STEP 1
Capture Every Stoppage, Regardless of Duration
Log micro-stops alongside major events, since the smaller, more frequent delays are often where the largest cumulative loss actually hides.
STEP 2
Categorize Each Delay by Root Cause
Sort delay time into material availability, schedule transition, quality hold, and equipment categories, so patterns become visible instead of buried in a single generic downtime total.
STEP 3
Rank Categories by Total Time Lost, Not Frequency
A category with fewer but longer events can cost more total throughput than a category with many short ones, so prioritize based on cumulative minutes lost.
STEP 4
Target the Top Category With a Focused Improvement Plan
Address the single largest source of delay first, validate the improvement with the same tracking system, then move to the next category.

Find Out Exactly Where Your Mill Is Losing Tons Per Hour

iFactory captures and categorizes delay across your rolling schedule so improvement effort goes where it recovers the most throughput, not where it is most visible.

SCHEDULE OPTIMIZATION

Rolling Schedule Sequencing Is a Throughput Lever, Not Just a Logistics Task

The order in which products roll through a mill has a direct effect on total throughput that goes beyond simple scheduling convenience. Sequencing similar gauges and widths together reduces the frequency of roll gap and speed changes, and each avoided transition is time returned directly to productive rolling.

The same logic applies to grade sequencing where metallurgically compatible transitions minimize the need for extended interpass cooling or additional pass adjustments. A rolling schedule built with throughput sequencing in mind, rather than purely to satisfy delivery dates, often recovers meaningful capacity without a single piece of new equipment.

EQUIPMENT RELIABILITY'S ROLE

Reliability Is a Throughput Strategy, Not Just a Maintenance Metric

Equipment reliability and throughput are often tracked as separate metrics by separate departments, which obscures how directly connected they actually are. Every unplanned equipment stoppage, no matter how brief, removes production time that a fully scheduled preventive maintenance program is specifically designed to avoid.

Reliability Practice Throughput Impact
Condition-based roll change scheduling Reduces unplanned mid-schedule stoppages for roll wear
Predictive monitoring on drive and bearing systems Catches degradation before it forces an unplanned stop
Micro-stop root cause tracking Surfaces recurring small stoppages invisible to standard downtime logs
Planned maintenance windows aligned to schedule gaps Minimizes overlap between maintenance time and available production time
RESULTS MILLS REPORT

What Changes Once Delay Is Tracked Systematically

Visible
The true gap between rated and actual mill capacity
Prioritized
Improvement effort targeted at the largest delay category first
Fewer
Unplanned schedule transitions disrupting continuous rolling
Recovered
Production hours previously lost to untracked micro-stops
FREQUENTLY ASKED QUESTIONS

Questions Mill Managers Ask About Throughput Optimization

How much throughput is typically lost to delays too small to log formally?
It varies by mill, but delay analysis consistently shows that the sum of many short, unlogged stoppages often exceeds the total time lost to major, well-documented breakdowns. Without a systematic tracking approach that captures even brief stops, this category remains invisible even though it frequently represents the largest recoverable opportunity in the mill. Book a demo to see delay analysis applied to your own mill data.
Should schedule sequencing be optimized for throughput or for delivery priority?
The strongest approach balances both rather than treating them as opposing goals, sequencing similar gauges and compatible grades together where delivery timing allows, while still meeting customer commitments. In practice, most schedules have enough flexibility to group compatible transitions without meaningfully compromising delivery performance. Contact support to review sequencing options for your current schedule structure.
Is equipment reliability really a throughput issue rather than a maintenance issue?
It is both, and separating the two into different departmental metrics is exactly why the connection often goes unaddressed. Every unplanned stoppage, regardless of which department owns the equipment, removes production time directly, which means reliability improvements should be evaluated partly on their throughput impact, not maintenance cost alone. Book a demo to see reliability and throughput data connected in one view.
How long does a delay analysis project typically take before showing results?
Establishing a categorized baseline of delay across a representative production period, often a few weeks, is usually enough to identify the largest recoverable category and begin a focused improvement effort. Full realization of the recovered throughput then depends on how quickly the targeted improvement can be implemented on the floor. Contact support for a realistic timeline based on your mill's current tracking capability.
Do we need new sensors or equipment to start tracking delay this way?
In many cases the data needed already exists in existing mill control systems and historians, it simply has not been categorized and analyzed systematically. Starting with existing data sources is usually the fastest path to a useful baseline before considering any additional instrumentation. Book a demo to see what your existing systems can already reveal about delay patterns.

Close the Gap Between What Your Mill Can Do and What It Actually Does

iFactory turns scattered delay data into a prioritized, evidence-based plan for recovering real tons per hour on your rolling schedule.
Share This Story, Choose Your Platform!