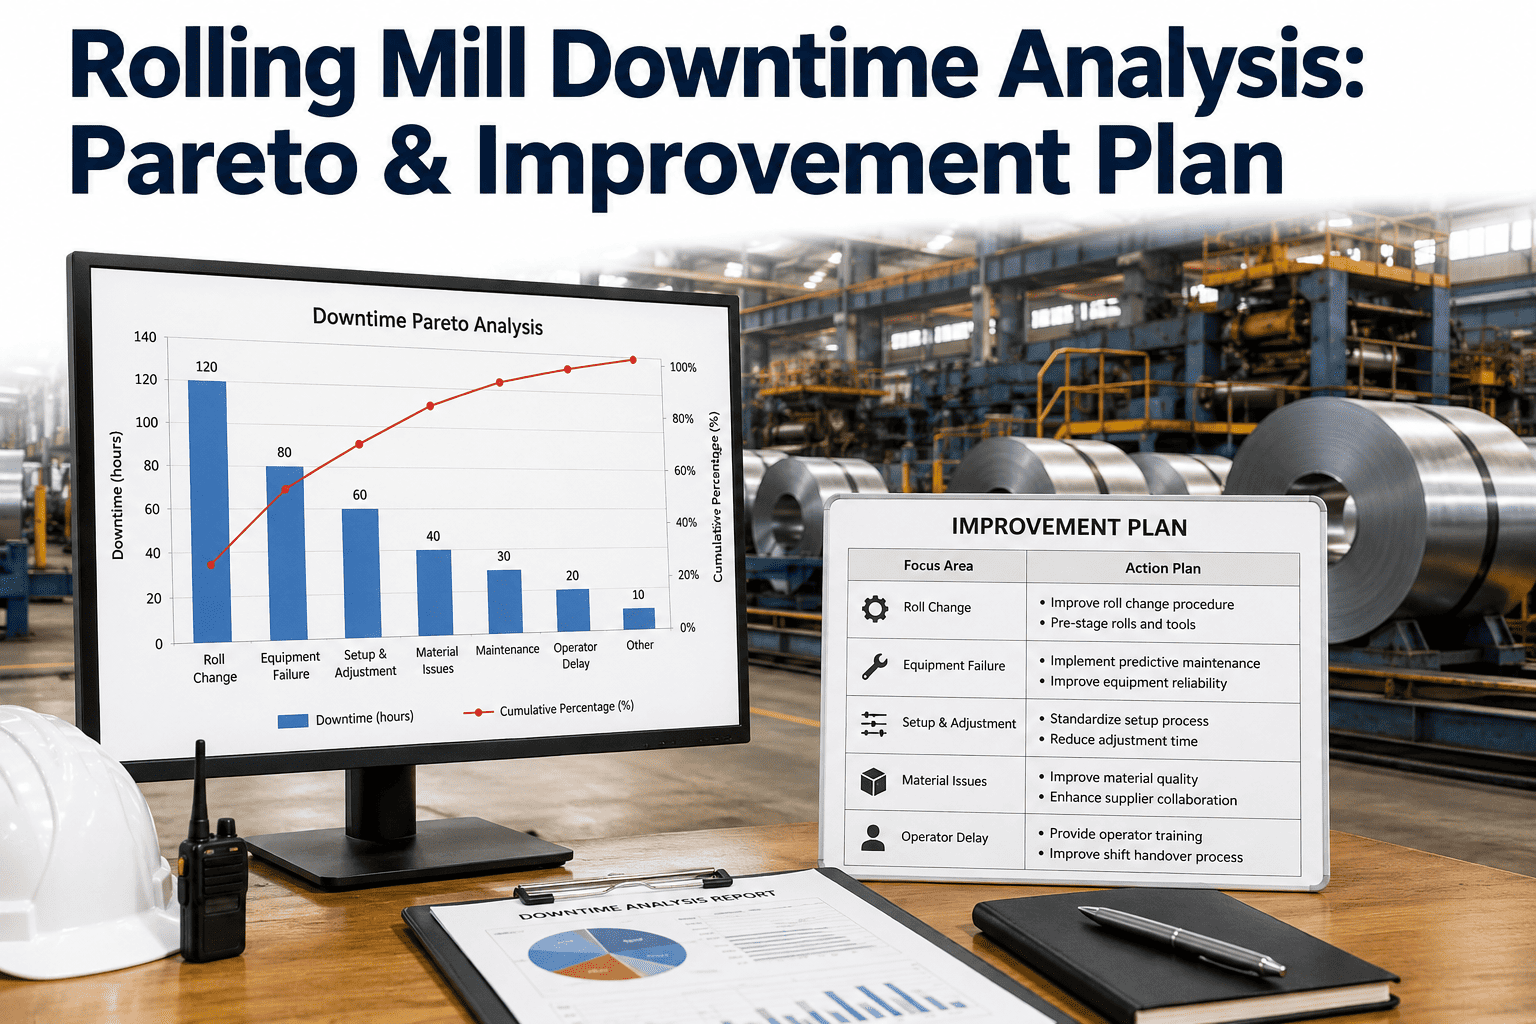
Most rolling mills already track downtime in some form, yet the same causes tend to resurface month after month because the data sits in a shift log instead of a structured improvement process. A Pareto view of downtime causes turns a long list of stoppages into a short list of priorities, showing exactly which handful of failure modes are responsible for the majority of lost hours. Building that discipline into a repeatable monthly cycle is where most mills stall, which is the piece iFactory's downtime analytics platform is designed to handle automatically.
ROLLING MILL · DOWNTIME ANALYSIS
Rolling Mill Downtime Analysis: Pareto Ranking and a Structured Improvement Plan
Rank delay causes by lost hours, investigate root cause on the top offenders, and track corrective action through closure instead of letting the same stoppage repeat next month.
The 80/20 Pattern Behind Most Mill Downtime
70-80%
of total downtime hours typically trace back to just 15-20% of recorded delay causes
Top 10
causes usually account for the majority of downtime, making them the correct starting focus
3-6 mo
typical timeframe to see measurable availability improvement from a structured Pareto cycle
40%+
of downtime causes recorded in shift logs are often too vague to drive any real corrective action
A Repeatable Downtime Analysis Cycle
Building a monthly improvement rhythm around downtime data turns a static report into a program that actually reduces lost hours over time.
1. Capture Standardized Causes
Every stoppage is logged against a fixed cause taxonomy rather than free text, so the same failure mode is never split across five different descriptions.
2. Rank by Lost Hours
Causes are sorted by total downtime impact, not frequency of occurrence, since a rare but long stoppage often outweighs a common short one.
3. Investigate the Top Offenders
Root cause investigation is applied to the top three to five causes on the Pareto chart, where the improvement effort delivers the largest return.
4. Assign and Track Corrective Action
Each root cause gets an owner, a target date, and a status that is reviewed until the action is verified closed, not just logged and forgotten.
5. Re-Rank the Following Month
A fresh Pareto ranking each month confirms whether resolved causes actually dropped off the list and surfaces the next priority to tackle.
Stop Re-Investigating the Same Downtime Every Quarter
iFactory automatically ranks delay causes by lost hours and tracks corrective action through closure, so your Pareto chart actually gets shorter over time.
Downtime Causes That Typically Top the List
Frequent Rolling Mill Downtime Categories
| Cause Category | Typical Share of Downtime | Primary Investigation Focus |
|---|---|---|
| Roll changes and setup | High frequency, moderate duration | Changeover procedure and tooling readiness |
| Drive and electrical faults | Lower frequency, high duration | Condition monitoring and preventive checks |
| Material handling delays | High frequency, low duration each | Upstream scheduling and logistics flow |
| Cobble and threading issues | Moderate frequency, high duration | Process parameters and guide condition |
| Planned maintenance overrun | Low frequency, high duration | Work scope estimation and parts readiness |
Where Most Downtime Tracking Falls Apart
Inconsistent Cause Codes
Without a fixed taxonomy, operators describe the same failure differently across shifts, splitting what should be one Pareto bar into several small ones that never rise to priority.
Manual Log Delays
Paper or spreadsheet logs completed at end of shift lose granularity on exact stop and start times, understating the true duration of shorter stoppages.
No Link to Corrective Action
A ranked list without an assigned owner and tracked status becomes a report that gets read once and never changes the following month's numbers.
Analysis Done Too Infrequently
Quarterly or annual downtime reviews are too slow to catch a new failure pattern early, letting a fixable issue repeat for months before it gets addressed.
Making Downtime Review a Standing Practice
1Automate cause code capture at the point of stoppage rather than relying on end-of-shift recall
2Review the Pareto chart in a fixed weekly or monthly meeting with maintenance and operations both present
3Limit root cause investigation to the top three to five causes so effort stays focused
4Assign every corrective action a named owner and a review date, not just a description
5Track availability improvement against the baseline to prove the program is working
Downtime Pareto Analysis — Common Questions
How is a downtime Pareto analysis different from a basic downtime report?
A basic report simply lists total downtime hours, while a Pareto analysis ranks causes specifically by their cumulative contribution, revealing which small number of causes account for the majority of lost hours. That ranking is what tells a team where to focus root cause investigation instead of spreading effort evenly across every recorded stoppage.
What is the right frequency for reviewing a downtime Pareto chart?
Weekly reviews work best for catching emerging patterns early, while a full monthly cycle is typically used for ranking, root cause investigation, and confirming whether prior corrective actions actually reduced their associated cause's share of downtime. Quarterly-only reviews tend to be too slow to prevent a recurring issue from compounding.
How do we standardize downtime cause codes across multiple shifts and operators?
A fixed, limited taxonomy of cause categories, presented as selectable options rather than free text at the point of stoppage, is the most effective way to keep coding consistent. Training operators on the taxonomy and periodically auditing entries against actual events also helps catch drift before it distorts the ranking.
Can this kind of analysis be automated instead of built manually in spreadsheets?
Yes. iFactory's platform captures stoppage events automatically from line signals where available, applies consistent cause coding, and generates a live Pareto ranking, removing the manual compilation work that often causes monthly downtime reviews to fall behind or get skipped entirely.
How do we know if our downtime improvement program is actually working?
The clearest signal is whether the causes at the top of the Pareto chart change over time, meaning previously addressed causes drop in ranking while overall mill availability trends upward. Tracking availability against a fixed baseline each month, alongside the Pareto ranking itself, gives a clear and defensible measure of program impact.
DOWNTIME ANALYTICS · MILL AVAILABILITY
Turn Your Downtime Log Into a Real Improvement Plan
See how iFactory ranks delay causes automatically and tracks corrective action through closure across your rolling mill.