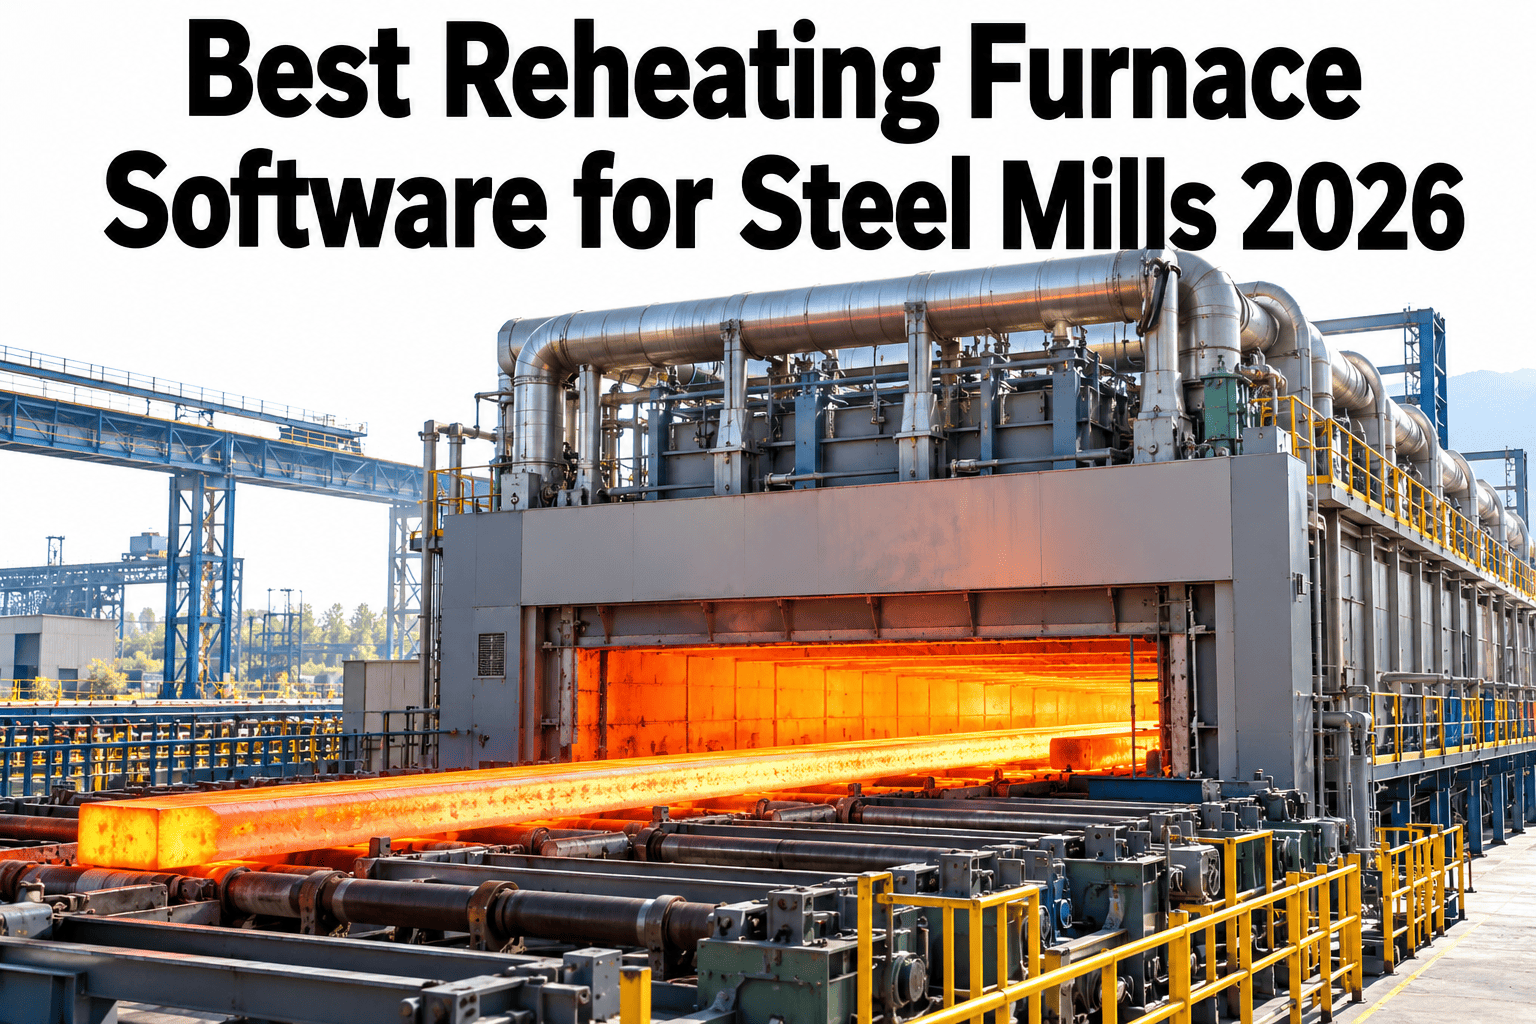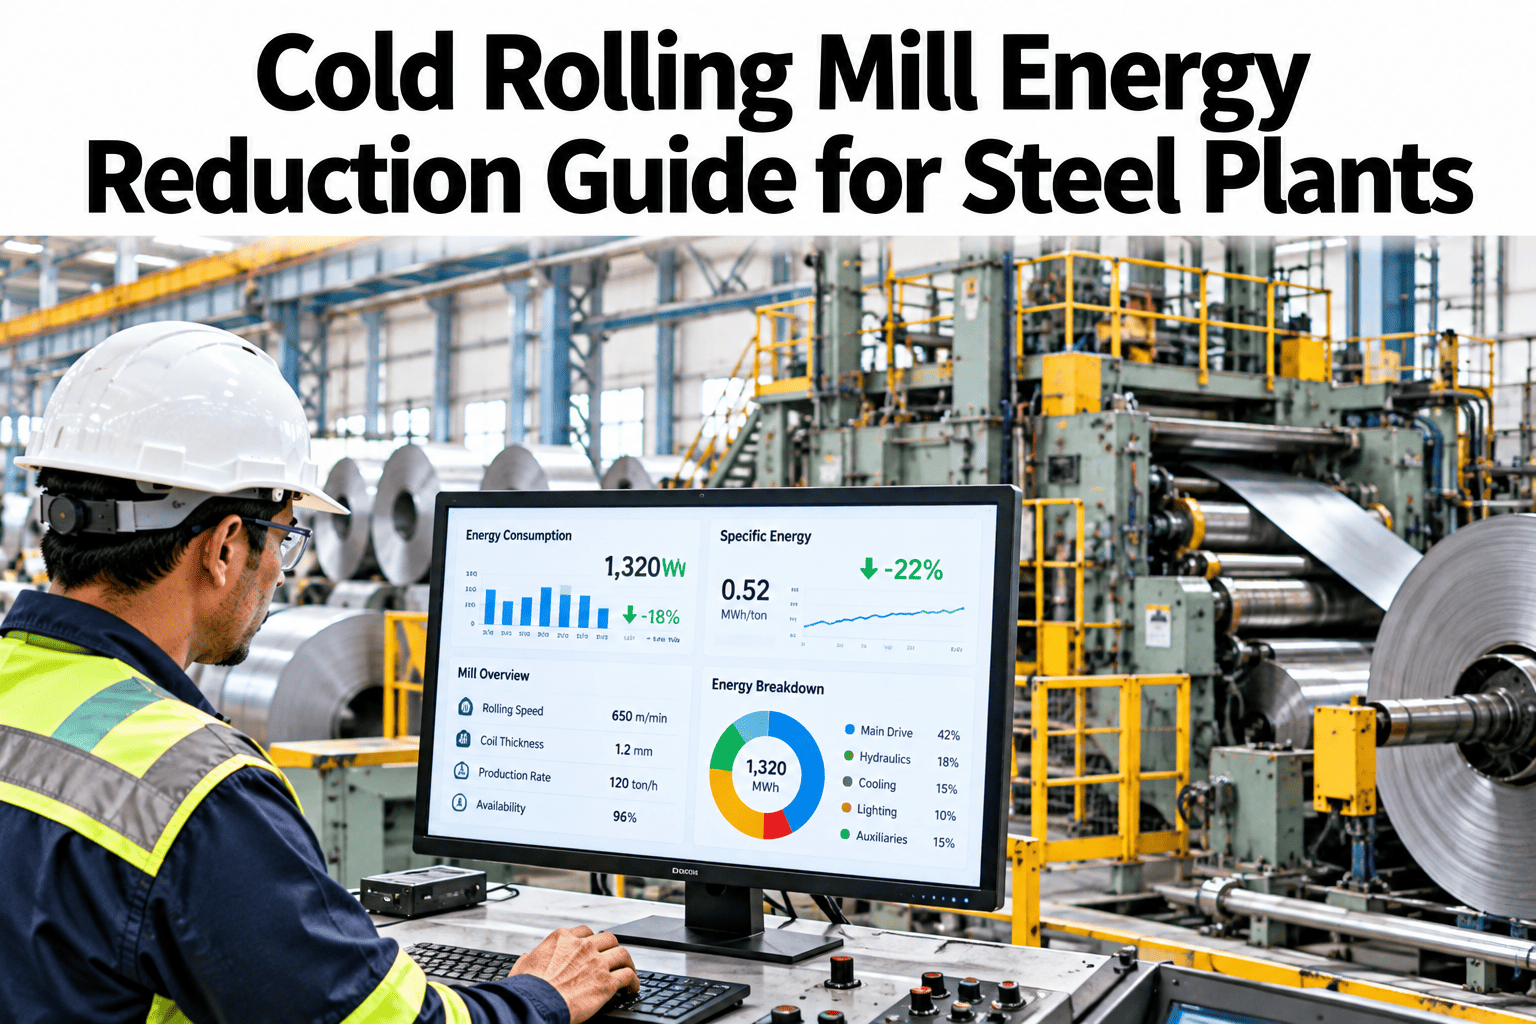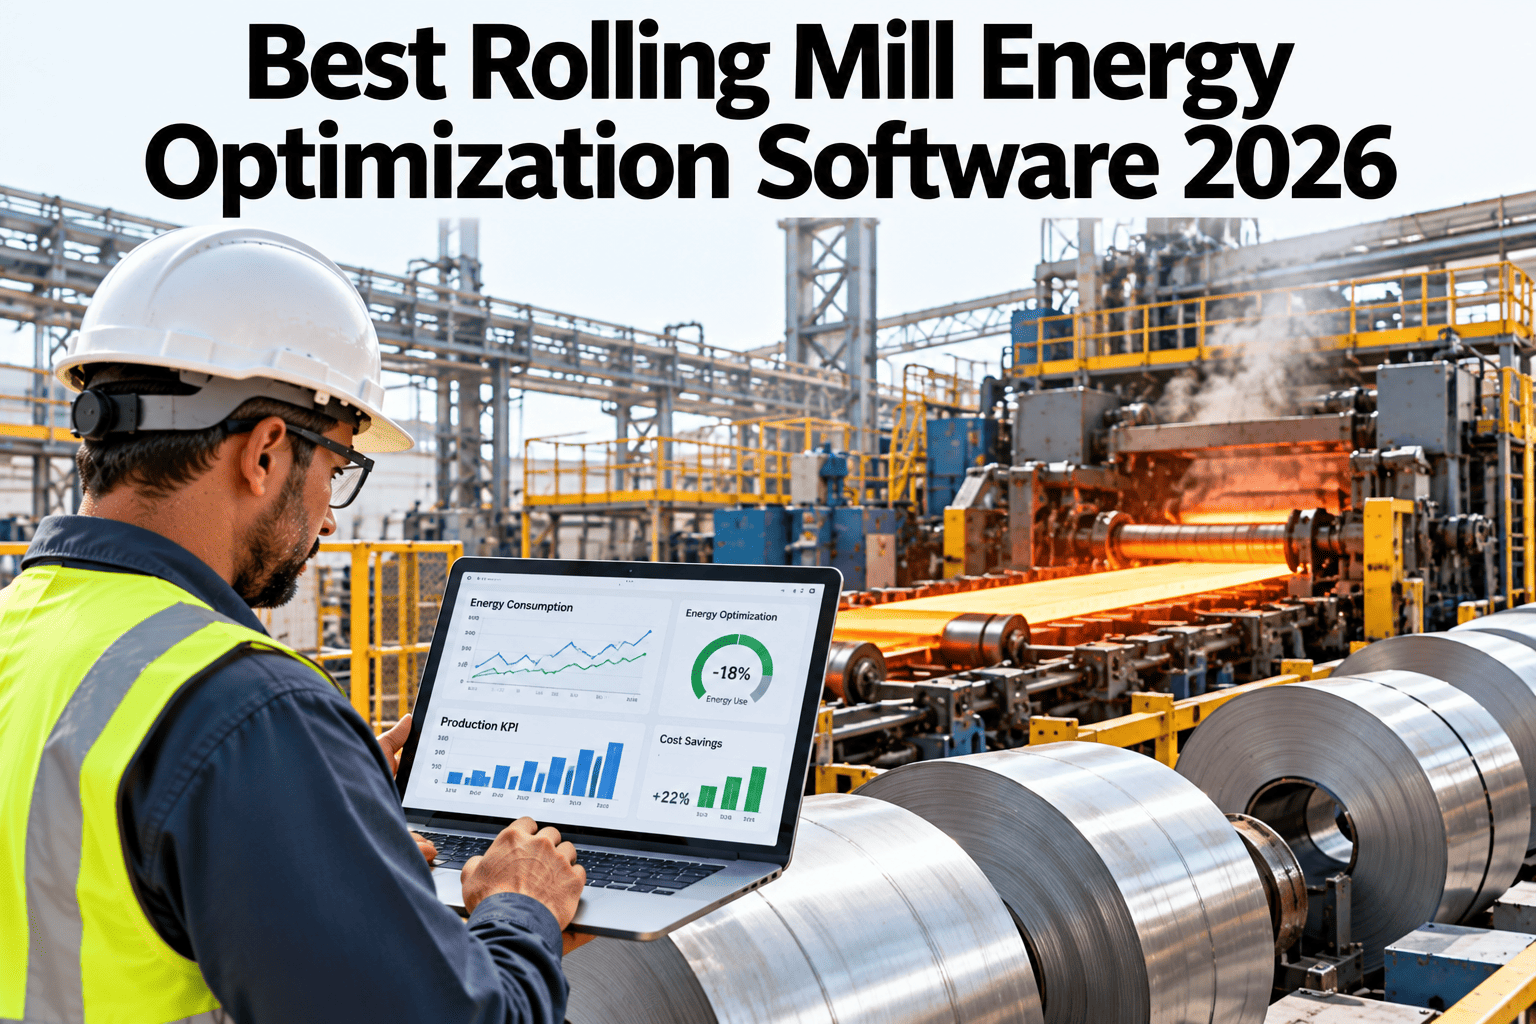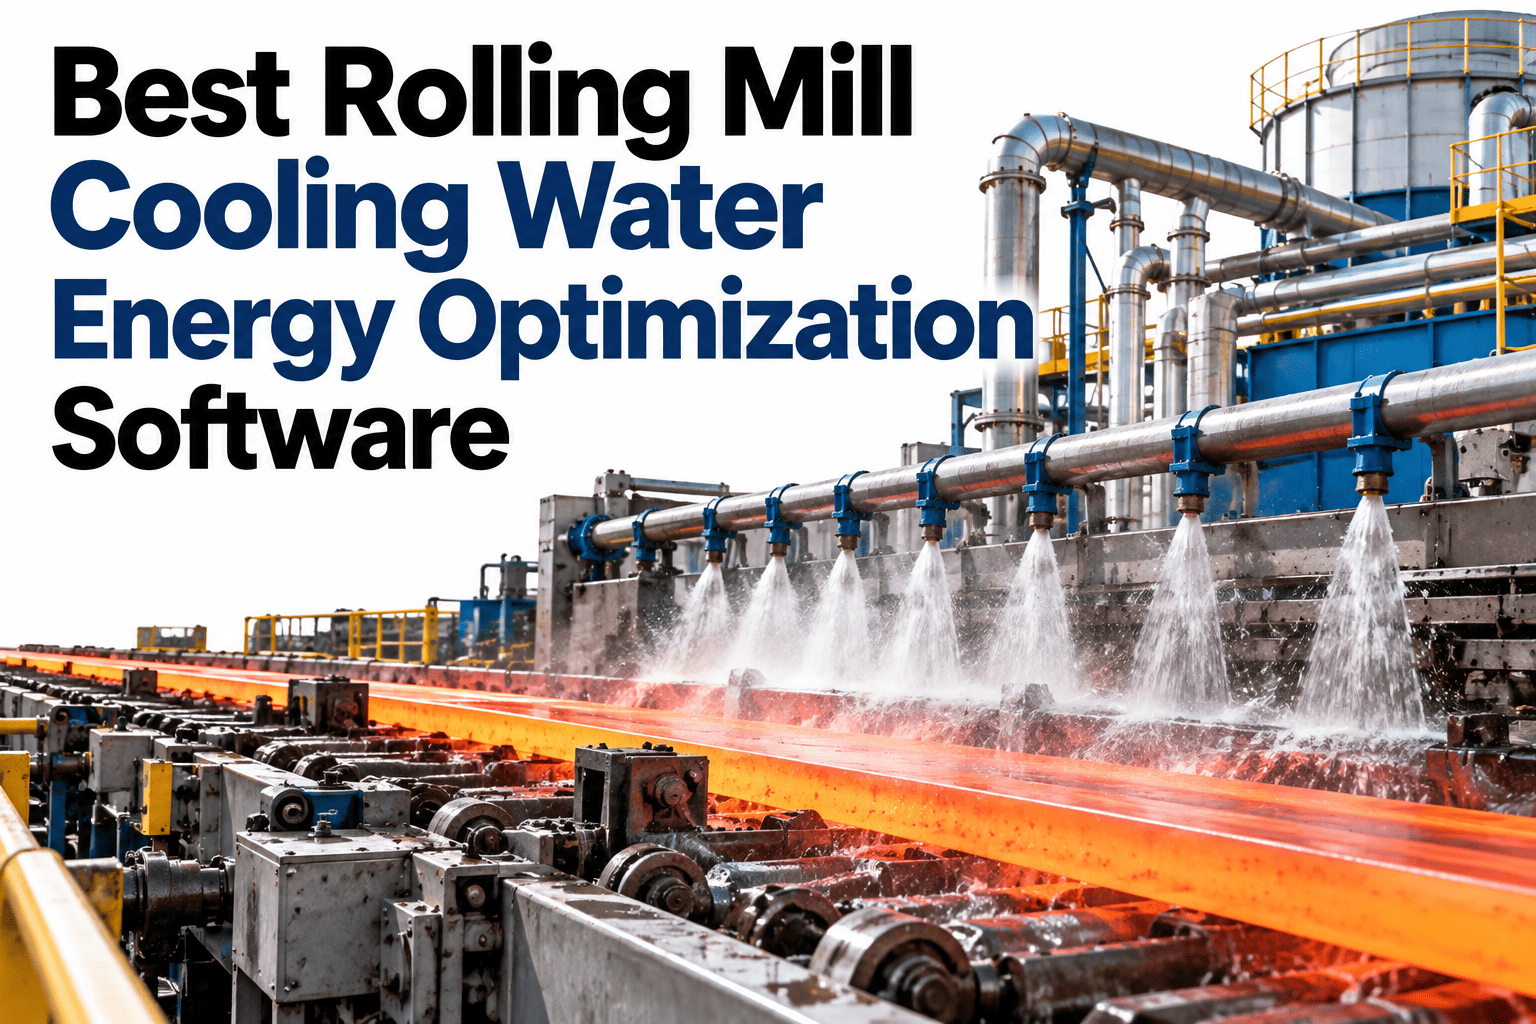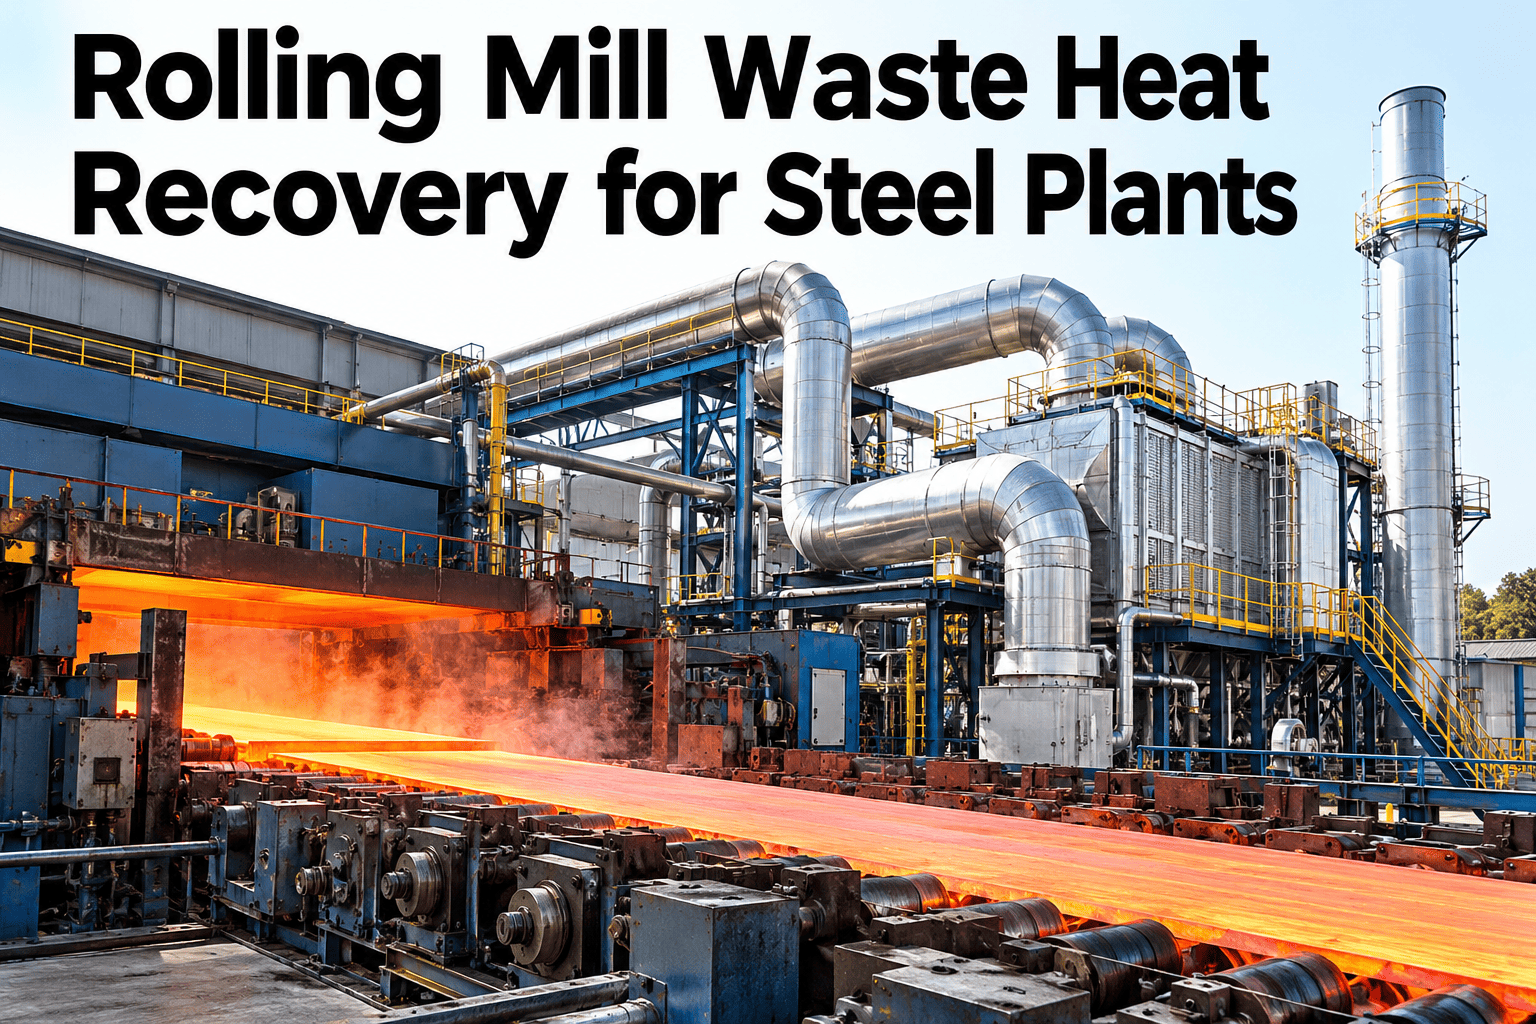
A rolling mill radiates a surprising amount of usable heat that most plants simply let escape: the cooling bed releases heat as rolled sections cool to handling temperature, the strip surface carries significant thermal energy right after the finishing stand, and skin-pass mills generate residual heat that rarely gets captured. None of this requires a new furnace to fix, just a ranked view of which recovery project actually pays back fastest on your specific mill. See waste heat recovery projects ranked by payback for your mill.
Turn Radiated Heat Into a Ranked Recovery Plan
iFactory AI maps waste heat across cooling beds, strip surfaces, and skin-pass mills, then ranks recovery projects by payback and technical feasibility.
Three Sources, Three Different Recovery Paths
Not every heat source is worth the same recovery investment. The economics differ sharply by source.
Recovery Projects Ranked by Payback
A composite ranking of common rolling mill waste heat recovery projects by typical payback period.
| Project | Heat Source | Typical Payback | Technical Complexity |
|---|---|---|---|
| Cooling bed air preheat | Cooling bed | 12-18 months | Low |
| Strip surface recuperation | Strip surface | 18-30 months | Moderate |
| Skin-pass heat capture | Skin-pass mill | 30-48 months | Moderate |
| Combined cascade recovery | All three sources | 20-28 months | High |
See Your Own Mill's Recovery Projects Ranked
Book a 30-minute session and iFactory AI will rank recovery projects by payback for your own mill layout.
Why Rankings Shift Mill to Mill
The same project can rank very differently depending on your mill's product mix and layout.
Product Mix
Heavier sections hold cooling bed heat longer, improving that project's economics.
Mill Layout
Distance from heat source to a usable sink changes capture efficiency significantly.
Existing Infrastructure
A plant with usable ducting already in place sees faster, cheaper payback.
Downstream Heat Demand
Recovery only pays off where there is a real use for the captured heat nearby.
A Composite Feasibility View
Across several mills, technical feasibility and payback do not always move together. Darker cells show stronger project fit.
How the Ranking Model Works
The model combines heat availability with your specific mill's layout and infrastructure to produce a ranking that reflects real conditions, not a generic benchmark.
Heat availability is measured across cooling bed, strip surface, and skin-pass sources.
Capture efficiency is estimated against your mill's layout and distance to a usable sink.
Downstream demand for the recovered heat is matched against nearby processes.
Projects are ranked by payback period and technical complexity side by side.
Rolling It Out at the Mill
iFactory AI arrives turnkey, built to read temperature and production data already available at most mills.
Frequently Asked Questions
Does this include the capital cost estimate for each project?
Yes, each ranked project includes an estimated payback period that factors in typical capital cost for that recovery type, calibrated against your mill's specific layout. Support can walk through the estimate methodology for your site.
Can this rank projects for a mill that already has some recovery in place?
Yes, existing recovery infrastructure is factored into the ranking, since remaining unused heat and existing ducting both change the economics of further projects.
How long does the heat survey take?
The initial survey typically runs during the first three weeks of rollout, using existing temperature sensors supplemented by targeted measurement where gaps exist. See a sample survey report in a walkthrough.
What if our mill has no nearby use for recovered heat?
Downstream demand is one of the ranking factors, so a project without a realistic heat sink nearby ranks lower rather than being recommended regardless. The report flags this explicitly rather than assuming a use case.
How does this connect to our broader energy reporting?
Recovered heat volume and resulting fuel savings roll into your energy benchmarking the same way other efficiency gains do. Ask support how recovery savings are tracked in your energy reports.
Stop Guessing Which Recovery Project Pays Back First
iFactory AI ranks waste heat recovery projects by payback and feasibility for your own mill. Book a walkthrough to see your ranked plan.