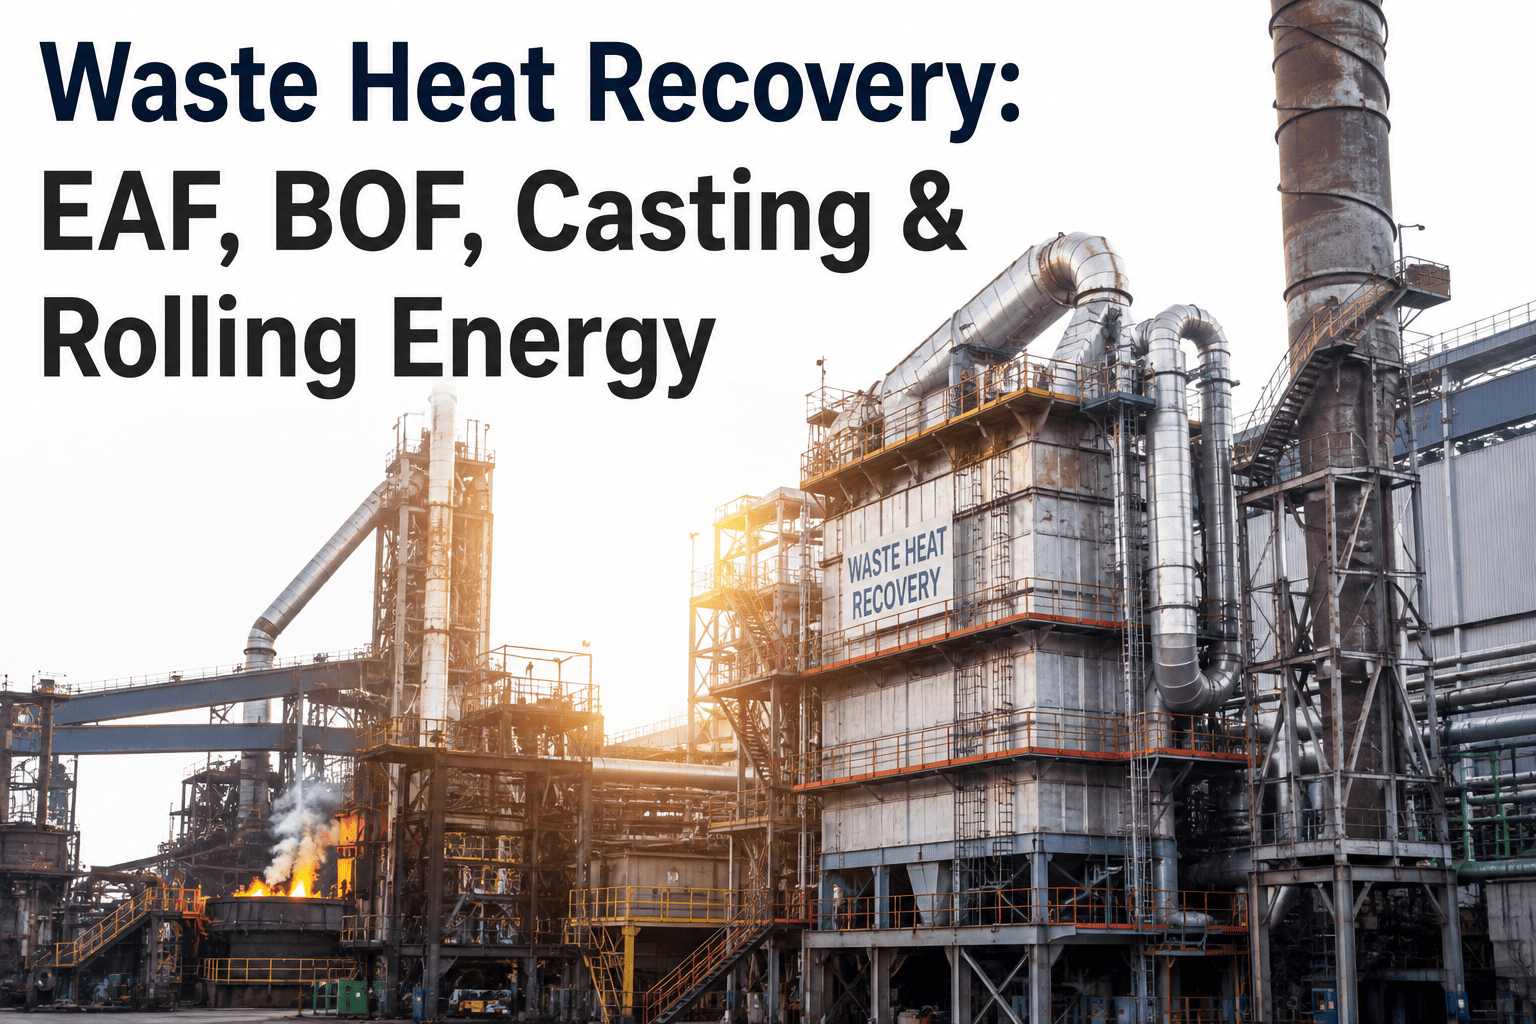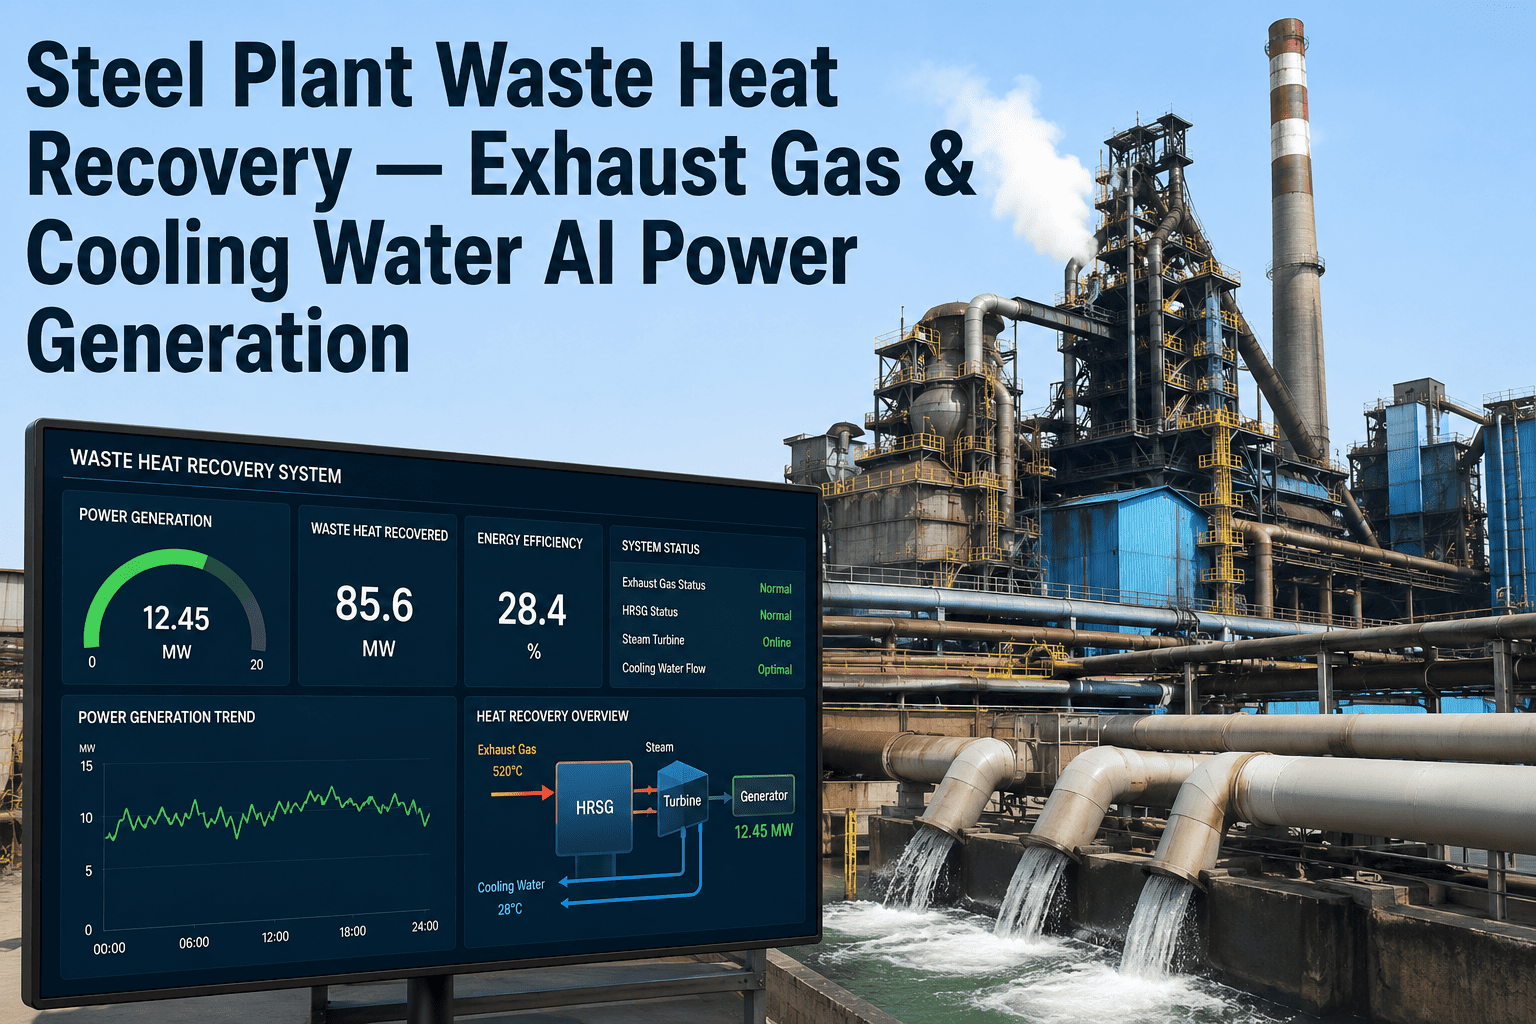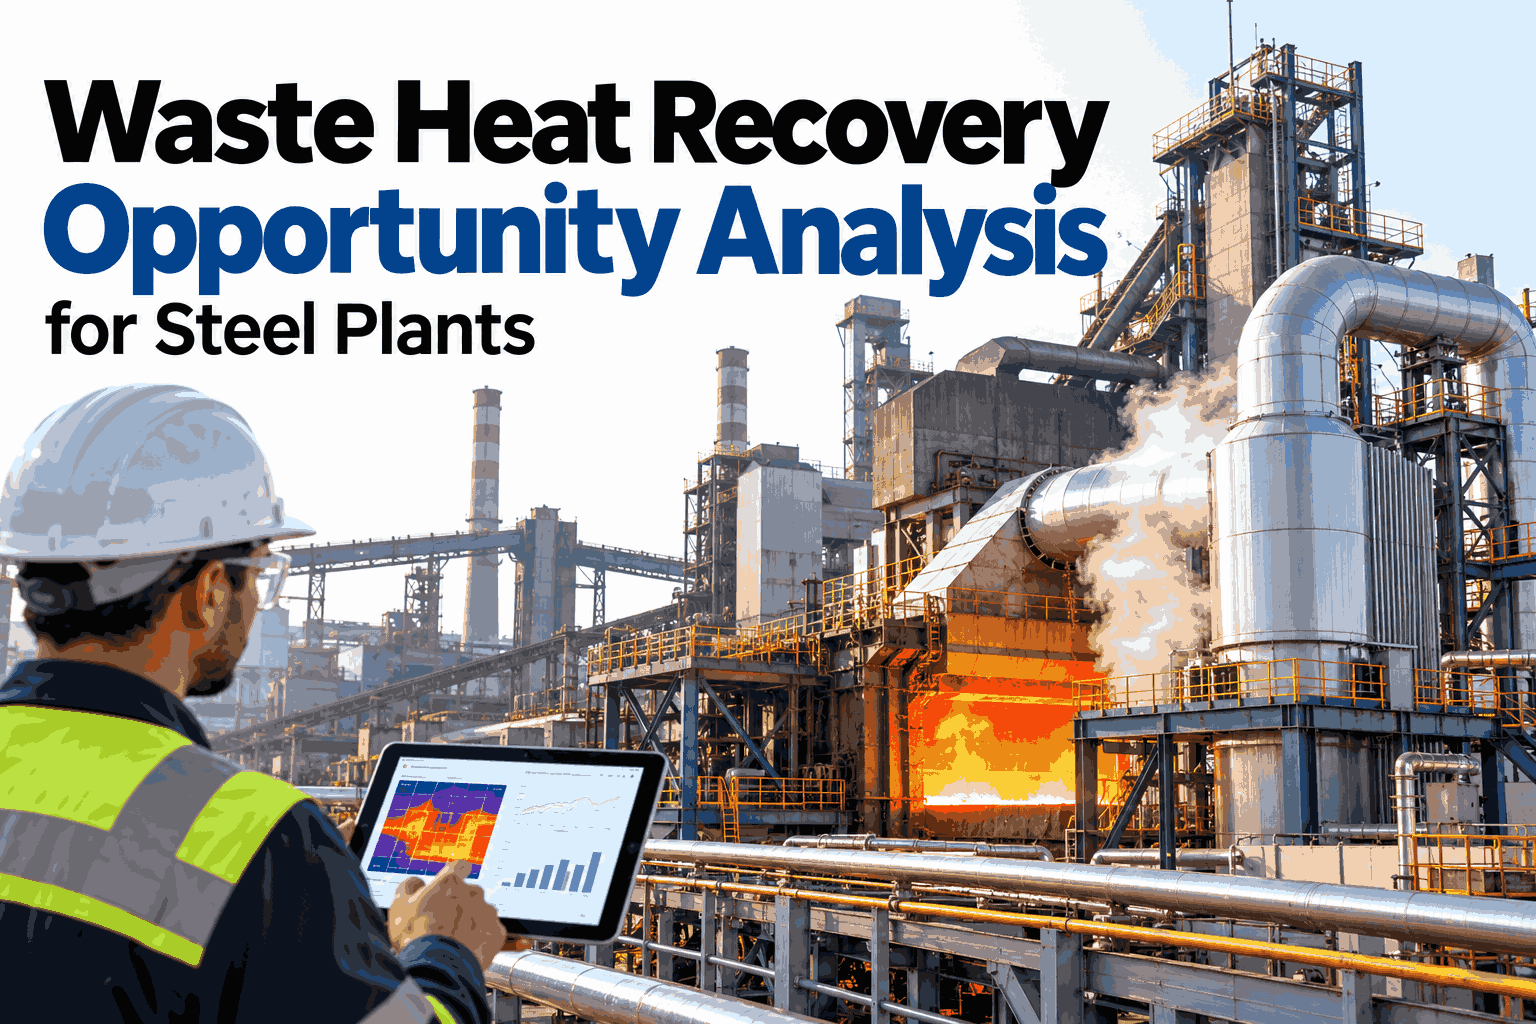
A steel plant throws away more usable heat than most energy teams can list. Hot flue gas, cooler exhaust, top gas pressure, hot coke and mill cooling water all carry energy that could offset fuel or generate power, but each stream has a different temperature, a different flow and a different owner. Projects get proposed one at a time and are judged on the vendor's numbers, so the plant never sees which ones matter most. A proper opportunity analysis ranks every stream on the same measured basis before any capital is committed. Teams that want that ranking can ask iFactory AI's team to map their waste heat streams against real plant data.
Rank Every Waste Heat Stream Before You Fund a Single Project
iFactory AI measures temperature, flow and availability across the plant, so recovery projects are ranked on evidence and not on vendor estimates.
The Heat Grade Ladder
Temperature decides what heat can do. The ladder shows the three grades, the technology that usually suits each and the typical plant sources.
Source by Source
Each source has a usual recovery route and a usual trap. The table gives a starting view for a typical integrated plant.
| Source | Waste Stream | Typical Recovery Route | Watch-Out |
|---|---|---|---|
| Sinter plant | Cooler exhaust and main stack gas | Waste heat boiler, steam or power | Dust, variable flow and temperature |
| Blast furnace top gas | Gas pressure and low-calorific fuel gas | Top gas recovery turbine, gas as fuel | Needs sufficient top pressure and clean gas |
| Coke oven | Hot coke and oven flue gas | Dry quenching with steam generation | High capital, plant layout constraints |
| Reheating furnace | Flue gas from firing | Recuperators or regenerative burners | Furnace stability and burner control |
| Converter or EAF | Off-gas and sensible heat | Gas recovery, steam generation | Batch operation causes swings in flow |
| Rolling mill | Cooling water and hot stock | Low-grade recovery, hot charging | Low temperature limits the value |
See Which Streams in Your Plant Are Worth Chasing
Book a 30-minute session and iFactory AI will show heat streams ranked by recoverable energy from your own temperature and flow data.
The Opportunity Map
Potential alone does not decide the order. The chart plots six illustrative projects by energy potential and ease of implementation. Projects toward the top right are the best places to start.
Three Routes From Heat to Value
Recovered heat only pays if something uses it. Each route has a source, a medium and an end use.
Back Into the Process
Flue gas preheats combustion air or charge, so the same furnace burns less fuel per tonne.
Steam and Power
A boiler and turbine turn heat into steam for the plant or electricity for the grid connection.
Low-Grade Use
Heat is used for space, water or process heating, or converted through an organic cycle where economic.
Illustrative Payback, Ranked
Payback varies widely by site, fuel price and operating hours. The bars show one illustrative ranking of simple payback in years and should never replace a site study.
Measure Before You Build
Most failed recovery projects were sized on averages that the plant never actually delivers. Six measurements protect the business case.
Five Gates From Idea to Payback
Each project should pass the same gates in order, and the evidence at each gate should come from plant data.
A Composite Scenario: Where the Fuel Went
A reheating furnace lost about a third of its fuel energy up the stack. The bars show fuel energy per unit of steel before and after a recuperator, with illustrative values.
Where iFactory AI Fits
Temperature, flow and fuel data are usually spread across separate systems. iFactory AI joins them and ranks streams on a shared basis.
Stream Inventory
Every waste heat source is listed with temperature, flow and running hours.
Recoverable Energy Sizing
Sizing uses measured variation, not a single design-point average.
Project Ranking
Projects are ranked on potential, ease and payback with assumptions visible.
Post-Project Verification
After commissioning, fuel and power per tonne confirm whether the saving arrived.
Frequently Asked Questions
Which waste heat project usually pays back fastest?
Simple, high-temperature and steady sources tend to pay back fastest, and reheating furnace flue gas is a common example. Large projects with high capital cost, such as coke dry quenching, can be worthwhile but take longer. The order always depends on your fuel price, operating hours and layout. iFactory AI's team can build a ranked shortlist from your measured data.
Is low-grade heat worth recovering?
Sometimes, but it needs a clear use. Low-grade heat is abundant, yet its low temperature limits what it can do. It pays when there is a nearby demand for heat, or where an organic cycle can be justified by steady flow and high running hours. Without a defined end use, the recovered heat has no value, so the demand side should always be confirmed first.
Why do recovery projects underdeliver?
The most common reason is sizing on design values that the plant never sustains. Lower load, more outages, fouling and variable flow all reduce the real recoverable energy. Measuring the stream across its true operating range before design avoids most of these surprises. See how measured stream data is presented in a short walkthrough.
Does iFactory AI design the recovery equipment?
No. iFactory AI provides the measurement, analysis and ranking that a good design depends on, and later verifies the result. Equipment design and supply remain with specialist engineering firms and vendors. Plants that bring measured stream data to those conversations usually get better-sized proposals and can compare bids fairly, because every bidder starts from the same numbers.
How does this connect to energy per tonne?
Recovered heat lowers the fuel or electricity a plant needs per tonne of steel. Because iFactory AI tracks energy at the level of the step and the heat, the effect of a project appears directly in GJ per tonne and kWh per tonne. Ask support how project savings are verified in the energy view.
Fund the Heat Recovery Projects the Data Supports
iFactory AI ranks every waste heat stream on measured evidence and verifies the savings afterwards. Book a walkthrough to see it on your own plant data.