Ask most maintenance teams how their spare parts inventory is performing and the answer tends to be a feeling rather than a number — storeroom feels full, or a critical bearing was out of stock again last month. That feeling is not a metric, and it cannot tell a plant manager whether the inventory investment is protecting uptime efficiently or just quietly tying up working capital on shelves nobody touches. Spare parts KPIs exist to replace that feeling with a number that can be tracked, benchmarked, and improved. iFactory calculates these KPIs automatically from the transactions already happening in your storeroom.
Spare Parts · Inventory KPIs
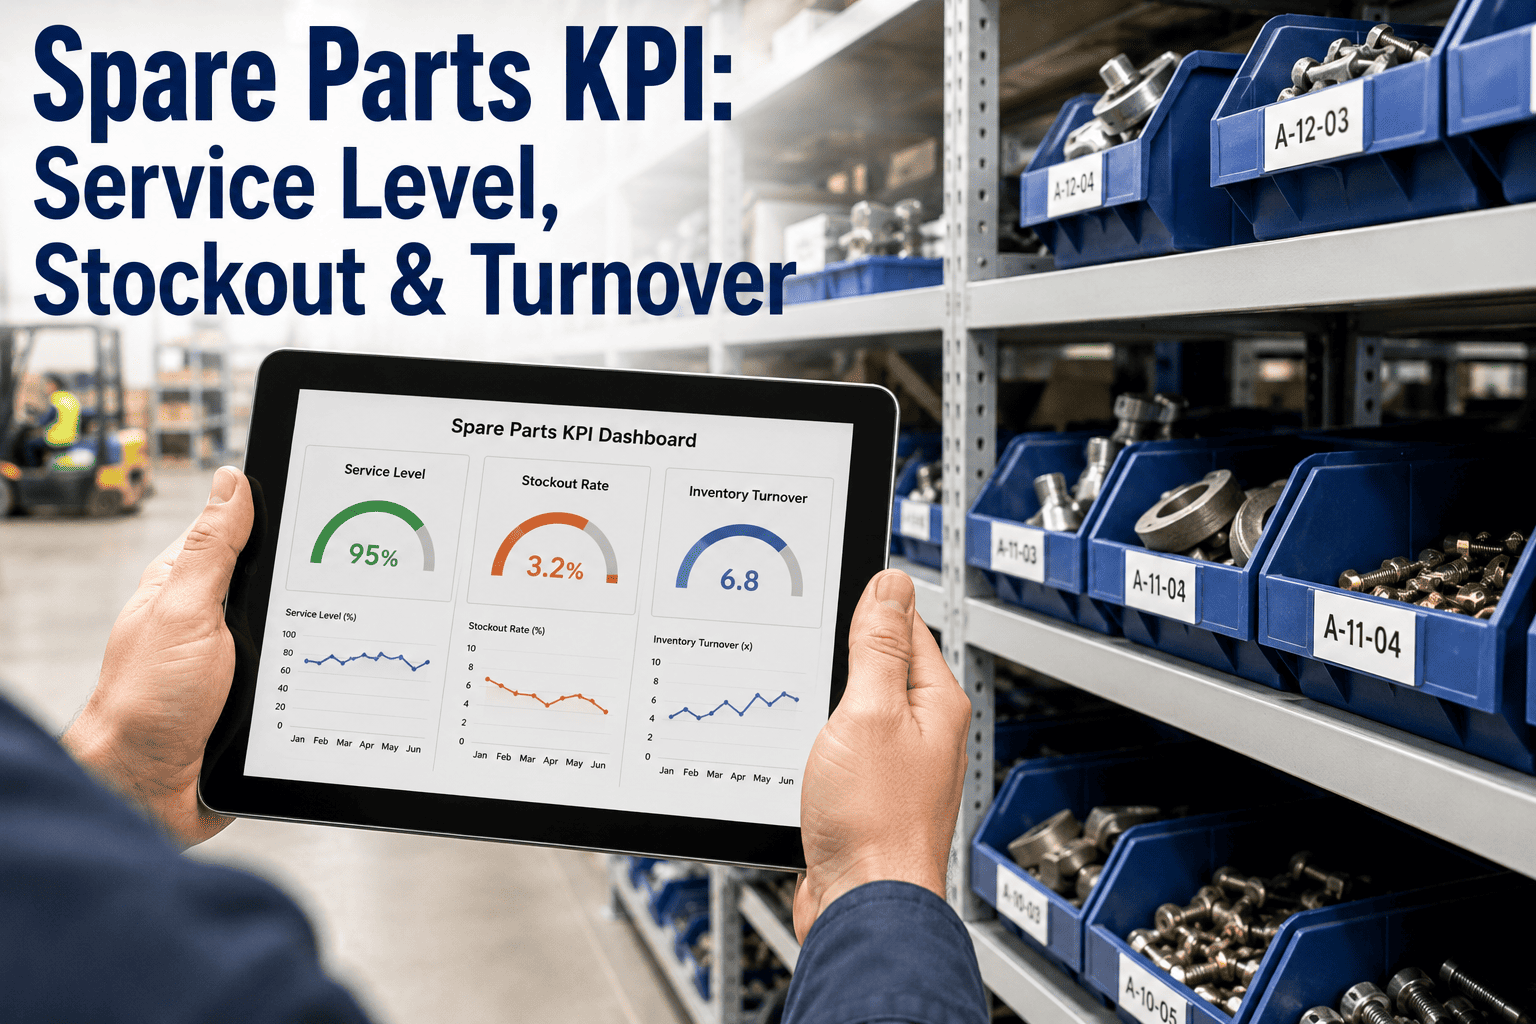
Six Numbers That Tell You Whether Your Storeroom Is Working
Service level, stockout rate, turnover, and carrying cost together describe whether spare parts inventory is protecting uptime efficiently or just consuming capital. iFactory tracks all six automatically, by part and by criticality class.
The KPI Dashboard
Six Metrics, Six Target Ranges
Industry benchmarking across manufacturing MRO programs converges on a consistent set of target ranges for these six metrics. No single plant will hit every target simultaneously — critical spares justify holding inventory well above what carrying-cost optimization alone would suggest — but the ranges give every metric a reference point instead of a guess.
Fill Rate
99%+ for critical (VED "A" class) items
Stockout Rate
On critical spares, measured monthly
Inventory Turnover
Annually, for general MRO inventory
Carrying Cost
Of average inventory value, per year
Obsolescence Rate
Share of total inventory value, dead stock
Emergency Purchase Ratio
Share of total purchase orders, rush-priced
Why This Number Matters
Spare Parts Are Not a Rounding Error in the Maintenance Budget
MRO inventory commonly accounts for a large share of total maintenance spend, which is why the KPIs above are not a bookkeeping exercise. Even modest improvement in service level or carrying cost translates directly into either avoided downtime or freed working capital, both of which show up on financial statements a plant manager is asked to explain.
MRO inventory share of total maintenance budget
From Feeling to Formula
A Storeroom That "Feels Fine" Can Still Be Losing Money Two Ways at Once
iFactory calculates fill rate, stockout rate, turnover, and carrying cost from real transaction data, by part and by criticality, so overstock and stockout risk both surface before they become a budget or downtime problem.
Two Ways to Get It Wrong
Overstock and Stockout Are the Same Root Problem
Both failure modes trace back to the same missing discipline — parts stocked by habit or gut feel rather than by criticality and actual demand pattern. Fixing one without addressing the other tends to just push the storeroom from one failure mode to the opposite one.
Overstock
Capital Sitting Idle on the Shelf
Slow-moving and dead stock accumulates because nobody reviews usage history, inflating carrying cost and consuming storeroom space that could hold parts that actually turn.
Stockout
The Part That Is Never There When Needed
Critical spares run out because reorder points were set once and never revisited, forcing emergency purchases at rush pricing and extending downtime while the part is expedited.
How Tracking Actually Works
Turning Storeroom Transactions Into Live KPIs
Calculating these KPIs by hand from spreadsheet exports is possible but rarely sustained past the first quarter. Automating the calculation from the transactions already happening in the storeroom is what keeps the numbers current enough to act on.
01
Criticality Classification
Every part is tagged by criticality (VED) and demand pattern (ABC/XYZ) so KPI targets can be set appropriately for each class rather than applied uniformly.
02
Transaction Capture
Issues, receipts, and stockout events are logged automatically as parts move against work orders, forming the raw data every KPI is built from.
03
KPI Calculation
Fill rate, turnover, carrying cost, and the remaining metrics are calculated continuously by part, category, and criticality class.
04
Threshold Alerts
Parts drifting outside target range, whether toward dead stock or toward stockout risk, are flagged before the trend becomes a budget or downtime issue.
05
Reorder Optimization
Min/max and reorder points are recalculated against actual lead-time demand rather than left static after the initial setup.
Where This Discipline Pays Off
Operations Running Large, Complex Spare Parts Catalogs
KPI-driven spare parts management delivers the strongest return in facilities managing thousands of SKUs across critical and routine categories, where manual tracking simply cannot keep pace with the volume of transactions.
Integrated Steel and Rolling Mills
High-value critical spares like drive components and roll assemblies carry severe downtime cost if a stockout occurs, making fill rate discipline essential.
Heavy Manufacturing and Fabrication
Diverse equipment fleets generate wide-ranging part demand patterns that benefit from criticality-based reorder optimization rather than uniform stocking rules.
Power Generation and Utilities
Large MRO inventories carrying tens of millions in value make even modest carrying-cost and obsolescence improvement financially significant.
Mining and Materials Processing
Remote sites with long supplier lead times face outsized stockout consequences, raising the value of accurate, criticality-driven fill rate targets.
Common Questions
Frequently Asked Questions
Should every spare part in the storeroom be held to the same fill rate target?
No — applying a uniform fill rate target across the whole catalog is one of the most common mistakes in spare parts management. Critical spares tied to high-consequence failures justify a 99%-plus fill rate target even at higher carrying cost, while routine, low-consequence parts can run at a lower fill rate without meaningfully increasing downtime risk. Criticality classification has to come before target-setting, or the targets end up either too loose on critical items or too expensive on routine ones.
Our storeroom feels overstocked but we still have stockouts on critical items — is that normal?
It is common, and it usually points to the same underlying issue rather than two separate problems: parts are stocked based on habit or convenience rather than actual usage pattern and criticality. Slow-moving, low-consequence parts accumulate because nobody reviews them, while high-consequence parts run lean because reorder points were set once and never revisited against changing demand or lead time. Fixing the classification and reorder logic together typically resolves both symptoms at once.
How is carrying cost actually calculated, since it is not a single line item on an invoice?
Carrying cost aggregates several components that rarely live in one place — capital cost tied up in inventory, storage and warehousing expense, insurance, handling labor, and obsolescence risk — expressed as a percentage of average inventory value per year. Most sites start with a reasonable estimate in the 20 to 30 percent range and refine it as they gather more specific data on their own storage and capital costs, since the exact figure varies meaningfully by facility and industry.
Can these KPIs be tracked without replacing our existing inventory or ERP system?
Yes — iFactory calculates these KPIs from transaction data pulled from your existing inventory or ERP system rather than requiring a separate storeroom platform.
Support can walk through the integration against whatever system currently tracks your parts transactions.
How long does it take to see meaningful KPI improvement after starting to track these metrics?
Visibility into the current state is typically immediate once transaction data is connected, but meaningful improvement in fill rate and carrying cost usually takes a full quarterly cycle as reorder points are recalculated and slow-moving stock is identified and addressed.
Book a demo to see how these KPIs would look calculated against your current inventory data.
Stop Managing the Storeroom by Feel
Turn Every Transaction Into a KPI You Can Actually Act On
iFactory calculates fill rate, stockout rate, turnover, and carrying cost automatically, by part and by criticality, so spare parts stop being a guess.