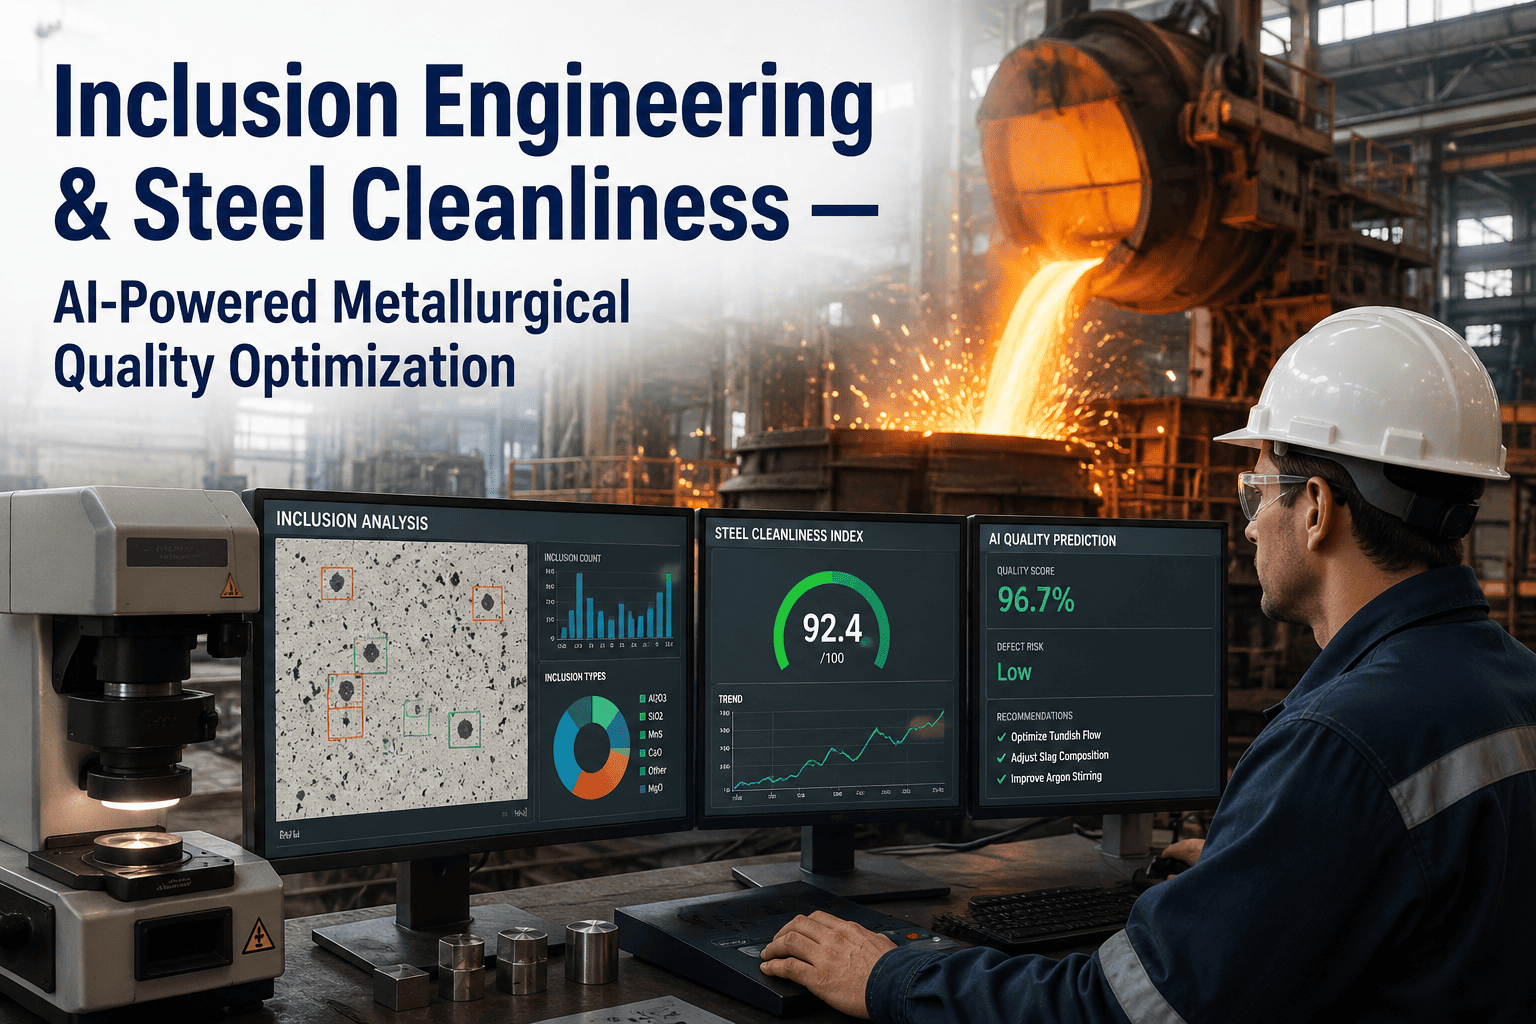
In the production of premium steel grades, the presence of non-metallic inclusions remains a critical determinant of material performance, fatigue life, and final product quality. Traditional manual inclusion rating methods, such as ASTM E45 or ISO 4967, are severely limited by human subjectivity, low throughput, and an inability to capture the full complexity of inclusion populations. At iFactory, we have engineered a next-generation automated inclusion analysis platform that integrates Scanning Electron Microscopy (SEM) and Optical Emission Spectroscopy (OED) with advanced artificial intelligence. This system delivers high-throughput, objective, and statistically robust cleanliness assessments by classifying inclusions by type, size, morphology, and probable origin. Our solution enables process engineers to implement real-time metallurgical adjustments, reduce defect rates, and achieve the stringent cleanliness specifications demanded by automotive, aerospace, and energy sectors. Book a Demo to explore how AI-driven inclusion analysis can transform your quality control workflow.
Achieve Unprecedented Steel Cleanliness with AI
Automate inclusion classification and drive process improvements.
Our platform delivers actionable insights in real time.
The Metallurgical Imperative for Automated Inclusion Analysis
Non-metallic inclusions, such as oxides, sulfides, and nitrides, act as stress concentrators that drastically reduce fatigue strength, ductility, and corrosion resistance. For high-performance applications like bearing steels, spring steels, and aerospace alloys, inclusion cleanliness is non-negotiable. Conventional manual methods rely on optical microscopy and operator judgment, leading to variability, missed small inclusions, and slow feedback loops. Automated SEM/OED analysis overcomes these limitations by scanning large areas, detecting inclusions down to sub-micron sizes, and applying consistent classification algorithms. This shift from qualitative to quantitative cleanliness assessment empowers metallurgists to link inclusion characteristics directly to upstream process parameters, such as deoxidation practice, slag chemistry, and casting conditions.
High-Throughput SEM Scanning
Our platform performs automated SEM scans over predefined areas (e.g., 100 mm² per sample) with backscattered electron detection, identifying all inclusions above a customizable threshold (typically 0.5 µm). The system generates high-resolution maps of inclusion distribution, enabling statistical analysis of population density, size distribution, and spatial clustering.
AI-Powered OED Elemental Analysis
Simultaneous OED measurements provide elemental composition for each detected inclusion. Machine learning models trained on thousands of known inclusion spectra classify each particle into categories such as Al₂O₃ clusters, MnS stringers, Ca-aluminates, or TiN cuboids. The AI continuously improves accuracy through active learning.
Real-Time Cleanliness Metrics
Key performance indicators like total oxygen content, inclusion area fraction, and Dmax (largest inclusion) are computed on the fly. Dashboards display trends over production campaigns, alerting engineers to deviations from target cleanliness levels before downstream processing.
From Manual Rating to AI-Driven Classification: A Paradigm Shift
Traditional inclusion rating methods like ASTM E45 (worst-field) and JK inclusion rating provide only semi-quantitative results, often missing fine inclusions that are most detrimental to fatigue life. In contrast, our automated system performs a full-field analysis, capturing every inclusion in the scanned area. The AI classification engine uses a multi-stage pipeline: first, segmentation via convolutional neural networks (CNNs) isolates inclusion boundaries; second, feature extraction quantifies size, aspect ratio, and morphology; third, a random forest classifier assigns inclusion type based on OED spectra. This approach achieves over 99% concordance with expert metallurgist reviews, while processing 100x more inclusions per sample. The result is a statistically robust cleanliness assessment that enables process engineers to pinpoint the root cause of inclusions—whether from deoxidation products, reoxidation, slag entrapment, or refractory erosion.
Sample Preparation & Loading
Metallographic samples are polished to a 1 µm finish and loaded into the SEM chamber. The system auto-calibrates beam current, working distance, and detector gain for optimal contrast.
Automated SEM Scan
A predefined grid pattern (e.g., 10x10 fields at 500x magnification) is scanned. Backscattered electron images are stitched into a mosaic, and inclusion candidates are identified by thresholding.
OED Spectrum Acquisition
For each inclusion candidate, an OED spectrum is acquired at a reduced spot size. The AI model classifies the spectrum in <50 ms, assigning a type and confidence score.
Data Aggregation & Reporting
Results are aggregated into a comprehensive cleanliness report, including inclusion type pie charts, size histograms, and trend graphs. Reports are exportable in PDF, CSV, or directly to MES.
Comparison: Manual vs. Automated Inclusion Analysis
| Parameter | Manual (ASTM E45) | Automated SEM/OED AI |
|---|---|---|
| Throughput | 2-3 samples per shift | 20+ samples per shift |
| Min detectable size | ~5 µm | 0.5 µm |
| Classification consistency | Operator-dependent | >99% repeatable |
| Elemental analysis | Not available | Full OED spectra |
| Statistical rigor | Worst-field only | Full-field population |
Ready to Transform Your Quality Control?
Deploy AI-driven inclusion analysis and achieve unmatched steel cleanliness.
Our experts are ready to guide you through implementation.
Case Study: Bearing Steel Cleanliness Improvement at a Major Mill
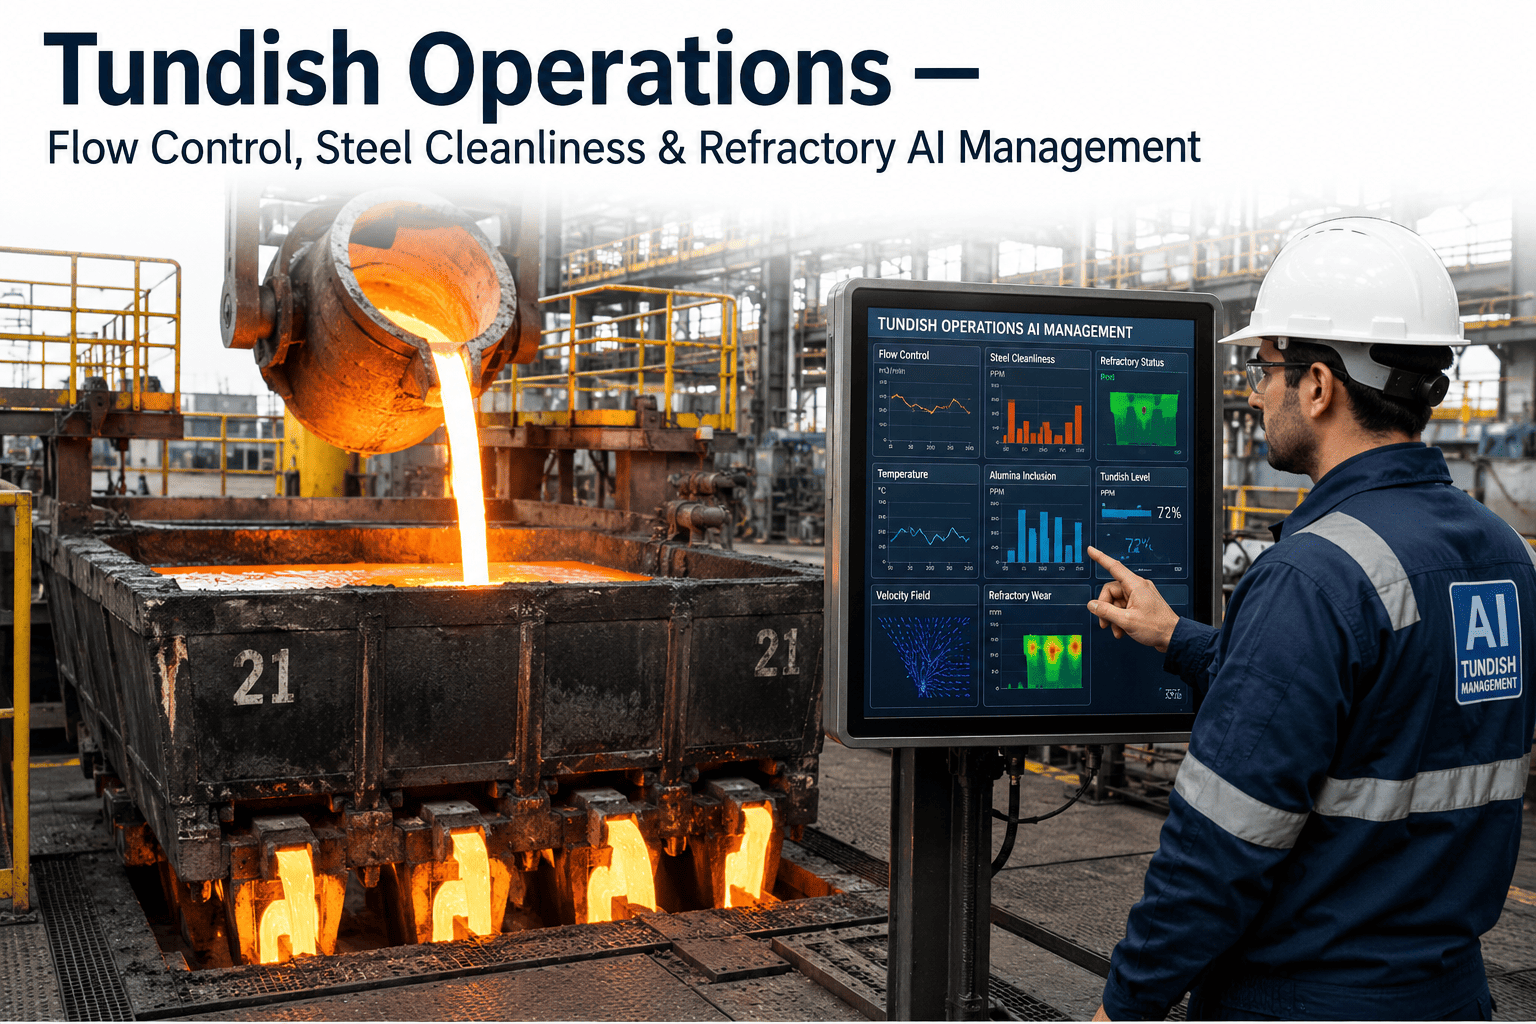
A leading European bearing steel producer was struggling with inconsistent cleanliness ratings across different shifts and operators. After implementing iFactory’s automated inclusion analysis, they achieved a 40% reduction in reject rate for 100Cr6 steel. The AI system identified that Al₂O₃ clusters from reoxidation during tundish filling were the dominant defect source. By adjusting the tundish argon purging protocol based on real-time inclusion data, the mill reduced total oxygen content from 12 ppm to 6 ppm within three months. The ROI was realized in under six months through reduced scrap, rework, and customer claims.
Inclusion Classification Taxonomy
Linking Inclusion Origins to Process Parameters
The true power of automated inclusion analysis lies in its ability to trace inclusion types back to specific process stages. For instance, large, irregular Al₂O₃ clusters often indicate reoxidation during casting, while fine, spherical Ca-aluminates suggest slag entrapment. Our AI system correlates inclusion characteristics with time-series data from the steelmaking process—such as ladle stirring intensity, tundish temperature, and mold level fluctuations—to generate actionable recommendations. Process engineers receive alerts when inclusion trends deviate from acceptable limits, enabling immediate corrective actions like adjusting deoxidation addition rates or modifying slag basicity. This closed-loop feedback system transforms quality control from a reactive inspection step to a proactive process optimization tool.
Frequently Asked Questions
How does automated inclusion analysis improve steel cleanliness?
Automated SEM/OED analysis provides objective, high-throughput detection and classification of non-metallic inclusions down to 0.5 µm, far beyond human capability. By identifying inclusion types and their probable origins, process engineers can implement targeted corrective actions, such as modifying deoxidation practice or slag chemistry, leading to significant reductions in total oxygen content and inclusion density. For more details on implementation, contact our support team.
What inclusion types can the AI classify?
The AI model is trained to classify over 20 inclusion types, including Al₂O₃, MnS, CaS, TiN, MgO·Al₂O₃ spinels, complex oxysulfides, and exogenous slag particles. The classification is based on a combination of morphology (size, aspect ratio, shape factor) and elemental composition from OED spectra. The system can be customized to recognize rare inclusion types specific to your steel grades. Book a Demo to see a live classification example.
How long does it take to analyze one sample?
A typical analysis of a 100 mm² sample at 500x magnification takes approximately 15 minutes, including SEM scanning, OED spectrum acquisition, and AI classification. This is a 10x improvement over manual methods, which can take 2–4 hours per sample for a comparable level of detail. The system can run unattended overnight, processing up to 20 samples per shift. Contact support for a throughput estimate tailored to your lab.
Can the system integrate with our existing MES or LIMS?
Yes, our platform provides RESTful APIs and standard data export formats (JSON, CSV, XML) for seamless integration with Manufacturing Execution Systems (MES) and Laboratory Information Management Systems (LIMS). We also offer OPC-UA connectivity for real-time data exchange with process control systems. Our engineering team can assist with custom integration. Book a Demo to discuss your integration requirements.
What is the ROI of implementing automated inclusion analysis?
Customers typically achieve ROI within 6–12 months through reduced scrap rates, lower rework costs, and decreased customer claims. For example, a bearing steel producer reduced reject rates by 40% and saved over €500,000 annually in material and processing costs. Additionally, the ability to provide statistically robust cleanliness certificates enhances customer trust and can command premium pricing. Contact our team for a personalized ROI calculation based on your production volume.
Start Your Cleanliness Transformation Today
Empower your metallurgy team with AI-driven inclusion analysis.
Achieve higher quality, lower costs, and faster certifications.