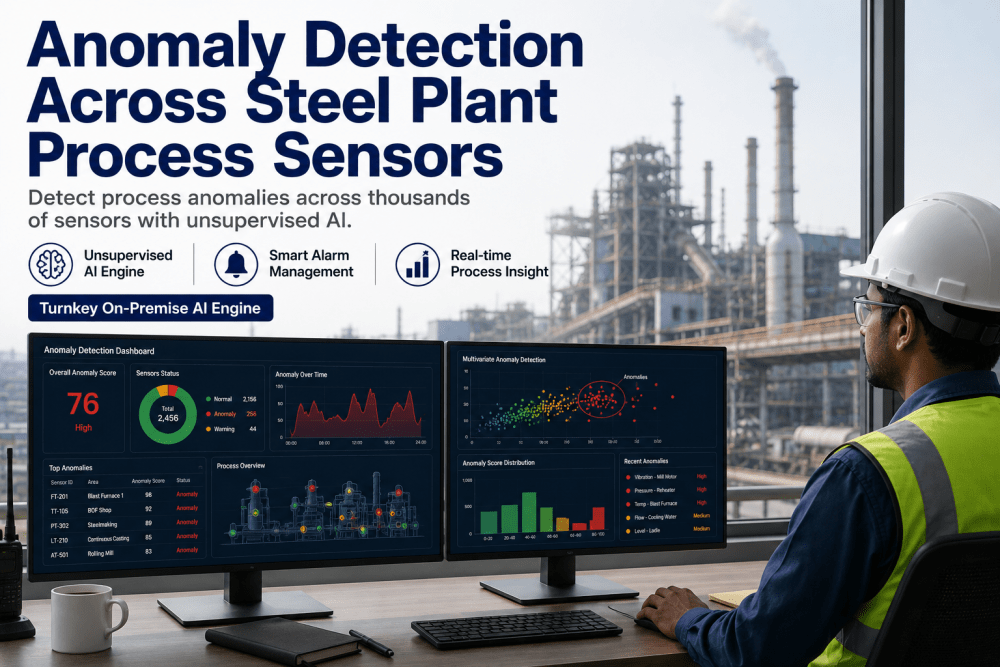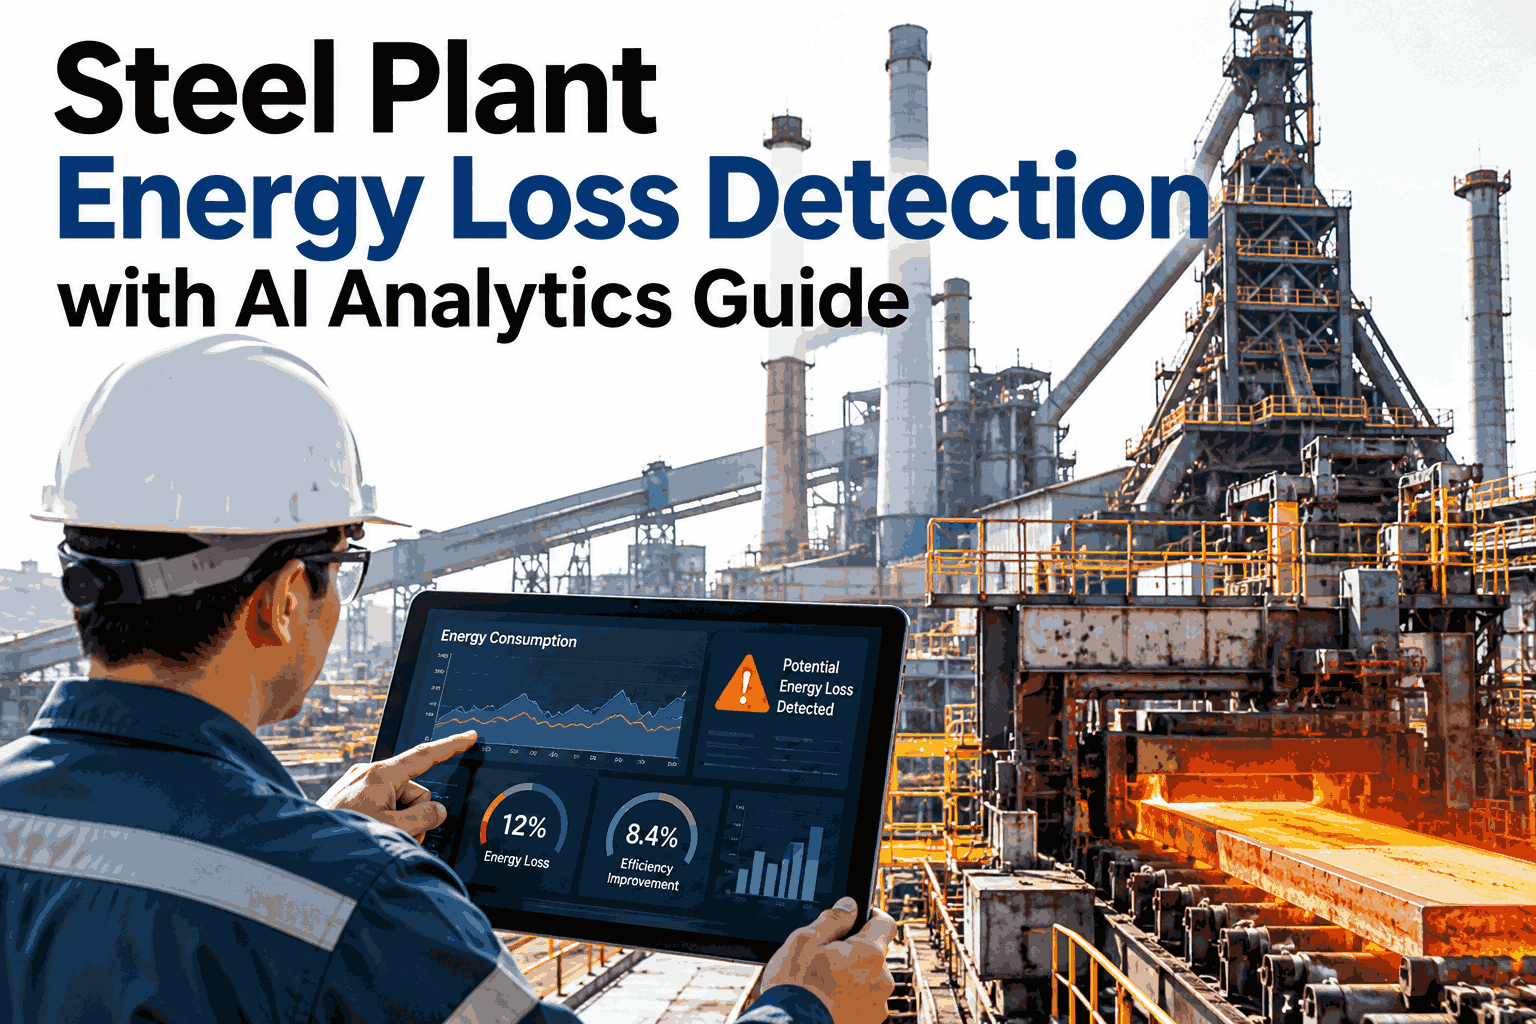
Most energy losses in a steel plant are not dramatic. A small air leak, a fan that fouls a little more each week or a furnace that idles a few minutes longer between heats will never trip an alarm, yet each one adds to kWh per tonne and GJ per tonne every day. Fixed thresholds and month-end reports catch these losses late, if they catch them at all, because the plant only sees the total. AI analytics learns what normal looks like for each unit, grade and load, and flags the departures while they are still small. Energy teams that want to see this on their own meters can watch an anomaly get flagged on real plant data in a short session.
Catch the Energy Leak While It Is Still a Small Drift
iFactory AI learns the kWh per tonne and GJ per tonne signature of every unit and flags departures the day they start, not when the month closes.
Four Kinds of Energy Loss AI Can Surface
Different losses leave different fingerprints. Recognising the four families makes it easier to trust an alert and to send it to the right owner.
Compressed Air, Steam and Water
Steady consumption that does not fall when output falls. The clue is base load rising slowly over weeks.
Running Without Producing
Furnaces, fans and motors left on between heats. The clue is night and gap-period draw that stays high.
Equipment Losing Efficiency
Fouled exchangers, worn drives, damaged insulation. The clue is intensity creeping up on the same grade and load.
Practice and Setting Changes
Longer holding time, over-blowing, changed set-points. The clue is a step change that lines up with a shift or a crew.
How the Detection Works
The method is simple to describe. Learn normal, compare live readings to it and flag what cannot be explained.
Why a Fixed Alarm Misses the Slow Loss
A fixed threshold is set high enough to avoid nuisance alarms, so slow losses slide underneath it. The columns show ten days of an illustrative creeping loss. A signature band catches it on day six, and you can walk through a creeping loss on your own meters to see the same effect.
See Which of Your Units Is Drifting Right Now
Book a 30-minute session and iFactory AI will show signature bands and live deviations for your own furnaces, mills and utilities.
Signal to Suspect Cause
Patterns in the deviation point to likely causes. The table is a starting guide for the first check.
| Pattern | Likely Cause | First Check |
|---|---|---|
| kWh per tonne high at night only | Idle running or base load | Motors, fans and furnaces between heats |
| Gradual rise over weeks, same grade | Fouling, wear or leakage | Heat exchangers, drives and air network |
| Sudden step change | Set-point or mode change | Recent settings, shift or crew changes |
| GJ per tonne high on one furnace | Burner tuning or heat loss | Air-fuel ratio, insulation and door seals |
| Intensity up while output is down | Base load spread over fewer tonnes | Schedule, delays and idle time |
From Raw Deviations to Real Alerts
Too many alerts destroy trust. The funnel shows how an illustrative hundred raw deviations shrink to the few that need action, and you can see the filtering steps in a live session.
Three Alert Levels, Three Responses
Not every alert deserves the same reaction. Clear levels keep the team calm and fast.
Small, short deviation
Logged and trended. Reviewed in the weekly meeting unless it repeats.
Persistent deviation
Assigned to an owner with a first check due within the shift or day.
Large or growing loss
Escalated at once with the heat list and suspected cause attached.
A Composite Scenario: Eight Weeks of Cumulative Loss
A fan started to foul and pulled a little more power each week. The columns compare cumulative wasted energy, in illustrative units, if the loss is found at month end versus in week two.
Where iFactory AI Fits
Meters, furnace data and production records live in separate systems. iFactory AI joins them and watches the signature of every unit.
Learned Signatures
Expected kWh and GJ per tonne is built by unit, grade, load and season.
Explained Deviations
Output, grade and outage effects are removed before an alert is raised.
Ranked Alerts
Losses are ranked by energy and cost, so the biggest gets attention first.
Closed-Loop Actions
Each alert carries an owner, a due date and a check on the result.
Frequently Asked Questions
How much data does the AI need before it can detect anomalies?
Useful signatures usually form after a few weeks of normal operation, and they improve as more grades, loads and seasons are seen. Units with steady production learn fastest. Historical data from MES and meters can shorten the wait considerably. Ask the team what your history can support before rollout starts.
Will it flood us with false alarms?
Not if the alerts are built on explained deviations. iFactory AI removes the effects of output, grade, planned outages and known maintenance before an alert is raised, and ranks what remains. Alert levels are tuned with your team during the pilot weeks, so the signal stays useful. Any alert that proves wrong feeds back into the signature and reduces repeats.
Does it work for both kWh per tonne and GJ per tonne?
Yes. Electricity and thermal energy each carry their own signature, and the same method applies to both. Furnaces, reheating lines and boilers are watched on GJ per tonne, while motors, fans and compressors are watched on kWh per tonne. See both signatures side by side in a live session using your own units.
Do we need extra sensors to start?
Usually not. Most plants already hold enough meter and process data to begin with the largest units. Where a large share of consumption cannot be explained, the analytics shows exactly where a sub-meter would help. That keeps spending focused on measurements that change a decision, not on blanket metering across the whole plant.
How are savings verified after a fix?
The signature is the reference. After a repair or a practice change, the same unit is compared against its own band, so a return to normal shows up directly in kWh or GJ per tonne. That keeps savings claims honest and separates real gains from output effects. Ask support how verification is reported to finance and leadership.
Stop Paying for Losses You Cannot See
iFactory AI watches the energy signature of every unit and flags departures the day they start. Book a walkthrough to see it on your own plant data.



.png)