Energy certifications promise recognition, but they ask for very different amounts of work. ISO 50001 certifies a management system, Superior Energy Performance adds verified savings on top of it, and ENERGY STAR scores a plant against its peers. A steel plant that picks one without understanding the others can spend a year on a certificate that customers, lenders or head office barely notice. The better approach is to compare the paths on effort and recognition, then build the data once and reuse it. Plants that want to see how their own energy data would stand up to these programmes can review a certification readiness check built on their own energy records in a short session.
Pick the Energy Certification Path Your Plant Can Actually Win
iFactory AI builds the baselines, performance indicators and verification evidence that ISO 50001, SEP 50001 and ENERGY STAR all ask for, from one set of plant data.
Three Paths, Side by Side
The three routes certify different things, and they are verified by different bodies. The table gives a starting comparison, and rules change, so always confirm current requirements with the programme administrator.
| Path | What It Certifies | Who Verifies | Core Requirement | Fits |
|---|---|---|---|---|
| ISO 50001 | An energy management system | Accredited certification body | Policy, review, baseline, targets, audits, review | Any steel plant |
| SEP 50001 | ISO 50001 plus verified energy savings | Accredited verification body | ISO 50001 conformance and verified improvement over a baseline | Plants with solid data and savings |
| ENERGY STAR plant certification | Energy performance against similar plants | Third-party verification of reported data | Score of 75 or higher on the plant's indicator | Integrated steel plants |
Effort Against Recognition
Effort and recognition do not rise together. The meters give an indicative view, based on typical experience rather than any official rating.
See Which Certification Your Data Is Already Ready For
Book a 30-minute session and iFactory AI will show baselines, indicators and evidence gaps for your plant against each path.
What ISO 50001 Asks For
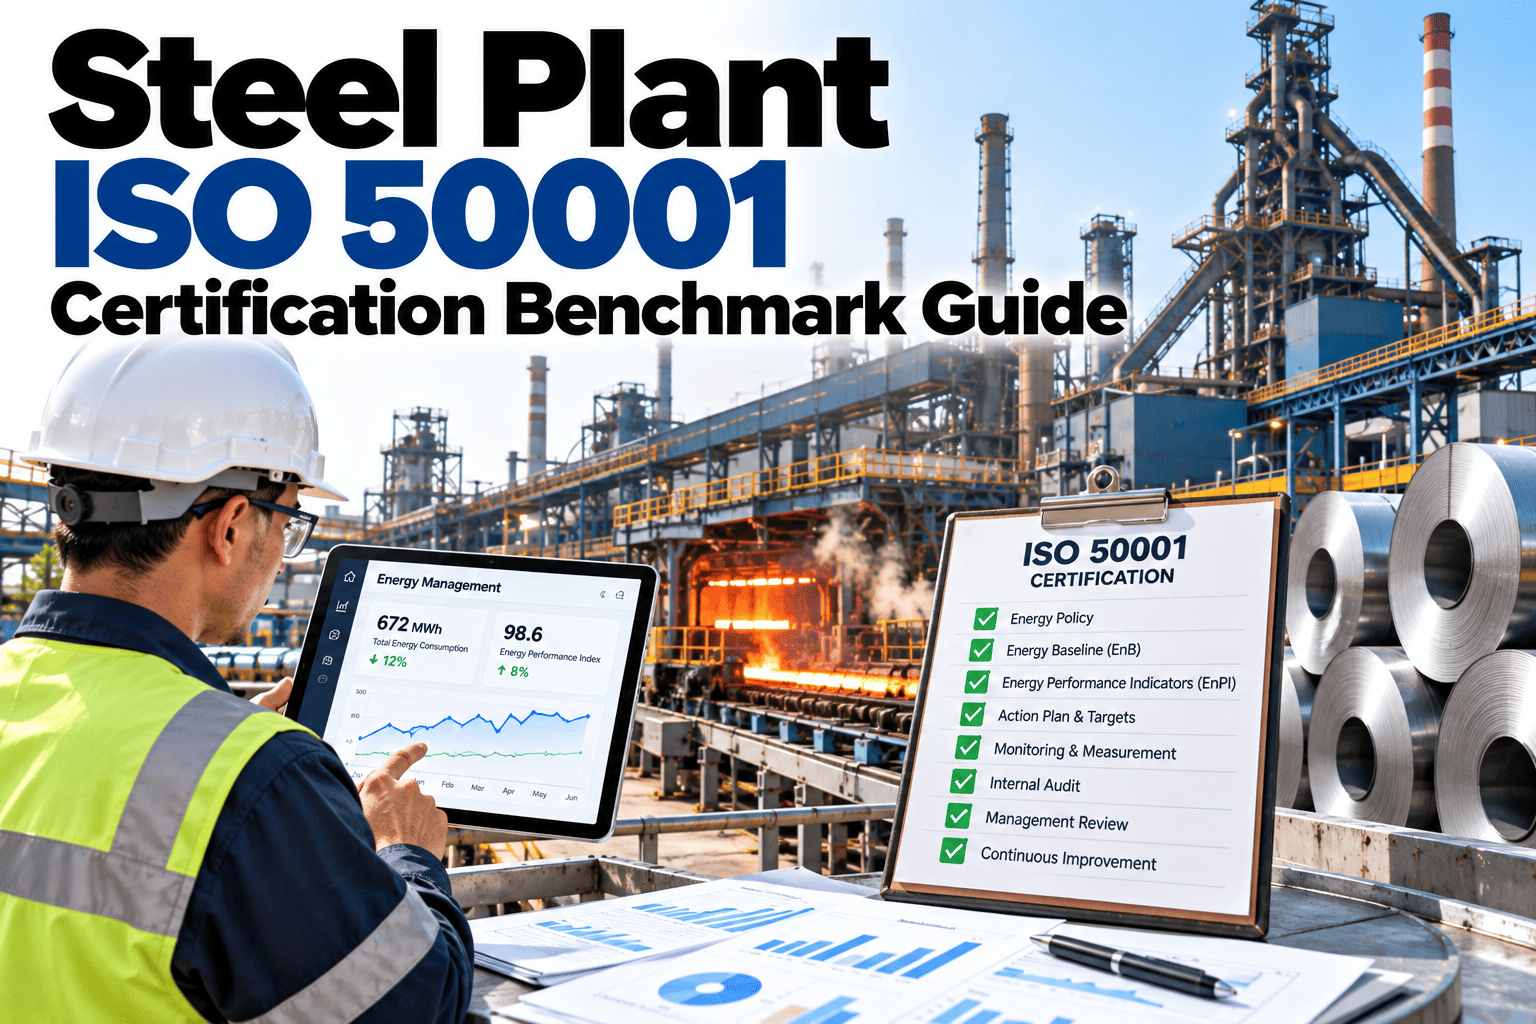
Every route starts here. The standard follows a plan, do, check, act cycle, and eight building blocks cover most of what an auditor will look at.
Energy Policy
A top-management commitment to improving energy performance.
Energy Review
Where energy goes, and which uses are significant.
Baseline and Indicators
A reference period and measures such as GJ per tonne.
Objectives and Plans
Targets with owners, actions and resources.
Operational Control
Criteria for running significant energy uses well.
Monitoring and Measurement
Data that proves performance, with a measurement plan.
Internal Audit
A planned check of the system before the external audit.
Management Review
Leadership reviews results and decides what comes next.
Performance Is Measured Against Expectation
An energy performance indicator is not just kWh or GJ. It compares actual energy with what the plant would be expected to use at that output and mix. The columns show an illustrative year, and teams can see expected and actual energy on their own plant data in a short session.
Reading an ENERGY STAR Score
The score runs from 1 to 100 and compares a plant with similar plants. A score of 75 or higher may make a plant eligible for certification. The gauge shows an illustrative plant just short of the line.
A Realistic Timeline
The paths overlap, so the data work is done once. The bars show an illustrative eighteen-month plan and not a promise, because timing depends on starting maturity.
A Composite Scenario: A Gap Analysis in One View
A plant mapped its current state against the eight ISO 50001 building blocks before committing to a path. The board uses illustrative results.
What Auditors and Verifiers Will Ask
Certification is mostly evidence. These questions come up in almost every audit.
Where iFactory AI Fits
iFactory AI does not certify a plant. Certification bodies and verifiers do that. It produces the data they ask to see.
Baselines and Indicators
GJ and kWh per tonne are built with normalisation for output and product mix.
Energy Review
Consumption is ranked by process step and use, to show what is significant.
Measurement Evidence
Data quality, meter coverage and gaps are tracked and documented.
Savings Verification
Improvements are tracked against expected energy, with the method recorded.
Frequently Asked Questions
Which certification should a steel plant start with?
For most plants, ISO 50001 is the foundation, because it builds the management system and the data that other programmes reuse. SEP 50001 follows when savings are verified, and ENERGY STAR can be pursued in parallel where an eligible indicator exists for the plant's route. iFactory AI's team can help you map the paths to your customers' expectations.
Does ENERGY STAR cover electric arc plants?
The ENERGY STAR steel indicator is published for integrated steel plants, so electric arc plants should check the current list of available indicators before planning around it. Rules and eligible sectors can change, so confirm with the programme administrator. ISO 50001 and SEP 50001 are not limited by plant route, which makes them the safer starting points for arc furnace operations.
How long does ISO 50001 certification take?
Many plants take roughly a year, depending on how mature their energy data and management practice already are. Plants with metered data, named owners and regular reviews move faster. The slowest steps are usually baselines and indicators, because they depend on clean data. See a baseline built from your own records in a short session to judge your starting point.
Can software do the certification for us?
No. Certification is granted by accredited bodies after an audit, and the management system itself needs leadership commitment, owners and routines. Software supplies the data, the normalisation and the evidence trail, and it keeps the system running between audits. Treat it as the engine room, not as the certificate, and plan time for people and process work alongside the data work.
How does this link to our GJ per tonne and kWh per tonne reporting?
Those figures become the core energy performance indicators, once they are normalised for output and mix. The same numbers serve internal reporting, certification evidence and customer questionnaires, so they only need to be built once. Ask support how indicators are defined and documented for each unit and for the whole plant.
Build the Energy Evidence Once and Use It for Every Certificate
iFactory AI produces baselines, indicators and verification evidence from your plant data. Book a walkthrough to see it against your own energy records.