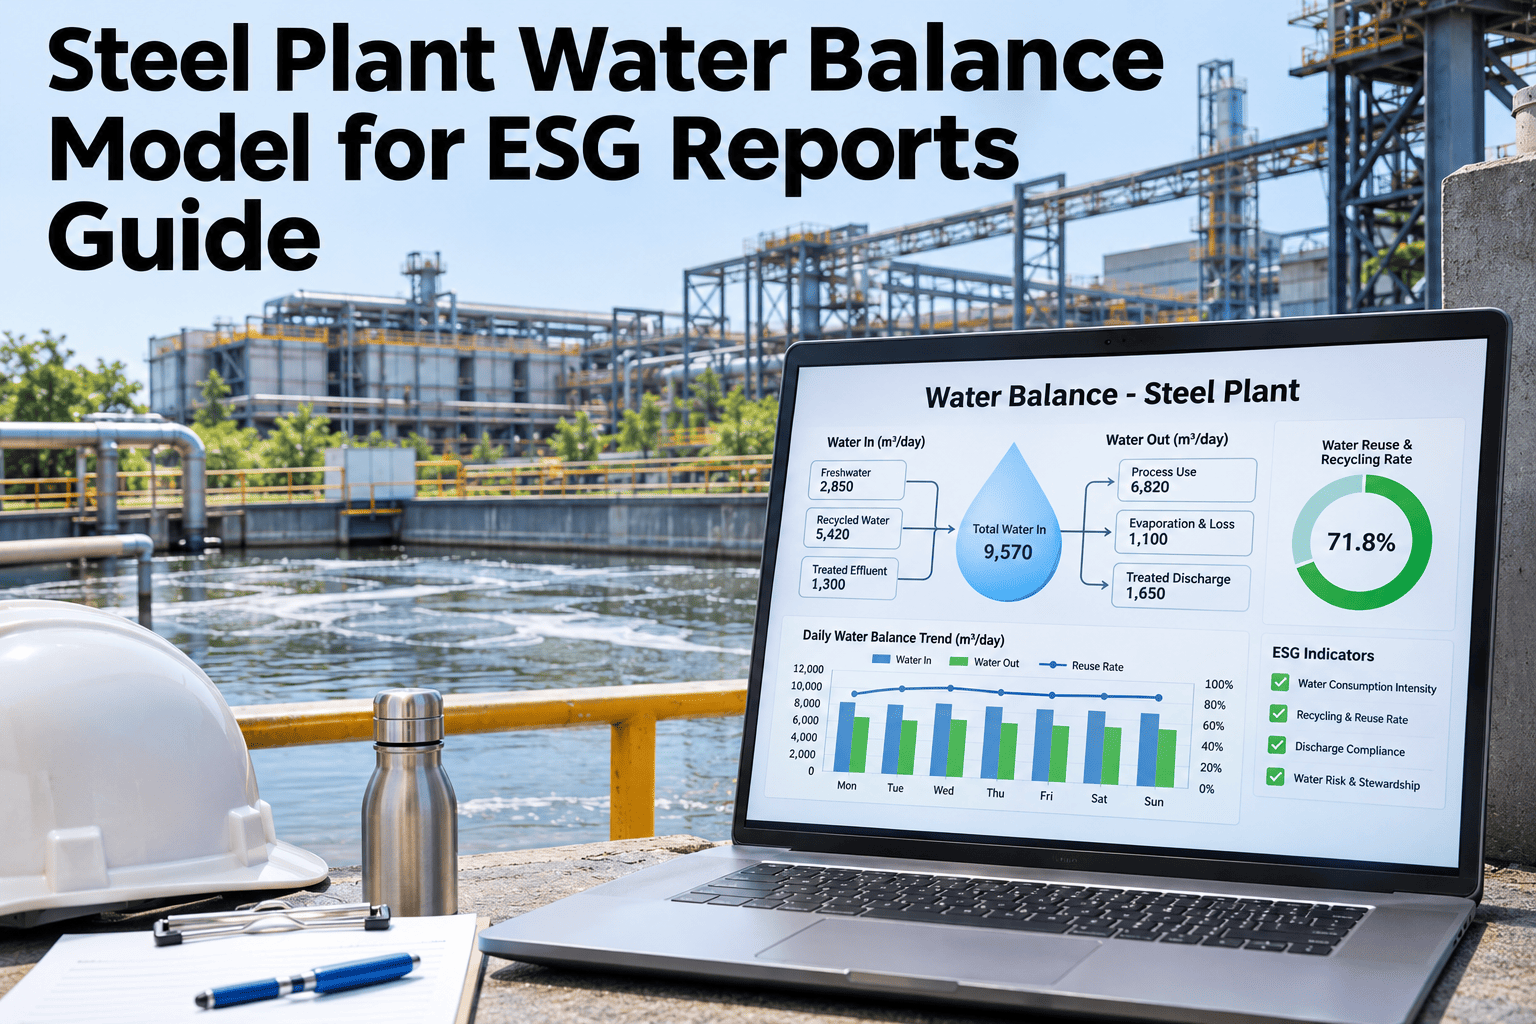
An integrated steel plant takes in roughly 28.6 cubic meters of water per tonne of steel, according to a worldsteel member survey, yet discharges about 25.3 cubic meters back out. The gap between those two numbers, not either number alone, is what actually describes water performance. A steel plant water balance model tracks intake, discharge and recycle volumes with product-level attribution, so ESG reports show water-per-tonne by product, not a single site-wide average. Sustainability and plant teams who want their own water balance modeled can review a water balance model for their plant with iFactory.
Intake and Discharge Tell Two Different Stories
iFactory, an on-premise AI platform for sustainability reporting, tracks intake, discharge and recycle volumes against production, with attribution down to the product level.
What a Water Balance Model Actually Tracks
A water balance model follows every cubic meter from the point it enters the plant to the point it leaves, is consumed, or is recirculated. Four terms define the whole picture.
Why ESG Reports Need This Level of Detail
A single blended water figure satisfies a basic disclosure checkbox, but increasingly investors and customers ask for the detail behind it. Product-level attribution is what turns a disclosure into something a buyer can actually act on.
Water Use vs Water Consumption
These two terms are often confused, and the difference matters for reporting. Use describes everything pumped in. Consumption describes only what never comes back out.
Integrated Route vs Electric Arc Furnace Route
Reported averages differ by production route, and an ESG report should reflect the route actually used, not a generic industry figure.
| Route | Avg Intake | Avg Discharge |
|---|---|---|
| Integrated (BF-BOF) | 28.6 m³/tonne | 25.3 m³/tonne |
| Electric arc furnace | 28.1 m³/tonne | 26.5 m³/tonne |
See Your Own Intake and Discharge Mapped
Share your current metering points, and iFactory will show where your water balance model has gaps.
Why a Fixed Benchmark Figure Can Mislead
Water usage objectives tied to a single blanket figure per tonne do not account for local water scarcity, plant configuration or legislation. Two plants with identical processes can report very different numbers for legitimate reasons.
Where Water Actually Goes in the Plant
A steel plant is not one water stream, it is a collection of separate circuits, each with its own contamination profile and treatment need.
Why Product-Level Attribution Matters
A single site-wide water-per-tonne number hides which products actually drive water use. Different grades and routes through the plant carry very different water intensity.
| Reporting Level | What It Shows | Limitation |
|---|---|---|
| Site-wide average | One number for the whole plant | Hides which product drives the figure |
| Product-level attribution | Water-per-tonne by product or grade | Needs metering mapped to production routing |
Recycling Rate: The Lever That Actually Moves the Number
Intake volume alone is a weak performance signal, since most of it is reused rather than lost. The recycling rate across circuits is what actually separates a well-run water system from a wasteful one.
| Circuit Type | Typical Recycle Potential |
|---|---|
| Cooling circuits | High, closed-loop recirculation is standard |
| Descaling and scrubbing | Moderate, depends on contamination load |
| Process contact water | Lower, needs treatment before reuse |
Building the Model for ESG Reporting
A model built for internal use and one built for external ESG disclosure need the same underlying data, but different rigor around traceability.
A Composite Scenario: Finding the Real Driver
A mill reported one blended water-per-tonne figure for years. A product-level model showed one specialty grade, a small share of total tonnage, was driving a disproportionate share of intake.
The blended site average had masked this entirely, since the other products diluted the number back toward normal. Once isolated, the circuit became the target for a focused recycling upgrade rather than a plant-wide initiative.
Common Mistakes in Water Reporting
Most water disclosure gaps trace back to a small number of recurring issues, not a single catastrophic failure. Each one has a straightforward fix once identified.
| Mistake | Fix |
|---|---|
| Reporting use instead of consumption | Report both, clearly labeled, since they answer different questions |
| One site-wide average | Break out figures by product where the data supports it |
| No reconciliation between circuits | Check intake, consumption and discharge against each other |
Where iFactory AI Fits
iFactory ties intake, discharge and recycle meter data to production records, so a water-per-tonne figure can be reported by product, not only by site.
Continuous Reconciliation
Intake, consumption and discharge are checked against each other automatically.
Product-Level Attribution
Water use is mapped to the specific grade or product running.
Audit-Ready Records
Reported figures keep their underlying meter trail for review.
What a Rollout Looks Like
Deployment typically starts with an audit of existing metering, not new infrastructure everywhere at once. Gaps are closed where they actually affect the figures being reported.
Frequently Asked Questions
What is the difference between water use and water consumption?
Water use is total intake, while consumption is intake minus discharge, the share of water that never returns to the source at all. Review both figures for your plant.
Why do intake figures vary so widely between plants?
Local water availability, plant configuration and legislation all shape how much a specific plant reports, which is why comparing raw intake figures across plants is rarely fair. Ask support about benchmarking fairly.
Do we need new meters to build a water balance model?
Many plants already have usable flow data; gaps are usually at specific circuit boundaries rather than across the whole system, so a first audit is often quick. Map your current metering gaps with us.
How does product-level attribution actually work?
Meter data is tied to production routing, so water use follows the specific grade or product running through that circuit at any given time. See attribution modeled on your products.
Can this feed directly into our ESG report?
Yes, reconciled water-per-tonne figures with their meter trail can be exported in the format your disclosure reporting process already expects. Ask how reports are exported from the platform.
Report Water-Per-Tonne by Product, Not Just by Site
Book a session with iFactory and see your intake, discharge and recycle data modeled with product-level attribution.