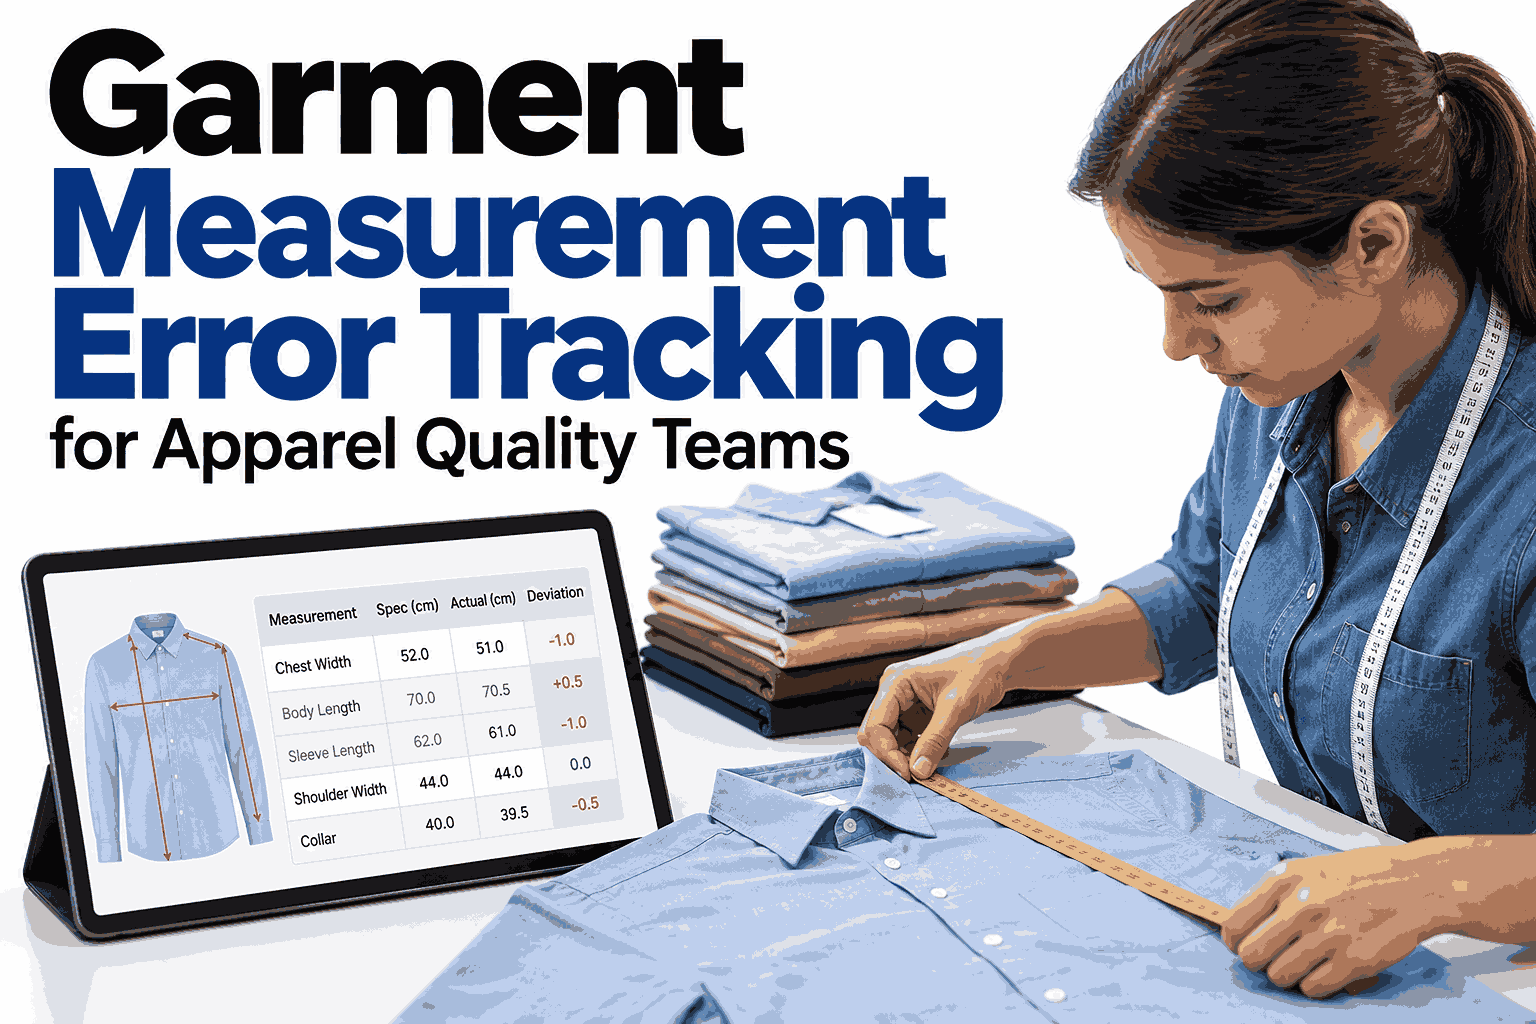
Apparel quality teams spend hours each day measuring collars, chests, waists and sleeves against a buyer's spec sheet, comparing every panel by hand with a measuring tape. A garment that is half an inch out on the chest can still pass a quick visual check, yet fail a customer's own audit weeks later and trigger a full rejection. Measurement error rarely shows up as one dramatic mistake; it accumulates quietly across operators, machines and shifts until a shipment is held at the buyer's warehouse. Tracking every point of measurement against tolerance, order by order, turns that quiet drift into a number the team can actually manage. Quality leads weighing this shift can see how iFactory AI tracks POM data against tolerance in real time before changing how final inspection runs.
Garment Measurement Error Tracking for Apparel Quality Teams
Compare every point of measurement against spec, tolerance by tolerance, and catch drift before a shipment is held.
Where Measurement Errors Creep In
Most measurement error is not one bad cut. It builds up across three stages that rarely get checked against each other.
Pattern drift and fabric shrinkage shift panel size before a single stitch is sewn.
Seam allowance variation between operators changes the finished measurement at every seam.
Pressing and washing can pull a garment outside tolerance even when sewing was correct.
A single end-of-line check rarely shows which of the three stages caused the miss, so the same error repeats on the next lot.
The Points of Measurement That Matter Most
Buyers rarely check every seam. Most spec sheets concentrate tolerance checks on a handful of points that decide fit.
See Your Own Spec Sheet Tracked Live
Book a 30-minute session and bring a style's POM sheet. iFactory AI will show measurement tracking against your own tolerance chart.
Reading a Tolerance Band at a Glance
Every point of measurement has an accepted range around the target. The dashboard marks exactly where each reading falls inside that range.
A reading outside the marked zone is flagged the moment it is recorded, instead of being caught at a random end-of-line sample.
How AI Measurement Tracking Works
The workflow adds a measurement check at each stage instead of waiting for one inspection at the very end of the line.
Manual Measuring vs AI-Assisted Tracking
Use this comparison when deciding whether to add digital measurement tracking to an existing line. Any finalist is worth a live walkthrough on your own spec sheet.
| Factor | Manual Measuring | AI-Assisted Tracking |
|---|---|---|
| Sample size | A handful of pieces per lot | Every checked piece logged by point |
| Stage coverage | Usually end-of-line only | Cutting, sewing and finishing stages |
| Record keeping | Paper tally sheets | Digital record tied to style and operator |
| Root cause | Hard to isolate which stage failed | Stage-level data points to the cause |
| Buyer audits | Rebuilt from memory and samples | Full POM history exported on request |
Inside the Measurement Tracking Dashboard
The dashboard brings measurement data, tolerance charts and operator records into one screen for the quality team.
Live Tolerance Flags
Readings outside the accepted range are flagged the moment they are logged, not at a weekly review.
Style and Operator Trends
Error rates are tracked by style, size and operator to find where drift keeps repeating.
Full POM History
Every measurement is stored against the lot and order, ready to export for a buyer audit.
Plain-Language Queries
Supervisors can ask which size ran out of tolerance most this month and get a ranked answer.
iFactory AI ships on a pre-configured NVIDIA server, racked and ready with software pre-loaded. Scope covers measurement station setup, spec sheet mapping, team training and 24x7 remote monitoring.
Frequently Asked Questions
Does this replace the measuring tape on the floor?
No, operators and checkers still take measurements at their stations. The system captures each reading digitally and compares it to the tolerance chart instantly, instead of someone writing it on a tally sheet and checking it later. This keeps the existing checking process intact while adding a live record on top of it. You can see a measurement station set up in a live session.
Can tolerance charts differ by buyer and style?
Yes, each buyer and style combination can carry its own tolerance chart, since one buyer's accepted range for sleeve length may differ from another's. The dashboard applies the correct chart automatically based on the order being checked. Mills running several buyers on the same line benefit most from this setup. Ask support about mapping multiple buyer specs during onboarding.
How does this help reduce shipment rejections?
Because measurements are checked at cutting, sewing and finishing instead of only at the end, a drift is caught and corrected before it reaches every piece in the lot. Fewer out-of-tolerance pieces reach final audit, and fewer shipments get held or returned. The full POM record also gives the team evidence if a buyer disputes a measurement. See the rejection trend view in a guided walkthrough.
Can we trace an error back to a specific operator or machine?
Measurement records are tied to the station, operator and lot where they were taken, so a repeating error can be traced back instead of being treated as random variation. This makes retraining or machine checks targeted rather than floor-wide. Supervisors can pull this view by style or by date range. Contact support to see how trace-back is set up for your floor.
How long does it take to roll out across multiple lines?
A single line is typically live within six to nine weeks, and additional lines are faster once spec sheets and tolerance charts are already mapped in the system. The main variable is how many distinct buyer and style combinations need their own tolerance setup. Teams usually start with their highest-rejection style and expand from there. Book a rollout planning session to map your own timeline.
Catch Measurement Drift Before It Reaches Shipment
iFactory AI tracks every point of measurement against tolerance, stage by stage. Book a walkthrough to see it on your own spec sheet.