Most textile plants report a quality number that looks fine and a cost sheet that does not agree with it. The gap is rarely dishonesty. It is almost always a definition problem: the quality rate counts a piece as good once it eventually passes, after rework, after re-cutting, after a second trip through finishing. First-pass yield counts a piece as good only if it passed the first time, which is a stricter and more honest number. Book a demo to see what your line's true first-pass number looks like once rework stops being counted as a pass.
The Yield Number You Report Is Not the Yield Number You Have
First-pass yield counts a piece as good only once, the first time through. iFactory AI measures that number at every station and shows exactly where the gap between reported and real yield is hiding.
Why Two Honest-Looking Numbers Can Disagree
A plant can run a quality dashboard showing 96-97% pass rate and still be losing a meaningful share of output to rework, without either number being wrong. They are simply measuring different things.
Overall quality rate usually counts a piece as good the moment it clears final inspection, however many times it had to be touched to get there. First-pass yield counts a piece as good only if it cleared every station correctly the first time, with no rework and no re-cut. The difference between those two counts is the rework hiding inside a healthy-looking dashboard, invisible until someone measures it on purpose.
The gap between the two numbers is not evenly distributed across a plant, either. A line running a stable, well-understood product tends to have a narrower gap, because its rework is mostly routine and predictable. A line running a new style, a new fabric, or a new operator mix tends to have a much wider gap, because the rework driving it is less visible and less routine. Reporting one blended plant-wide quality number hides that difference entirely, which is exactly why a first-pass yield view needs to exist at the line level, not just the plant level.
How First-Pass Yield Actually Compounds
A textile garment usually passes through several stations before it ships: cutting, sewing, finishing, pressing, and final inspection. Each one has its own pass rate, and those rates multiply rather than average.
Cutting Station
Panel accuracy and fabric flaw screening set the ceiling for every station downstream, since a cutting error travels forward and often surfaces only later.
Sewing Line
Stitch quality, seam strength, and tension consistency are usually the single largest source of first-pass loss on a garment line.
Finishing and Pressing
Pressing marks, trim placement, and label alignment introduce a separate, late-stage failure category that cutting and sewing checks never see.
Final Inspection
The last gate before shipment, and the stage where every upstream miss that survived finally gets caught, or doesn't.
Five stations each running a respectable 97% first-time pass rate do not combine into 97% overall. They combine into roughly 86%, because each station's loss multiplies against what the previous station already passed through. That compounding effect is the single most common reason a plant's true yield sits well below what any one station's own number would suggest.
The practical consequence shows up in where effort gets spent. A plant that only watches its final-inspection pass rate tends to invest in catching more at the end of the line, which is the most expensive place to catch anything. A plant that watches rolled yield across stations can see which individual station is actually dragging the overall number down, and put the improvement effort there instead, where a fix is both cheaper and catches the problem before it consumes any more downstream capacity. Book a demo to see which of your own stations is carrying the most weight in that compounding effect.
See Your Real Rolled Yield, Station by Station
Book a 30-minute session and see how your stations' individual pass rates compound into your true first-pass yield.
What the Cost of Poor Quality Actually Includes
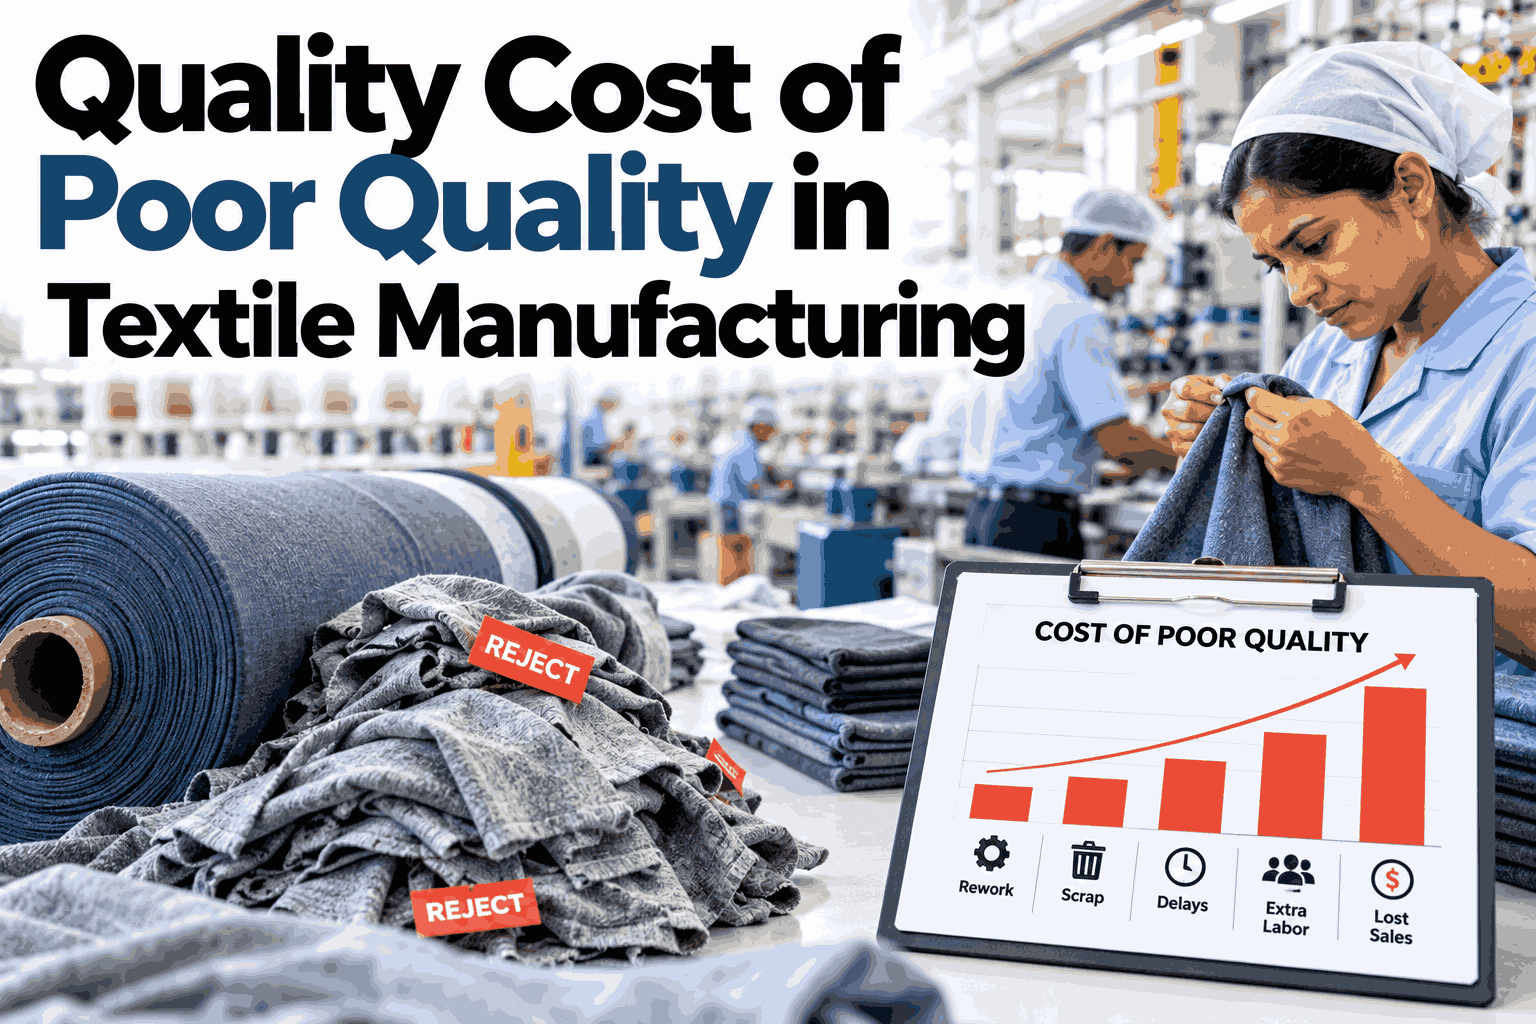
Rework and rejection costs rarely sit in one place on a plant's books, which is a big part of why the true cost of a yield problem is usually underestimated rather than overstated.
| Cost Category | What It Actually Captures | Where It Usually Hides |
|---|---|---|
| Repair labor | Time to remove and redo defective stitching or seams | Buried in general sewing-line labor hours, not tracked separately |
| Rejection cost | Pieces scrapped outright, valued at their shipment price | Recorded as scrap weight, rarely converted back to lost revenue |
| Excess material | Fabric consumed by re-cutting a panel that failed the first cut | Rolled into overall fabric consumption, not flagged as rework-driven |
| Appraisal cost | The quality team's own time spent catching the defects above | Treated as fixed headcount cost, not linked back to the defect volume driving it |
One worked method for pulling these together: repair labor is defects per day multiplied by the time to remove and re-stitch, divided into a standard workday to get labor-days consumed; rejection cost is rejected pieces multiplied by shipment value; appraisal cost is the quality team's salary load. Add those three categories plus excess-manpower cost, divide by monthly shipment value, and the result is a cost-of-poor-quality percentage that is comparable month over month, which a stitched-together set of separate line items on a general ledger usually is not.
The resulting percentage is less important as an absolute number than as a trend. A plant running this calculation for the first time often finds a figure that feels uncomfortably high, simply because nobody had previously added repair labor, rejection, excess material, and appraisal cost into one line. That first number is a baseline, not a verdict, and the real value shows up a few months later when the same calculation, run the same way, shows whether the trend is moving in the right direction.
Repeat Defects: The Pattern That Separates a Bad Day From a Bad Process
Not every defect carries the same signal. A one-off flaw on an isolated piece is usually noise. The same defect recurring on the same station, the same operator, or the same fabric batch is a process problem wearing a defect's disguise.
Same Station, Repeating
A defect type clustering at one machine points at a mechanical or setup issue specific to that station, not a general skill gap.
Same Operator, Repeating
A defect pattern tied to one operator across shifts points at a training gap or a fatigue-related drift worth addressing directly.
Same Fabric Batch, Repeating
A defect pattern tied to a specific fabric lot points upstream, toward a supplier or batch issue rather than anything happening on the floor.
Telling these three patterns apart requires tracking defects with enough context to see the pattern, not just a daily defect count. A number without that context tells you how much rework happened. A number tied to station, operator, and batch tells you why.
There is also a timing dimension worth watching alongside these three. A repeat defect that appears consistently throughout a shift behaves differently from one that clusters near the start or end of a shift, and differently again from one that spikes right after a changeover. Each of those timing patterns points toward a different likely cause, from warm-up drift on a machine to fatigue late in a shift to a setup error after a changeover, and distinguishing them usually only takes adding a timestamp to the same defect record already being captured. Book a demo to see how timing context changes what a repeat-defect pattern is actually telling you.
Building a Yield Dashboard That Shows the Real Number
A yield dashboard earns its name only if it reports first-pass yield as its own tracked number, not a derivative of a final-inspection pass rate that already absorbed every rework cycle along the way.
Capture at Each Station
A piece's pass or fail status is recorded the first time it reaches a station, before any rework touches it, so the first-pass count stays clean.
Tag the Defect, Not Just the Fail
Every failure carries a defect category, station, operator, and batch, so the dashboard can show patterns, not only totals.
Roll It Up Honestly
Station-level first-pass rates multiply into a true rolled yield, displayed separately from the final-inspection pass rate it is often confused with.
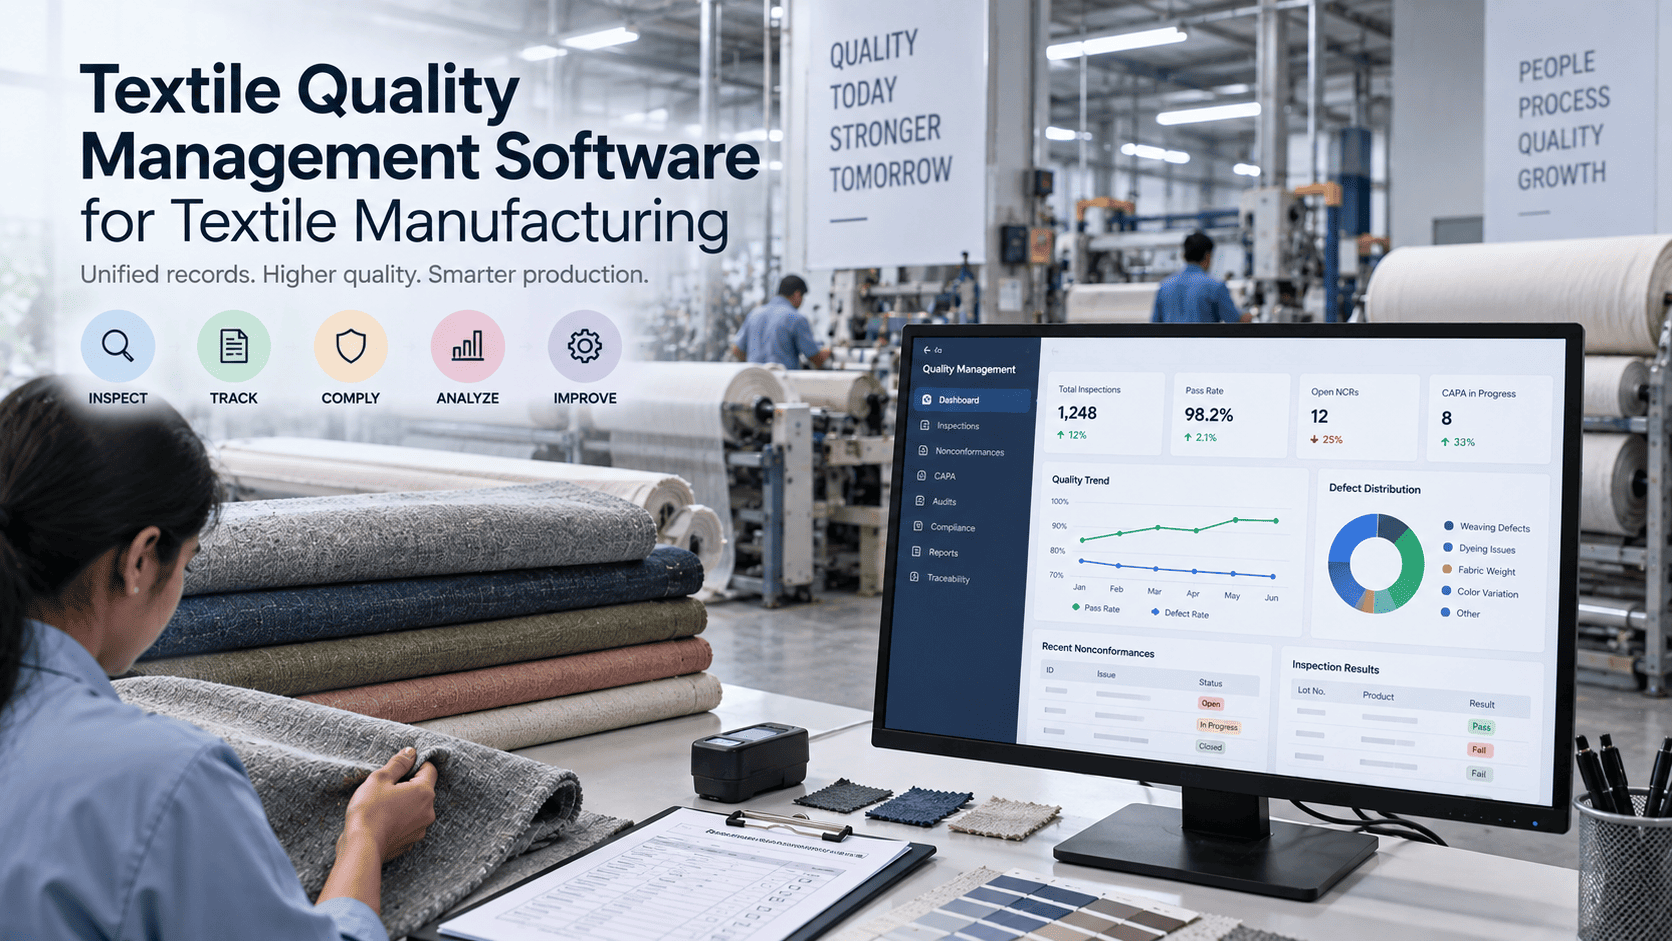
The payoff of building the dashboard this way is that a quality lead can look at one screen and see both numbers at once: what final inspection says shipped, and what actually passed clean the first time. The gap between them is the rework program's real target, and it stays invisible until the dashboard is built to show it on purpose.
A dashboard built this way also changes the conversation in a daily production review. Instead of a single quality percentage that either looks fine or triggers a vague concern, a team can point at a specific station, a specific defect category, and a specific trend line, and decide on a specific action in the same meeting. That shift, from a general impression to a specific, actionable number, is usually the actual value a yield program delivers, well before any particular improvement project pays for itself.
It is worth being specific about what this dashboard is not. It is not a replacement for the final-inspection pass rate a plant already reports to customers or to its own leadership, and it is not meant to introduce a second, competing version of quality truth. It sits alongside the existing number as the diagnostic layer underneath it, answering the question final inspection was never built to answer on its own: not just whether the shipment was good, but how much work it actually took to get there, and which station spent most of that work.
A Short Self-Check Before Your Next Review
Run these against your current reporting. A no on any of these points at where the real yield number is probably hiding.
Where iFactory AI Fits
iFactory AI captures first-pass results at each station automatically, tags every defect with the context needed to see a pattern, and rolls the numbers up into one honest yield dashboard.
Station-Level First-Pass Capture
Every piece's pass or fail status is recorded the first time it reaches a station, before rework can quietly absorb the miss.
Context-Tagged Defects
Each defect carries station, operator, and batch data automatically, so repeat patterns surface without manual cross-referencing.
Rolled Yield Reporting
Station pass rates compound into a true rolled first-pass yield, shown alongside final-inspection pass rate rather than hidden behind it.
Cost-of-Poor-Quality Rollup
Rework labor, rejection cost, and excess material are combined into one tracked figure, comparable month over month.
Expert Review
"The number that actually matters is rolled throughput yield, not the single pass rate at final inspection. A plant running five stations at a respectable 97% each is shipping at roughly 86% true first-pass performance, and almost nobody notices until they measure it station by station instead of trusting the number at the end of the line."
This review point is worth sitting with before moving to implementation: a yield improvement program built around the final pass rate alone is optimizing the wrong number. The station-level view is what actually changes where effort goes, and it is the view most plants are not currently measuring. Book a demo to see that station-level view built from your own floor data.
A second point worth carrying from the same review: cost of poor quality and first-pass yield should be read together, not separately. A rising first-pass yield number with a flat cost-of-poor-quality figure usually means the improvement is real but the accounting hasn't caught up yet, which is common in the first month or two after a change. A flat first-pass yield number alongside a falling cost figure is the more suspicious pattern, since it can mean a cost category was moved off the books rather than actually reduced. Reading the two together, on the same cadence, catches that kind of accounting drift before it becomes a reporting problem of its own.
Frequently Asked Questions
What is the actual difference between quality rate and first-pass yield?
Quality rate, as most dashboards report it, counts a piece as good once it eventually passes inspection, however many rework cycles it took to get there. First-pass yield counts a piece as good only if it passed cleanly the first time, with no rework and no re-cut. The gap between the two numbers is the rework a standard quality dashboard quietly hides.
Why does rolled yield across stations come out lower than any single station's own pass rate?
Each station's pass rate multiplies against what the previous station already passed through, rather than averaging with it. Five stations at 97% each compound to roughly 86% overall, which is why a plant can see "good" numbers at every individual station and still have a true first-pass yield well below what any one of those numbers suggests. Book a demo to see your own stations rolled up this way.
How is cost of poor quality actually calculated for a textile line?
A common method adds repair labor cost, rejection cost valued at shipment price, excess-material cost from re-cutting, and the quality team's own appraisal cost, then divides the total by monthly shipment value to get a comparable percentage. The figure is plant-specific; treat any published benchmark percentage as illustrative rather than a target to match exactly.
How do we tell a one-off defect from a real repeat-defect pattern?
A single flaw on an isolated piece is usually noise. The same defect type clustering on one station, one operator, or one fabric batch across multiple pieces is a pattern worth investigating, because each of those three clusters points at a different root cause and a different fix.
What data do we need before building a real first-pass yield dashboard?
The core requirement is capturing each piece's pass or fail status at each station before any rework happens, tagged with enough context (station, operator, batch) to see a pattern rather than just a count. Most lines already generate this data in some form; the early phase of a rollout focuses on capturing it consistently rather than building new inspection steps from scratch.
See Your True First-Pass Yield, Station by Station
iFactory AI captures first-pass results, tags repeat-defect patterns, and reports the rolled yield number your final-inspection rate has been hiding. Book a walkthrough on your own floor data.