Ask a maintenance manager how the department performed last quarter, and the honest answer is often a shrug followed by a guess. Without a working KPI dashboard, "better" or "worse" is a feeling, not a number, and feelings don't survive a budget review. A textile plant tracking MTTR, MTBF, and PM compliance in one place turns maintenance from a cost center nobody can defend into a function with numbers that hold up under scrutiny, and that shift starts with picking the right handful of metrics rather than drowning in every number a CMMS can produce.
The Four Numbers That Actually Tell You How Maintenance Is Doing
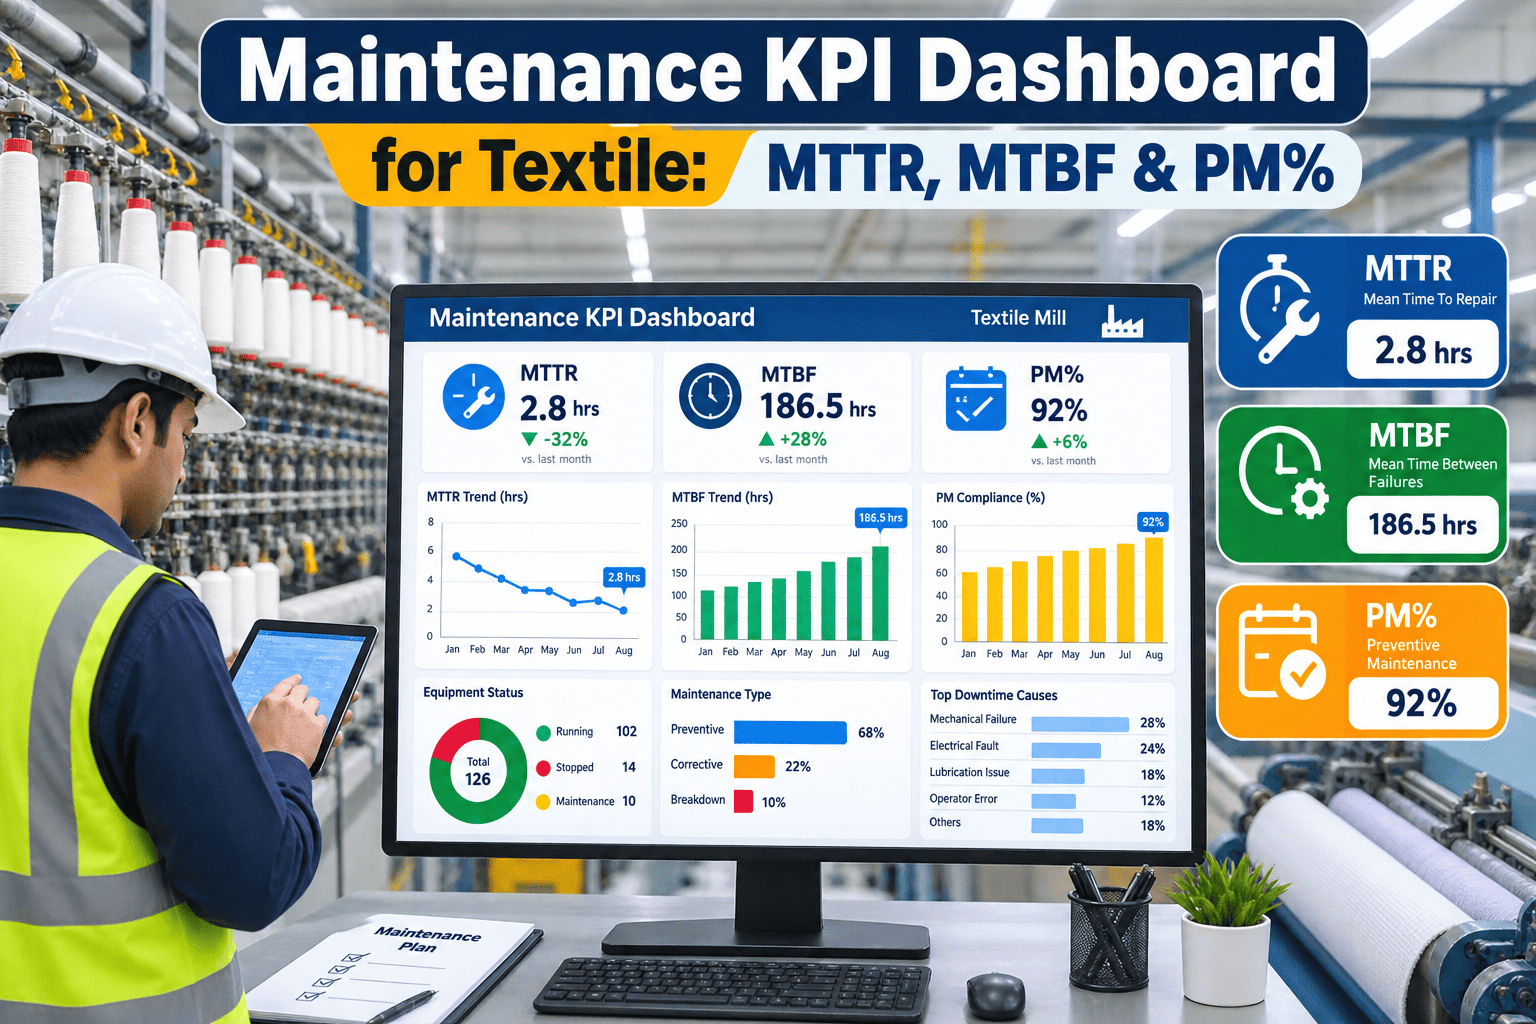
A maintenance KPI dashboard consolidates equipment reliability, repair speed, planned work compliance, and cost per unit into a single live view — replacing month-end spreadsheet reconstruction with numbers a manager can check the moment a decision needs one.
Four Metric Tiles Every Textile Maintenance Dashboard Needs
Placement on the dashboard matters more than most plants realize during initial setup. A tile that leads with a raw number and no context invites misreading — a 90% PM compliance figure looks strong until it's placed next to a rising emergency work order percentage, which together tell a very different story than either number alone. Grouping related metrics visually, so a manager sees repair speed next to reliability next to planned-work discipline in the same glance, prevents the common trap of celebrating one improving number while a related one quietly deteriorates in a tab nobody opened that week.
How Each Formula Is Actually Calculated
These four numbers only mean something if they're calculated consistently across shifts and machines, which is where most spreadsheet-based tracking quietly breaks down — one supervisor counts a stoppage from the failure report time, another from when a technician physically arrives, and the resulting "MTTR" numbers aren't measuring the same thing at all. A dashboard that pulls timestamps automatically from work order events removes that inconsistency entirely.
This consistency problem compounds quickly once a plant tries to compare performance across shifts or across sister facilities. If the day shift logs a failure the moment an operator notices reduced output, while the night shift only logs it once the machine has stopped completely, the two shifts will show meaningfully different MTTR numbers even if their actual repair performance is identical. The fix isn't a stricter policy memo — it's removing the judgment call entirely by tying every timestamp to a system event: the failure alert firing, the work order being opened, the technician clocking in on the task, and the machine's production sensor confirming a restart. Once the definition lives in the data pipeline rather than in each supervisor's head, cross-shift and cross-plant comparisons finally mean something.
MTTR
Total repair time ÷ number of repair events
Measured from the moment a failure is logged to the moment the asset resumes production, including diagnosis, parts retrieval, and the repair itself.
MTBF
Total operating time ÷ number of failures
Calculated over a defined period, counting only unplanned failures and excluding scheduled maintenance downtime from the operating time base.
PM Compliance
Completed PM tasks ÷ scheduled PM tasks × 100
Only tasks completed within their defined window count as compliant — a task finished a week late after the machine already failed does not retroactively count.
Maintenance Cost per Unit
Total maintenance spend ÷ production output
Normalizes cost across production volume swings, making it possible to compare maintenance efficiency across months with very different output levels.
Numbers Nobody Has to Reconstruct by Hand at Month End
iFactory calculates MTTR, MTBF, and PM compliance automatically from live work order data, so the dashboard is always current instead of rebuilt from spreadsheets once a month.
Benchmark Ranges Across Textile Equipment Classes
| Equipment Class | Target MTBF | Target MTTR | Target PM Compliance |
|---|---|---|---|
| Ring Spinning Frames | 500-800 hrs | 2-4 hrs | 90%+ |
| Rapier / Air-Jet Looms | 350-600 hrs | 1.5-3 hrs | 88%+ |
| Dyeing Machines (Jet/Winch) | 600-900 hrs | 3-6 hrs | 92%+ |
| Stenter / Finishing Lines | 700-1000 hrs | 4-8 hrs | 90%+ |
Why Benchmarks Vary So Much Across Equipment Classes
The wide range in the benchmark table above isn't imprecision — it reflects genuinely different failure mechanics across textile equipment classes. Ring spinning frames run continuously at high spindle speeds with hundreds of moving parts per machine, so their MTBF naturally sits lower than a stenter or finishing line, which has fewer high-wear components running at a comparatively gentler pace. Dyeing machines occupy a middle ground, with MTTR skewing longer than looms because a dyeing fault often requires draining, cleaning, and re-loading a batch before a repair can even begin, adding time that has nothing to do with the mechanical complexity of the fix itself.
Plants that ignore this and hold every machine to the same numeric target end up either accepting genuinely poor performance on high-wear equipment or wasting reliability effort chasing marginal gains on equipment that's already running near its practical ceiling. Setting targets by equipment class, informed by both industry benchmarks and each plant's own historical baseline, produces goals that are challenging without being either meaningless or discouraging.
Reading a Trend Instead of a Snapshot
A single month's MTBF number tells a manager almost nothing on its own — 550 hours could be an improvement or a decline depending entirely on what came before it. The value of a dashboard is less about any single reading and more about the trend line it builds over consecutive periods, which is what actually signals whether a reliability initiative is working or whether a specific machine is quietly degrading toward a bigger failure. A gauge-style trend view makes this legible at a glance rather than requiring someone to mentally compare six months of numbers in their head.
Dashboard Tiers: What to Watch Daily, Weekly, and Monthly
Not every KPI belongs on the same review cadence, and treating them all as equally urgent is a fast way to drown a maintenance meeting in numbers that don't change the day's decisions. Daily figures should be narrow and actionable — open work orders, machines currently down, and today's PM tasks due. Weekly review widens to include MTTR trends and PM compliance by department, giving a supervisor enough signal to redirect technician time before a backlog builds. Monthly review is where MTBF, cost per unit, and cross-machine benchmarking belong, since these numbers need a longer window to separate a genuine trend from ordinary week-to-week noise.
Open Work Orders & PM Due Today
Shift supervisors check this to allocate technician time and flag any overdue task before it becomes a missed compliance record.
MTTR Trend & PM Compliance by Line
Maintenance leads use this to spot a department slipping behind on planned work before it compounds into a full backlog.
MTBF & Cost per Unit by Equipment Class
Plant managers use this longer window to evaluate whether a reliability initiative is actually paying off across a full production cycle.
Beyond the Core Four: Secondary Metrics Worth Tracking
MTTR, MTBF, PM compliance, and cost per unit form the core of most textile maintenance dashboards, but a handful of secondary metrics add meaningful context once the core four are stable and well understood. Backlog hours — the total estimated labor time for all open, unassigned work orders — signals whether the maintenance team has enough capacity relative to demand, and a steadily growing backlog is often the earliest warning sign of a team that's falling behind before any single KPI shows it clearly. Emergency work order percentage, the share of all work orders that are unplanned versus scheduled, is a useful cross-check on PM compliance, since a plant can technically hit its PM completion target while still running mostly reactive if the PM schedule itself is too thin to catch real degradation.
Spare parts fill rate — the percentage of requested parts available in inventory at the moment they're needed — connects the maintenance dashboard to the procurement and inventory function, and a declining fill rate frequently explains an MTTR increase that would otherwise look like a mysterious drop in technician performance. First-time fix rate, the share of repairs that resolve the issue without a follow-up visit for the same fault within a short window, catches a different failure mode entirely: technicians treating symptoms rather than causes, which the RCFA discipline discussed elsewhere is designed to address directly. None of these secondary metrics need their own dedicated dashboard tile from day one, but each earns a place once a plant's maintenance program matures past the basics.
Backlog Hours
Sum of estimated labor hours across all open work orders
A rising trend signals capacity strain well before any single-machine KPI shows the effect.
Emergency Work Order %
Unplanned work orders ÷ total work orders × 100
Cross-checks whether high PM compliance is actually preventing failures or just completing a schedule that's too thin to matter.
Spare Parts Fill Rate
Parts available at request time ÷ total parts requested × 100
A declining fill rate often explains an MTTR increase that otherwise looks like a technician performance problem.
A Composite Case: Turning PM Compliance Into a Real Metric
A mid-size composite mill had reported PM compliance above 95% for over a year, a number that looked excellent on paper but didn't match the plant's actual unplanned downtime, which remained stubbornly high. When the maintenance manager dug into how the number was being calculated, the issue became clear: technicians were marking PM tasks complete in the log the moment they were assigned, not when they were actually finished, and several "completed" tasks had in fact been skipped entirely during a busy week and never followed up on.
Switching to a system where PM completion required a timestamped sign-off, tied to an actual checklist rather than a single tick box, dropped the reported compliance rate to 71% in the first month — a number that looked far worse but was, for the first time, actually true. Over the following two quarters, as the team worked the real backlog down and closed the gap between reported and actual compliance, MTBF on the affected machines rose by roughly 30%, and unplanned downtime tied to preventable failures fell noticeably. The lesson wasn't that PM compliance had gotten worse — it was that the number had been meaningless the entire time, and only became useful once it measured something real.
The broader lesson from this case extends well beyond PM compliance specifically: any KPI is only as trustworthy as the process that generates it. A plant can technically hit every target on paper while the underlying reliability problem remains completely unaddressed, simply because the data collection method allows shortcuts that a stricter, timestamp-based process would catch. Before trusting any KPI dashboard as a genuine reflection of maintenance performance, it's worth asking the same question this mill eventually asked itself — not just what the number says, but exactly how that number gets produced, and whether the people entering the data have any incentive, even an unintentional one, to make it look better than reality.
Building a Dashboard Technicians and Managers Both Trust
Every metric has one agreed definition
If two supervisors calculate MTTR differently, the dashboard number becomes a source of argument instead of a shared reference point.
Data entry happens at the point of work, not after the fact
Numbers reconstructed from memory at week's end are consistently less accurate than timestamps captured as the work actually happens.
The dashboard is reviewed on a fixed cadence, not only when something breaks
A dashboard nobody opens between crises never catches a slow decline before it becomes an emergency.
Technicians can see how their own work affects the numbers
Compliance improves fastest when the people doing the work can see the same metrics leadership is reviewing, not just a summary handed down after the fact.
Rolling Out a Dashboard Without Losing the Team's Trust
Introducing formal KPI tracking to a maintenance team that has never operated under one carries real risk if it's handled poorly — technicians can reasonably read a new dashboard as a surveillance tool aimed at catching them underperforming rather than a shared instrument for improving the plant's reliability. The rollout approach matters as much as the metrics themselves. Plants that succeed tend to introduce the dashboard first as a diagnostic tool the team uses together, reviewing early numbers as a group and discussing what they reveal about process gaps rather than individual performance, before any numbers get tied to evaluations or incentives.
It also helps to be transparent about the fact that early numbers, especially compliance rates, will often look worse once tracking tightens — as the earlier composite mill example showed — and to frame that dip explicitly as evidence the system is finally measuring something real rather than as a performance failure. Teams that understand this upfront are far less likely to feel blindsided or defensive when the first honest numbers come in lower than the informal, self-reported figures they replaced. Over a few months, as the team sees the dashboard actually driving decisions — faster parts ordering, better shift staffing, a chronic failure finally getting investigated — the tool earns trust on its own, and the resistance that greets most new tracking systems tends to fade.
Frequently Asked Questions
What's a realistic MTBF target for a textile plant just starting to track it?
Plants beginning formal tracking should expect the first two or three months of data to establish a baseline rather than hit any specific target, since the number is meaningless without a prior period to compare against. Once a baseline exists, a reasonable early goal is a 15-20% improvement over two to three quarters through basic interventions like consistent PM completion and faster spare parts availability, with further gains requiring more targeted reliability work on specific chronic failure points. Visit support to see how baseline periods are handled during dashboard setup.
Why does PM compliance sometimes go down when a plant improves its tracking?
This is one of the most common and most misunderstood patterns in maintenance KPI adoption. A plant with loose or self-reported compliance tracking often shows inflated numbers because tasks get marked complete without real verification. When tracking tightens to require actual sign-off and evidence of completion, the reported number frequently drops even though nothing about the actual maintenance work has changed — it simply became honest. Plants should expect and prepare for this dip rather than treating it as a sign that performance declined.
Should MTTR include the time spent waiting for spare parts?
Most reliability practitioners recommend tracking parts wait time as a separate sub-metric rather than folding it silently into MTTR, because the two have very different causes and very different fixes. A long MTTR driven by slow diagnosis points to a training or documentation gap, while a long MTTR driven by parts unavailability points to an inventory or procurement problem — blending them into one number makes it much harder to know which lever to pull.
How often should a textile plant review its full KPI dashboard with leadership?
A monthly leadership review works well for most plants, giving MTBF and cost-per-unit trends enough time to separate signal from noise while still catching problems before they compound over a full quarter. Daily and weekly metrics should be reviewed at the operational level by supervisors and maintenance leads far more frequently, since those numbers are meant to drive same-day and same-week decisions rather than wait for a monthly meeting.
Can a small textile plant benefit from KPI tracking without a full CMMS rollout?
Yes, though the ceiling on accuracy is lower — a plant can start with a simple spreadsheet tracking failure timestamps and PM completion, which is far better than tracking nothing at all. The main risk is that manual entry tends to drift in consistency over time as the novelty wears off, which is usually the point at which plants look toward a system that captures the same data automatically at the point of work. Book a demo to see what automated KPI capture looks like in practice.
Stop Rebuilding Your Maintenance Numbers From Scratch Every Month
iFactory keeps MTTR, MTBF, PM compliance, and cost per unit current automatically, so the dashboard reflects what's actually happening on the floor instead of last month's spreadsheet reconstruction.