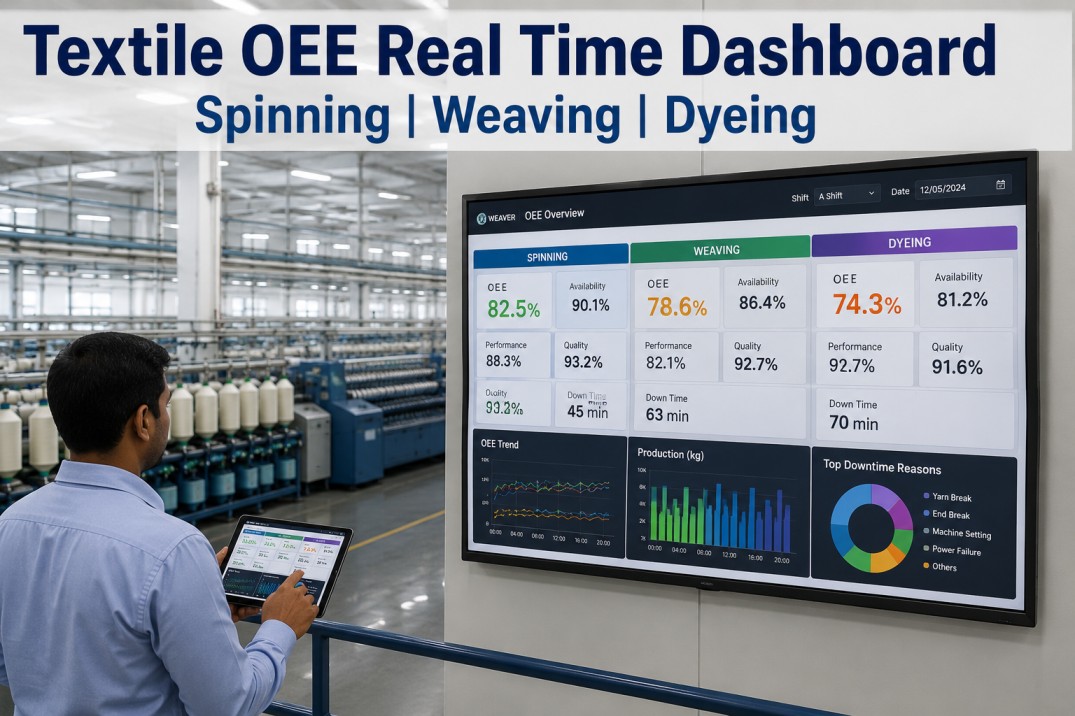
Textile mills collect maintenance data on every machine stop, every repair action, every PM task completed. Yet most mills cannot answer the three questions that determine whether their maintenance organization is improving or degrading: What is our mean time between failures by department this quarter compared to last? How does our fixer response time and repair speed compare to industry benchmarks? Is our preventive maintenance compliance actually translating into fewer breakdowns or are we checking boxes without reducing stops? Without structured KPI tracking, maintenance teams operate on anecdotal evidence rather than measurable performance data. Mills that track and act on maintenance KPIs consistently achieve 25 to 35 percent lower maintenance cost per unit of production, 40 to 50 percent fewer unplanned stops, and 15 to 20 percent longer equipment life compared to mills that do not measure their maintenance performance. The KPIs and benchmarks below are drawn from data collected across 500-plus textile mills operating spinning, weaving, knitting, and finishing equipment.
Get the Complete Textile Maintenance KPI Benchmark Guide
iFactory provides a real-time maintenance KPI dashboard with automated MTTR, MTBF, and PM compliance tracking, industry benchmark comparisons, and trend analytics across every department. Deployed in 7 to 14 days.
Your Mill versus Industry Benchmarks
The benchmark bars below compare your potential mill performance against industry averages and top-quartile targets. Each bar shows the range from current baseline through industry average to top-quartile performance across 500-plus textile operations.
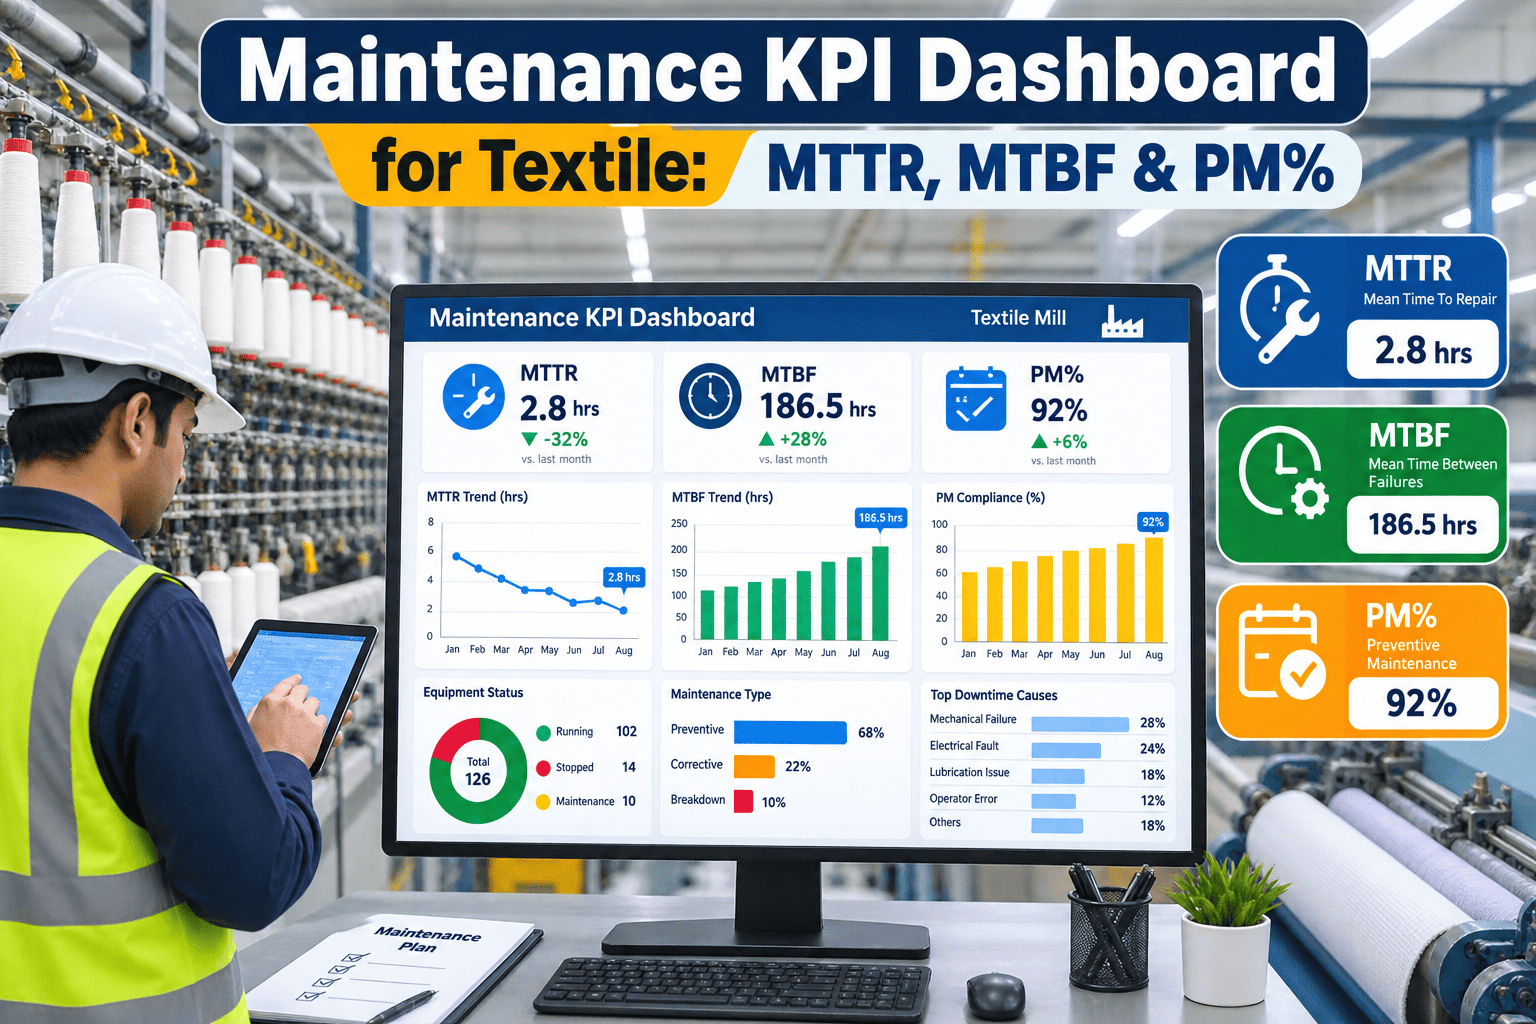
MTTR
Hours per repair eventMean Time To Repair measures average hours from stop notification to machine restart. Top mills achieve sub-2-hour MTTR through structured fixer zones and mobile dispatch.
MTBF
Hours between failuresMean Time Between Failures tracks average operating hours between unplanned stops. Top-quartile mills exceed 168 hours or one full week of production between breakdowns.
PM Compliance
Percent of tasks completed on timePM Compliance measures scheduled preventive tasks completed within the defined frequency window. Top mills achieve 95 percent through mobile checklists and automated tracking.
OEE
Overall equipment effectivenessOverall Equipment Effectiveness combines availability, performance, and quality. Top-quartile textile mills sustain 92 percent OEE through data-driven maintenance.
Key Maintenance KPI Formulas
Each maintenance KPI follows a standard formula that enables consistent measurement across departments and time periods. The formulas below show how each metric is calculated with example values from a typical weaving mill.
Maintenance KPI Dashboard
A comprehensive maintenance dashboard tracks KPIs across four dimensions: response speed, reliability, compliance, and cost impact. The scorecard below shows target values and trend indicators for each metric.
Track the Right Maintenance KPIs Across Every Department
iFactory’s maintenance analytics platform automatically calculates MTTR, MTBF, and PM compliance in real time, compares your performance against industry benchmarks, and identifies the specific actions that will improve each metric. Deployed in 7 to 14 days.
Department-Level Benchmark Table
Maintenance benchmarks vary significantly by department due to differences in machine speed, component wear rates, and operating conditions. The table below shows typical ranges for each KPI across the four main textile departments.
| Department | MTTR (hr) | MTBF (hr) | PM Comp. | OEE | Maint. Cost |
|---|---|---|---|---|---|
| Spinning | 2.5 – 4.0 | 80 – 150 | 75 – 92% | 85 – 92% | $0.12 – $0.25/kg |
| Weaving | 1.5 – 3.5 | 60 – 120 | 78 – 95% | 82 – 92% | $0.15 – $0.30/m |
| Knitting | 2.0 – 3.5 | 70 – 130 | 72 – 90% | 80 – 90% | $0.10 – $0.20/kg |
| Dyeing & Finishing | 3.0 – 5.0 | 40 – 80 | 70 – 88% | 75 – 85% | $0.08 – $0.15/m |
PM Compliance Heatmap by Month
Tracking PM compliance at the department level month over month reveals trends that aggregate numbers hide. The heatmap below displays the percentage of PM tasks completed on time across four departments over a six-month period.
| Department | Jan | Feb | Mar | Apr | May | Jun |
|---|---|---|---|---|---|---|
| Spinning | 92% | 94% | 85% | 91% | 93% | 95% |
| Weaving | 82% | 84% | 90% | 86% | 92% | 88% |
| Knitting | 71% | 74% | 80% | 82% | 76% | 84% |
| Dyeing & Finishing | 68% | 72% | 70% | 78% | 82% | 80% |
Frequently Asked Questions
Stop Guessing Your Maintenance Performance. Start Measuring It.
iFactory gives textile mills a complete maintenance KPI platform with automated MTTR, MTBF, and PM compliance tracking, real-time dashboards, industry benchmark comparisons, and department-level heatmaps. Deployed in 7 to 14 days.