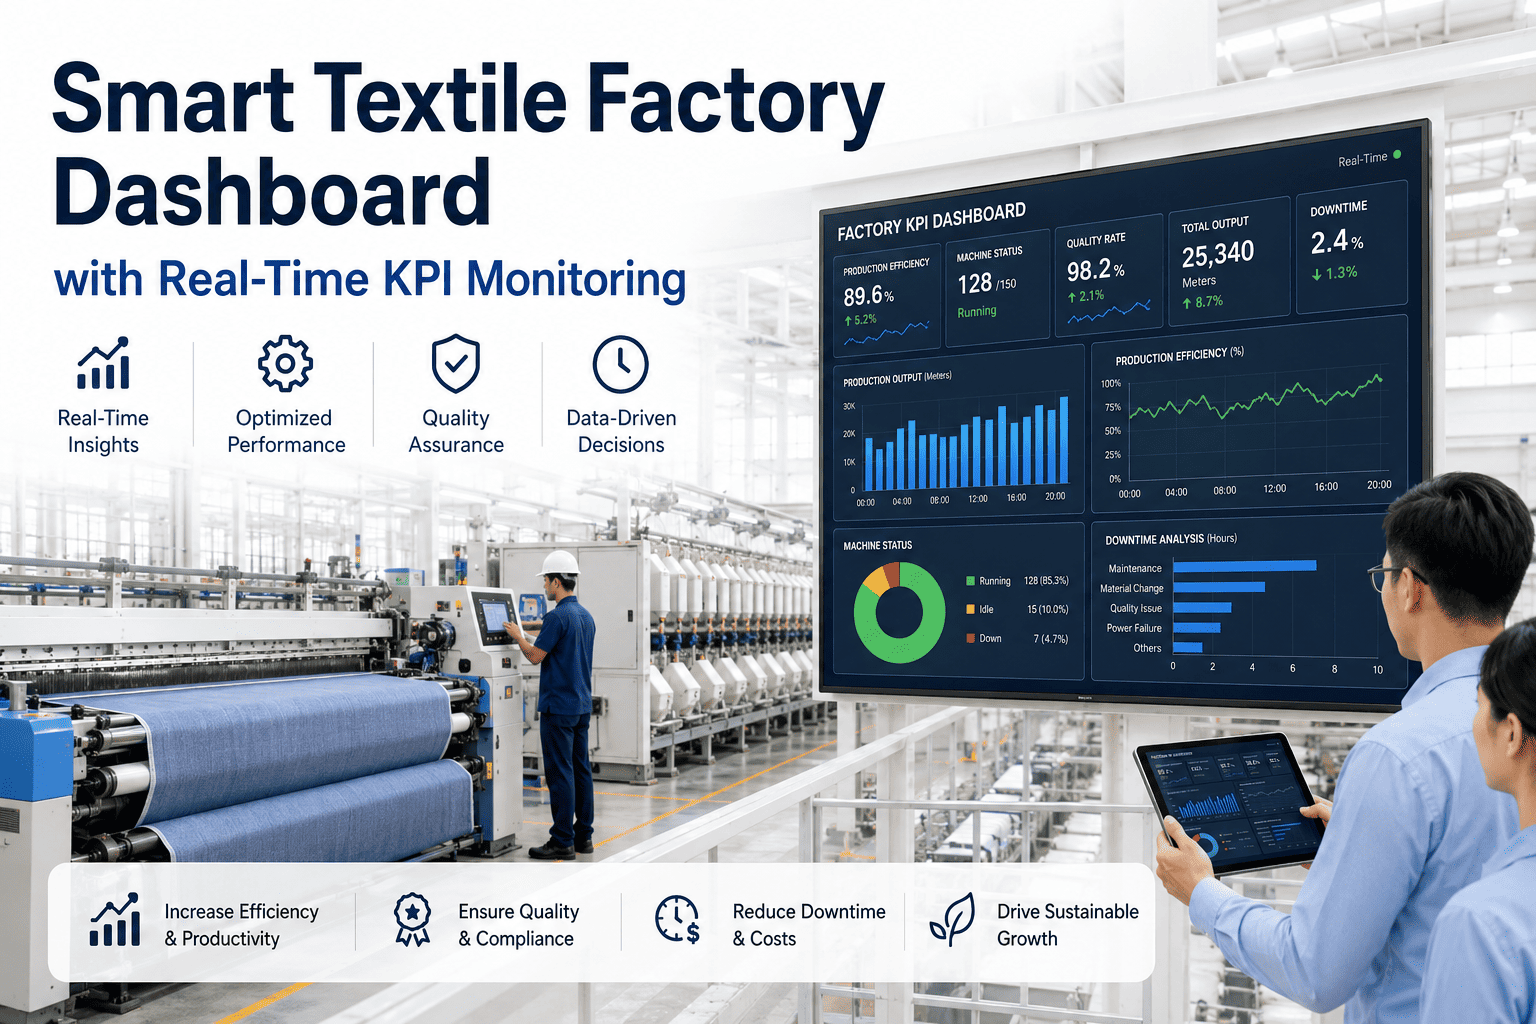
A textile group running four plants often has four different answers to the same question: what was OEE last week. Not because the machines disagree, but because each plant calculates it slightly differently, reports it on a different cycle, and rolls it up into a different spreadsheet before it ever reaches group leadership. The fix is rarely more reporting, it is one shared definition and one shared dashboard that every plant feeds the same way, and you can see what that consolidated view looks like before you build one yourself.
Multi-plant visibility
Give Group Leadership One Dashboard Instead of Four Different Spreadsheets
Standardize how every plant defines and reports its KPIs, then roll them up into a single live dashboard that lets leadership compare sites honestly, not just read separate reports.
4
plants, one shared OEE definition
1
dashboard instead of separate reports
24
hour reporting lag removed
The problem
Why Multi-Plant Visibility Quietly Breaks Down
None of this happens on purpose. It builds up gradually as each plant adopts its own reporting habits to solve its own local problem.
Each plant built its own reports
Local teams built spreadsheets and dashboards to solve their own immediate reporting needs, without a shared template.
KPI definitions were never aligned
One plant counts planned stops inside downtime, another excludes them, so the same word means two different numbers.
Reporting cycles do not match
One plant reports daily, another weekly, which makes any group-level comparison a few days out of date by default.
Consolidation is manual
A head office analyst pulls files from each plant and merges them by hand before anyone sees a group-level number.
The real cost
When the Same KPI Name Means Three Different Numbers
The clearest sign of a multi-plant visibility problem is a KPI that is defined three different ways across three plants, all reported under the same name.
| Plant | How OEE is currently calculated | What it excludes |
| Plant A |
Based on scheduled production time only |
Planned maintenance stops |
| Plant B |
Based on total available time including breaks |
Nothing, which lowers the score relative to A |
| Plant C |
Based on scheduled time, but counts changeovers as uptime |
Changeover losses, which inflates the score |
None of these three plants are wrong on their own terms, but none of their numbers can be honestly compared until every plant agrees on one shared formula.
The rollup
How Data Should Flow From Machine to Group Dashboard
A standardized dashboard is built on a simple rollup: the same raw data, captured the same way at every plant, aggregated upward through consistent levels.
Group Dashboard
Plant A3 production lines
Plant B5 production lines
Plant C4 production lines
Line-level machine data
Line-level machine data
Line-level machine data
Every level above the machine is just an aggregation of the level below it, which is why getting the machine-level capture right matters more than the dashboard design itself.
Map Your Own Multi-Plant Rollup
Tell us how your plants currently report, and we will show you what a standardized, single rollup would look like for your group.
What leadership sees
What a Unified Multi-Plant Dashboard Actually Shows
The goal is not more charts. It is a small number of views that let leadership compare plants fairly and drill into one when something looks off.
Getting there
Standardizing KPIs Across Plants Without Stalling Production
Standardization does not require shutting down a plant to retrofit it. It is usually a short, staged process that runs alongside normal production.
1
Agree on one written definition for each core KPI, with input from every plant manager.
2
Map each plant's current data capture against the new shared definition to find the gaps.
3
Roll the standardized capture out to one plant first and confirm the numbers match expectations.
4
Extend the same capture to the remaining plants and retire the old, separate reports.
Frequently asked questions
What Groups Ask Before Standardizing Across Plants
Will plants resist changing a KPI definition they have used for years?
Some resistance is normal, especially if a plant's historical numbers look worse under the new shared definition, which is why involving plant managers in setting the definition matters more than announcing it from head office.
Ask support how other groups handled this transition.
Do all plants need the same machines or software before this works?
No, a standardized dashboard works across plants with different machine ages and even different local systems, as long as each plant's data is mapped to the same shared KPI definitions before it rolls up.
Discuss your specific plant mix with our team.
How long does it take to roll standardized KPIs out across four or five plants?
A phased rollout starting with one plant and extending outward typically reaches the full group within a few months, though the exact pace depends on how different each plant's current reporting setup already is.
Get a realistic rollout estimate for your group.
Can a group-level dashboard still show plant-specific detail when needed?
Yes, a well-built rollup keeps the underlying line and machine data intact, so leadership can view the group summary and still drill down into any single plant's detail without losing context.
See a drill-down view on a short call.
What is the first KPI most groups choose to standardize first?
OEE and downtime by cause are usually standardized first, since they are the two metrics leadership compares across plants most often and the ones where inconsistent definitions cause the most confusion.
Confirm your priority KPIs with our specialists.
One definition, one dashboard, every plant
Bring Every Plant Into One Standardized Dashboard
Book a session with iFactory AI to see how your group's plants can report on the same KPIs, the same way, in one live view.