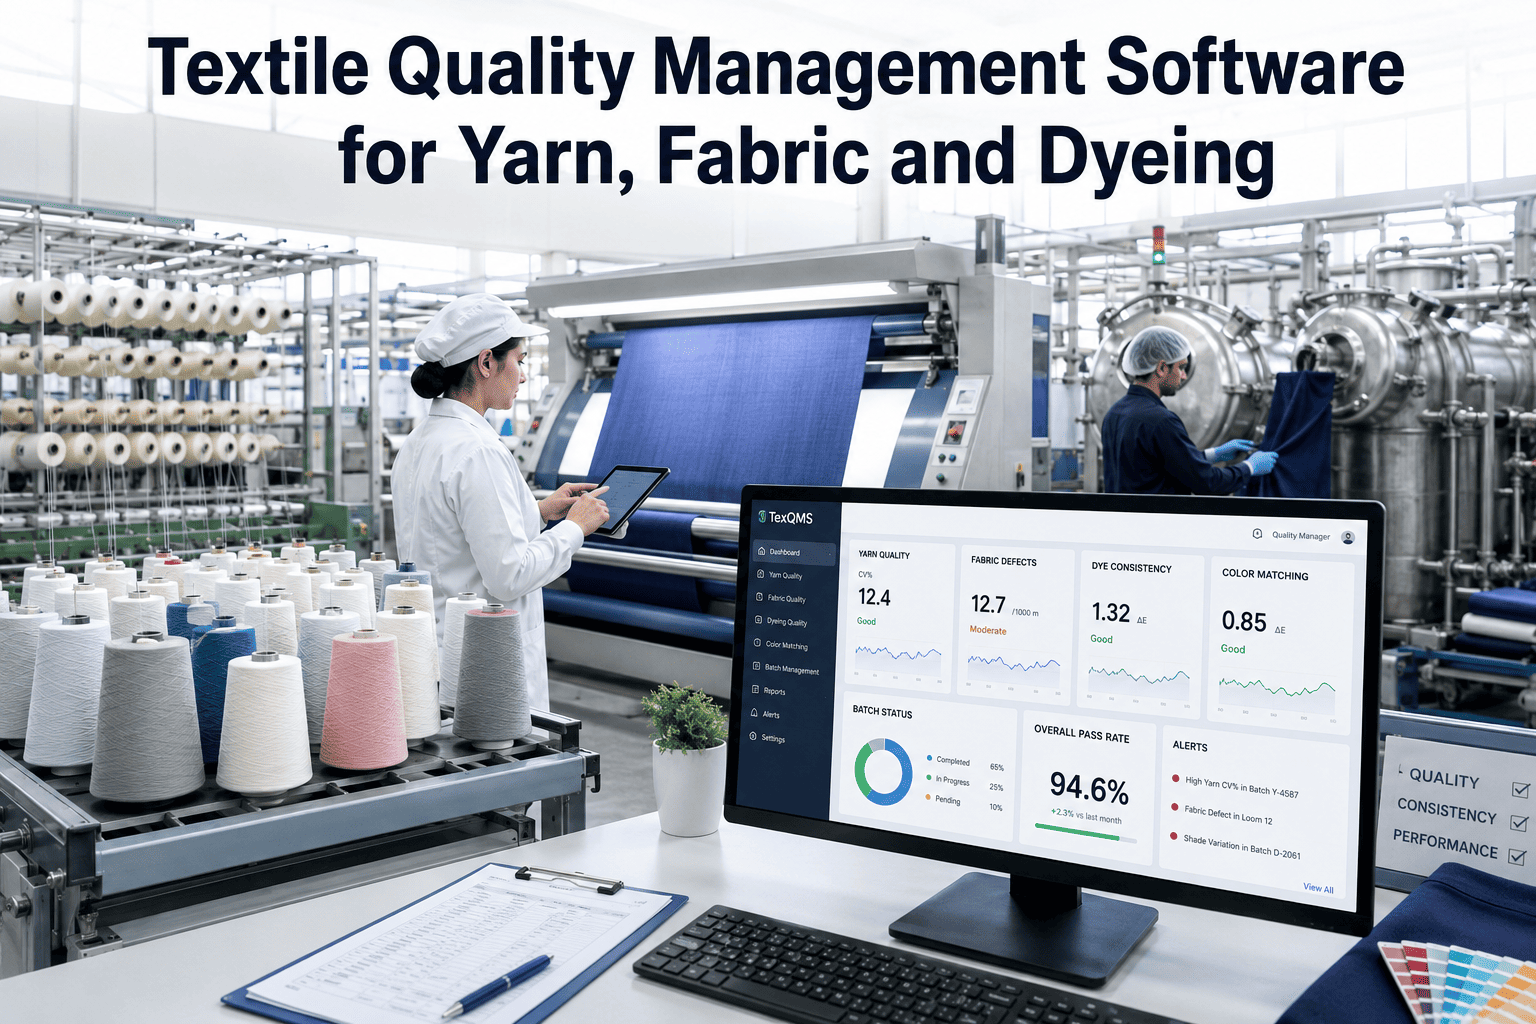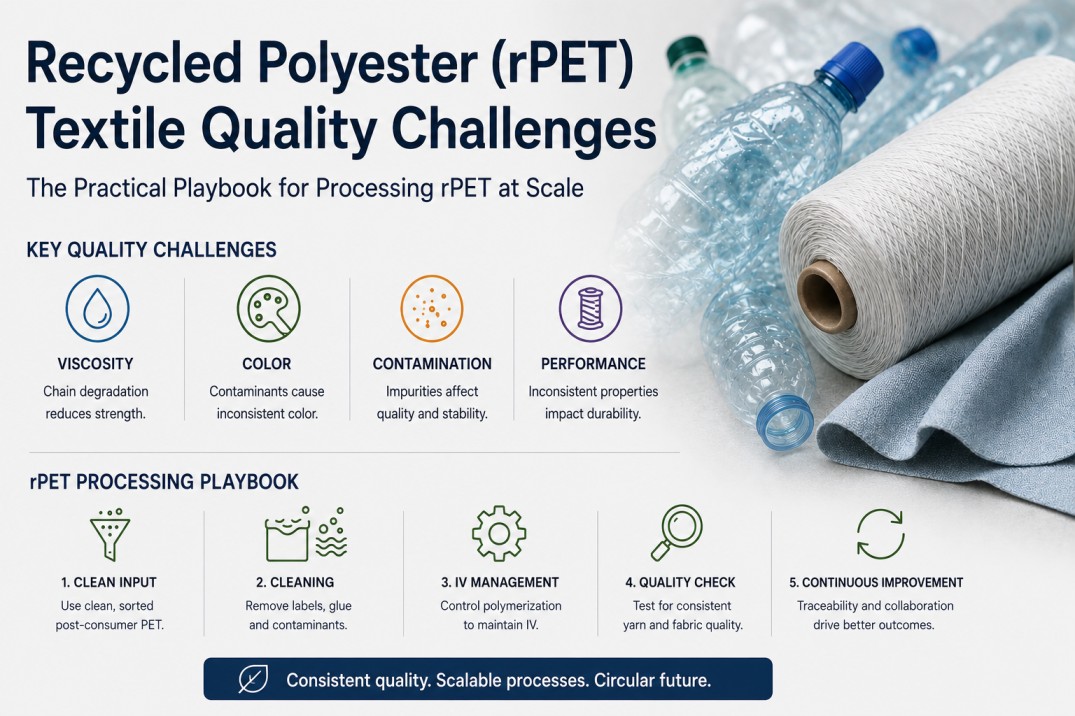
The global textile industry consumed approximately 70 million metric tons of polyester in 2025, with recycled polyester (rPET) accounting for roughly 15 to 18 percent of total fiber production. Major apparel brands including Nike, Adidas, H&M, Inditex, Patagonia, and Target have set public targets to source 50 to 100 percent recycled polyester by 2030, creating a demand surge that far exceeds current rPET supply capacity at acceptable quality levels. The fundamental challenge facing textile mills is that each reprocessing cycle shortens PET polymer chains — intrinsic viscosity drops from 0.72 dL/g in virgin bottle-grade PET to 0.55 to 0.62 dL/g in fiber-grade rPET after a single recycling pass — and cumulative contamination from labels, adhesives, dyes, and non-PET polymers introduces variability that impacts spinning stability, yarn tenacity, dye consistency, and final fabric quality. Managing these quality parameters at commercial scale requires systematic sorting, blending protocols, processing adaptations, and inline quality monitoring that most mills have not yet implemented.
Solve rPET Quality Challenges with iFactory
iFactory rPET Quality Module provides real-time intrinsic viscosity monitoring, contamination detection, and batch blending optimization to help mills achieve consistent rPET yarn quality at scale.
Four Critical Quality Drops in rPET Processing
Each recycling pass degrades PET polymer chains and introduces contaminants that affect downstream processing. The four parameters below show the most consequential quality differences between rPET and virgin PET fiber production.
Virgin bottle-grade PET at 0.72 dL/g drops to 0.55–0.62 after one recycling cycle due to chain scission from thermal and hydrolytic degradation. Below 0.55 dL/g, spinning pressure rises sharply and yarn tenacity falls below commercial acceptability for most apparel applications.
Yellowing occurs from dye residues, thermal degradation products, and catalytic residues in the recycled melt. A b* increase of 3 to 7 units versus virgin PET limits rPET use in white and pastel fabrics unless optical brighteners or higher virgin blend ratios are used.
HDPE caps, paper labels, adhesive residues, nylon fragments, and elastane fibers survive sorting and washing at rates of 1 to 5 percent by weight. These contaminants cause filter pack pressure buildup, spinneret blockage, and weak spots that lead to yarn breaks during weaving or knitting.
Tenacity drops 15 to 25 percent from reduced molecular weight and increased crystallinity. Elongation at break decreases 30 to 50 percent, making rPET yarns more brittle and prone to breakage during high-speed processing. Draw ratio adjustments can partially recover properties.
rPET vs Virgin PET — Seven Quality Parameters Compared
Each horizontal bar shows the typical range for virgin PET (blue) and rPET (amber), with the overlapping zone indicating where rPET can match virgin performance with proper processing controls.
Contaminant Classification Matrix
Understanding contaminant types, their sources, detection difficulty, and impact severity is the first step toward an effective rPET quality control system.
| Contaminant | Source | Detection | Impact | Mitigation |
|---|---|---|---|---|
| HDPE / PP Caps | Bottle caps, closures | X-ray, density separation | Filter blockage, melt defects | Float-sink tank, air cyclone |
| Paper / Adhesives | Labels, sleeve wraps | Optical sorting | Carbon specks, filter blinding | Hot caustic wash + friction washer |
| Dye Residues | Ink, colored bottles | Color sorting NIR | Color shift, batch inconsistency | Color sorting at intake, blending |
| Nylon / PA Fragments | Multilayer bottles | NIR, density separation | Gel formation, weak yarn spots | Density separation, melt filtration |
| PU / Elastane | Textile waste blends | NIR, manual sorting | Spinneret blockage, yarn breaks | Pre-sorting textile waste by composition |
| Metals / Glass | Mishandled collection | Magnetic + eddy current | Equipment damage, spark risk | Metal detectors, magnets, manual QC |
| PVC / PETG | Non-PET bottles | X-ray, NIR specific | Chlorine corrosion, melt degradation | X-ray sorting, manual removal |
Eliminate Contamination Variability
iFactory contaminant tracking integrates with your sorting and washing line sensors to log contamination events, quantify removal efficiency per contaminant type, and certify batch purity to brand specifications.
Processing Adaptation — Six Stages From Bottle to Fiber
Each stage in the rPET processing chain requires specific adaptations to compensate for the quality differences between recycled and virgin feedstocks.
Batch Quality Scorecards — From Incoming to Finished Yarn
Real batch data from a commercial rPET fiber line shows the quality range achieved with proper sorting, SSP, and process control.
Frequently Asked Questions
What percentage of rPET can be used without visible quality degradation?
The answer depends on the application. For dark-colored fabrics (navy, black, charcoal), 100 percent rPET is feasible with proper processing controls. For white, pastel, and bright colors, 100 percent rPET typically shows detectable yellowing (b* increase of 3 to 7 units), so mills blend 30 to 50 percent virgin PET to achieve acceptable whiteness. For tire cord and industrial yarns requiring tenacity above 6.0 g/d, rPET content is limited to 20 to 30 percent. Most apparel brands accept up to 50 percent rPET in their standard blends and 100 percent rPET in dark shades, with some premium brands demanding 100 percent rPET across all colorways and accepting the b* trade-off for sustainability claims.
How many times can PET be recycled before fiber quality becomes unusable?
PET loses approximately 15 to 25 percent of its intrinsic viscosity per recycling cycle due to chain scission from thermal, hydrolytic, and oxidative degradation. After two cycles, IV drops below 0.50 dL/g, at which point melt spinning becomes unstable and yarn tenacity falls below 3.0 g/d — the practical minimum for most textile applications. Solid-state polymerization can restore IV by 0.05 to 0.10 dL/g per cycle, extending useful life to three or four cycles. In practice, most PET bottle material is recycled once into fiber, then the resulting fiber waste is either downcycled into lower-value applications (carpet, stuffing, geotextiles) or incinerated. True closed-loop bottle-to-bottle recycling achieves 5 to 7 cycles before the polymer must be supplemented with virgin material.
What is the cost premium for high-quality rPET versus virgin PET?
High-quality food-grade rPET pellets suitable for fiber production trade at a 5 to 15 percent premium over virgin PET pellet prices, reflecting the cost of collection, sorting, washing, and solid-state polymerization. Lower-quality rPET from mixed-color or post-industrial sources trades at a 10 to 20 percent discount to virgin but requires more virgin blending and process compensation. When all processing costs are included — additional filtration, SSP energy, slower spinning speeds, and lower yarn yields — the effective cost of producing 100 percent rPET fiber is 8 to 18 percent higher than virgin fiber. Many brands absorb this premium through sustainability budgets; others share the cost with mills through longer contracts or volume commitments.
How do brands verify rPET content and quality in finished fabric?
Brands use a combination of mass balance chain-of-custody certification (typically through GRS or RCS standards), carbon-14 dating (ASTM D6866) to measure fossil versus biogenic carbon content, and FTIR spectroscopy to detect non-PET polymer contamination. Quality verification includes IV measurement by solution viscometry (ASTM D4603), color measurement by spectrophotometer (b* value), tenacity and elongation testing (ASTM D2256), and contamination microscopy. Increasingly, brands require digital batch records from mill ERP or MES systems showing the exact blend ratio, processing parameters, and quality test results for each lot. iFactory's rPET module generates these records automatically from sensor and lab data, with blockchain-grade audit trails.
Can rPET meet OEKO-TEX Standard 100 certification requirements?
Yes, rPET can meet OEKO-TEX Standard 100 certification, but the recycling process introduces additional contamination risks that must be managed. Residual heavy metals from bottle pigments (antimony from PET catalyst, lead or chromium from colored bottles), phthalates from labels and adhesives, and nonylphenol ethoxylates from washing chemicals can carry over into rPET fiber and exceed OEKO-TEX limits if not removed. Mills must implement thorough washing, test each incoming bale lot for restricted substances, and document cleaning efficiency. OEKO-TEX now includes specific guidance for recycled materials in its test criteria, recognizing that recycled inputs require different risk assessment than virgin polymers. iFactory's OEKO-TEX compliance module includes rPET-specific testing protocols and documentation templates.
From Bottle Bale to Finished Fabric — Quality You Can Measure
iFactory's rPET Quality Module gives you visibility into every parameter that matters, from incoming IV to finished yarn tenacity, so you can certify quality and optimize blend ratios.