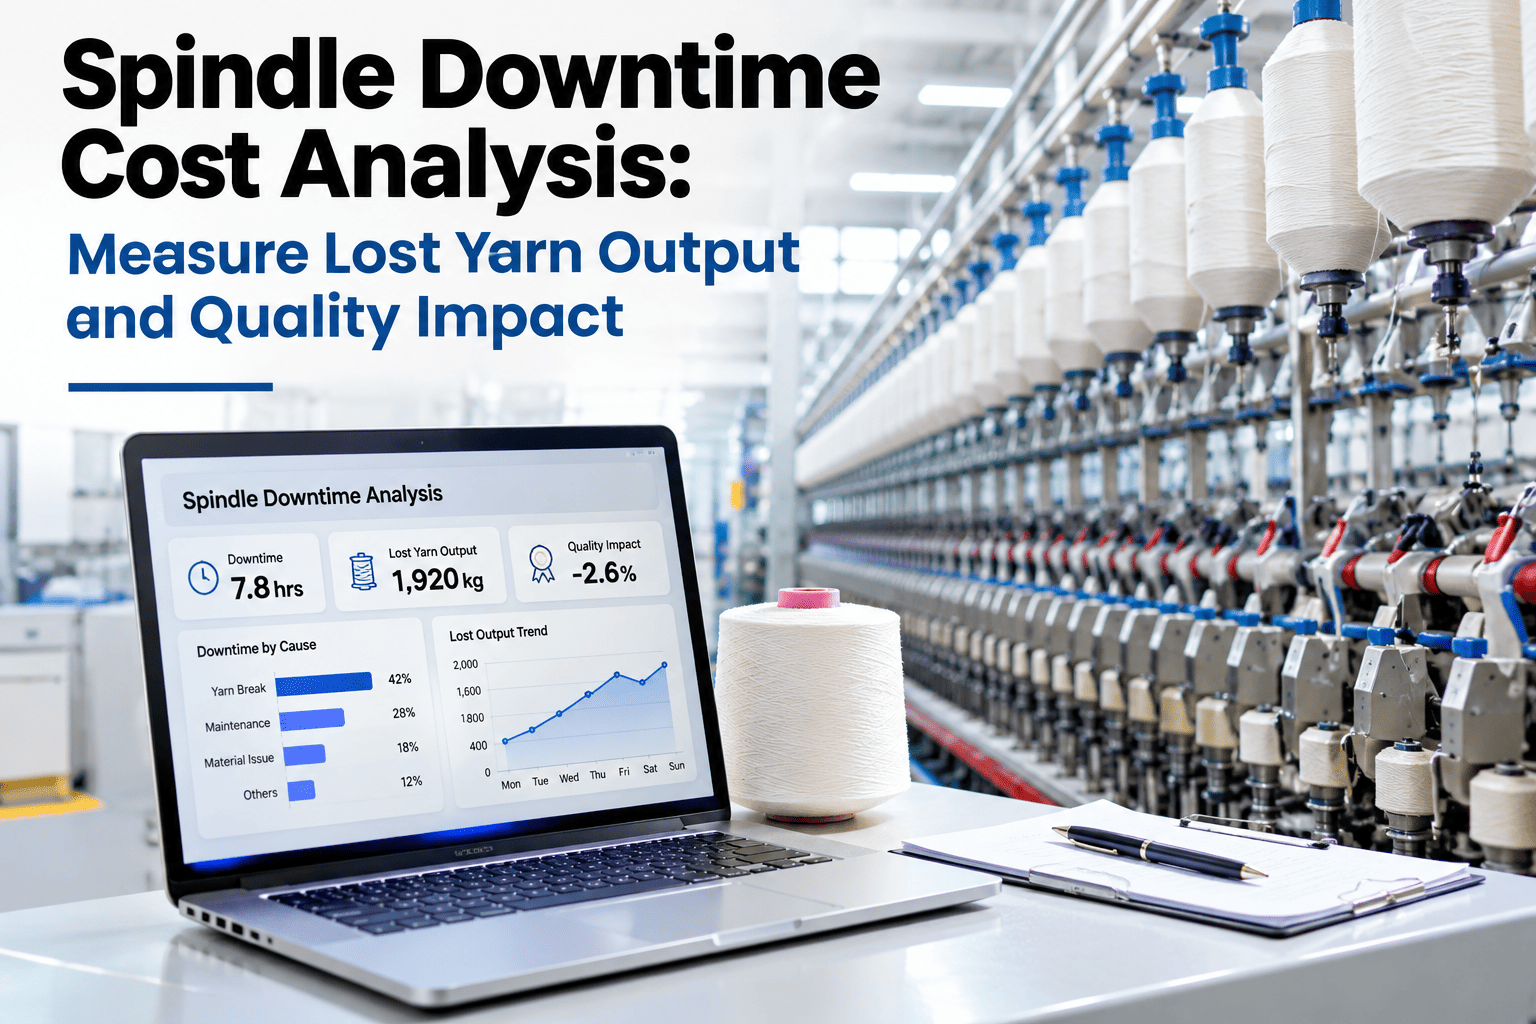
A spindle sitting idle for an hour does not just cost that hour of production — it costs the yarn output that spindle would have made, the quality risk from restarting a cold spindle, and sometimes a cascade of yarn breaks on neighboring spindles as tension patterns shift. A downtime figure measured only in hours misses most of what the failure actually cost. Spinning mills that want their own spindle downtime measured in real production and quality terms can review a downtime cost analysis using their own frame data with iFactory AI.
An Hour of Spindle Downtime Costs More Than an Hour
iFactory AI calculates lost yarn output, repair cost, yarn breaks and downstream quality effects per spindle failure, not just downtime duration.
What Spindle Downtime Cost Actually Includes
Duration alone tells you how long a spindle was stopped. It does not tell you how much yarn output was lost, what the repair itself cost, or whether the stoppage triggered quality issues on the spindles around it.
Why Downstream Effects Are the Most Underestimated Cost
| Downstream effect | Why it's easy to miss |
|---|---|
| Neighboring spindle tension shift | Not logged against the original spindle's failure record |
| Increased break rate nearby | Treated as a separate, unrelated event |
| Cold-restart quality risk | Restart quality rarely checked specifically against the stoppage |
See the Real Cost Behind a Recent Spindle Failure
Share a recent downtime event and a short session will show the full cost picture, not just the stoppage duration.
A Composite Scenario: The Failure That Cost Three Times What the Report Showed
A mill's downtime report logged a specific spindle failure as four hours of stoppage, valued only against that single spindle's lost output. A closer review found the failure had also triggered a noticeable uptick in yarn breaks on three adjacent spindles over the following shift, as tension patterns shifted during the restart, and the first batch of yarn produced after the restart showed slightly elevated unevenness that required closer quality screening. Counting all three effects together put the real cost of that single failure at roughly three times what the duration-only report had shown — a gap iFactory AI's team can help uncover in your own downtime records.
Why This Changes How Maintenance Priorities Get Set
Ranking spindle failures by duration alone can miss the ones with the highest real cost, if a shorter stoppage happens to trigger more downstream breaks or quality issues than a longer one that affects nothing else. Ranking by full cost, including downstream effects, points maintenance attention at the failures that actually matter most to total output and quality.
Frequently Asked Questions
See the Full Cost of Spindle Downtime, Not Just the Duration
iFactory AI calculates lost output, repair cost and downstream quality effects per spindle failure. Book a walkthrough with your own frame data.