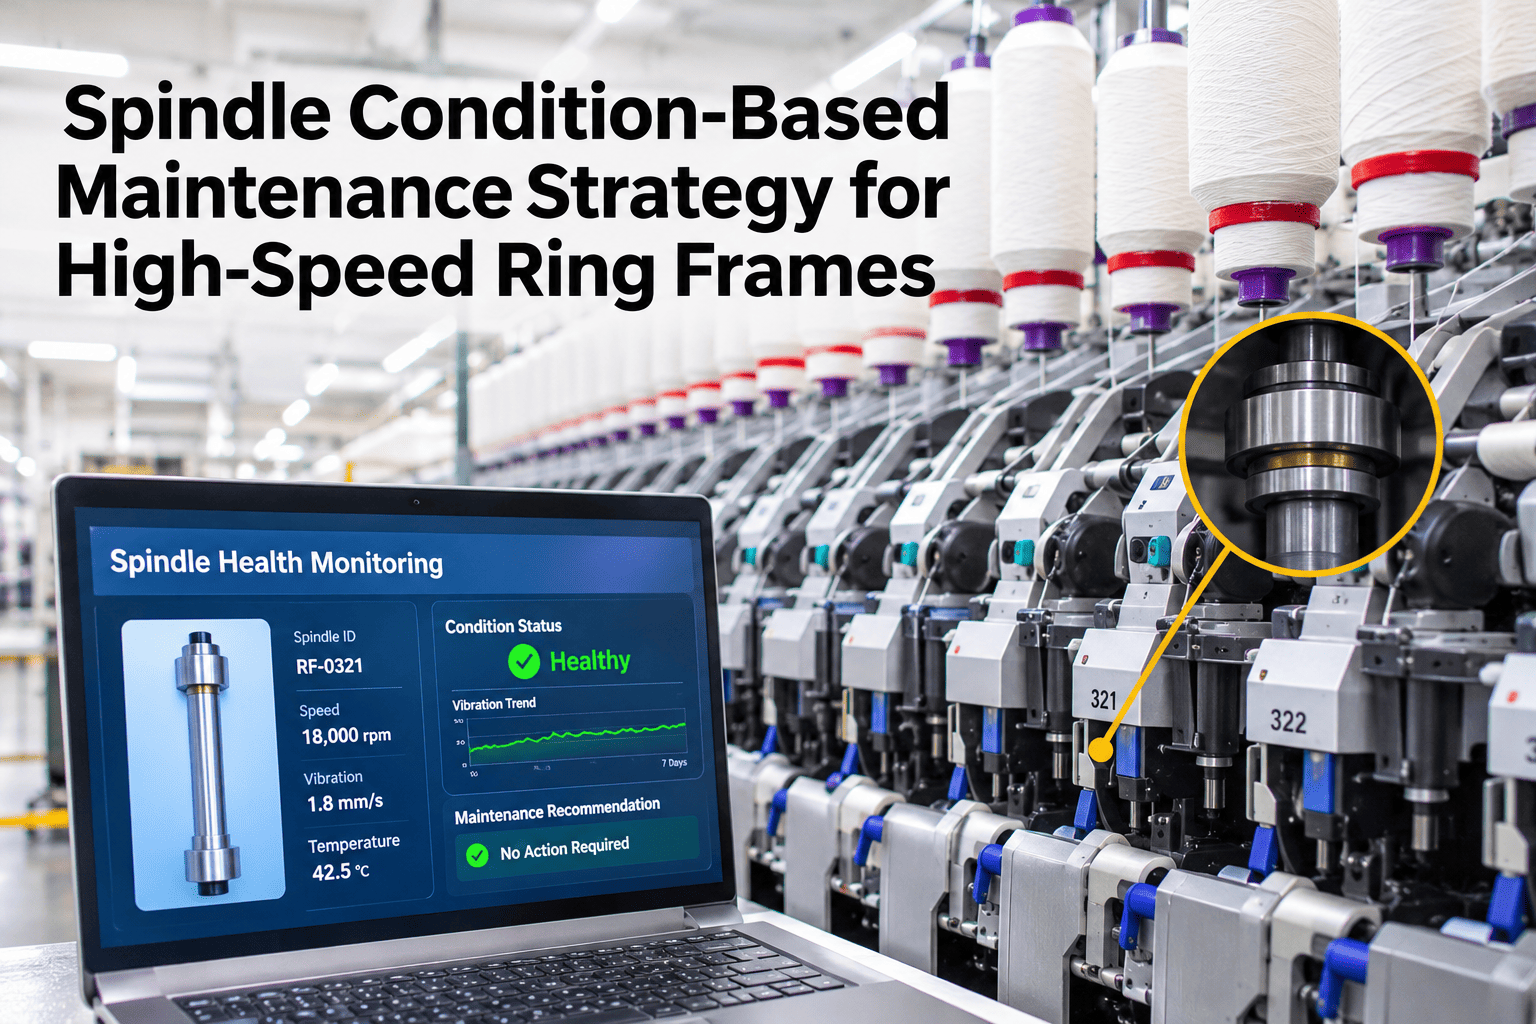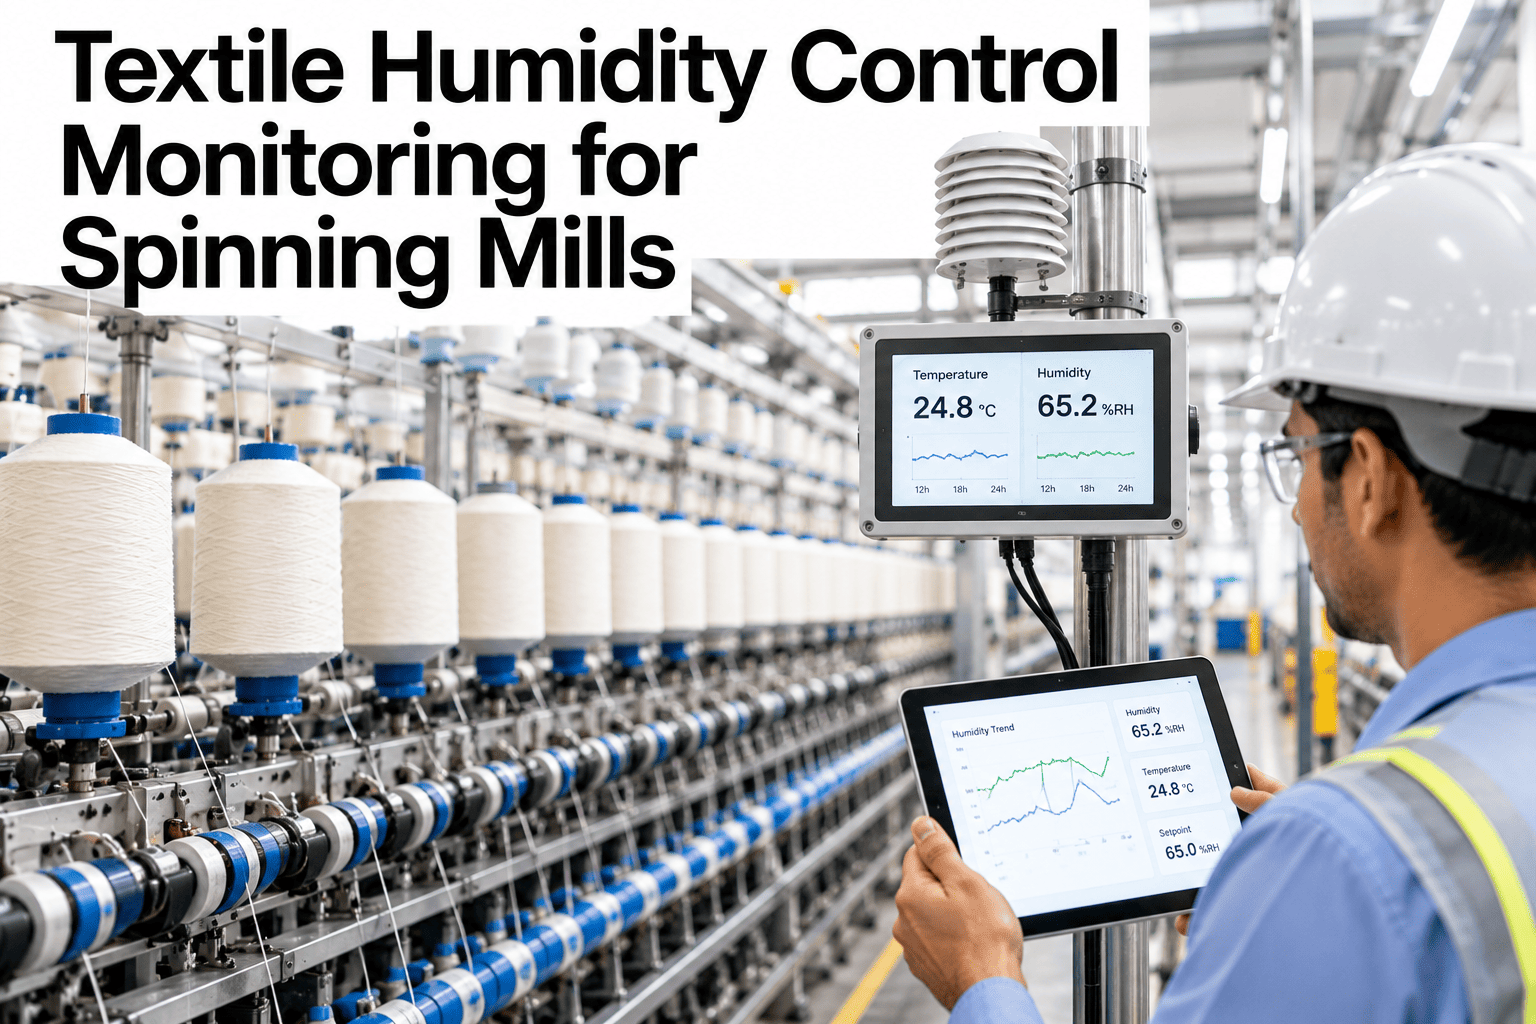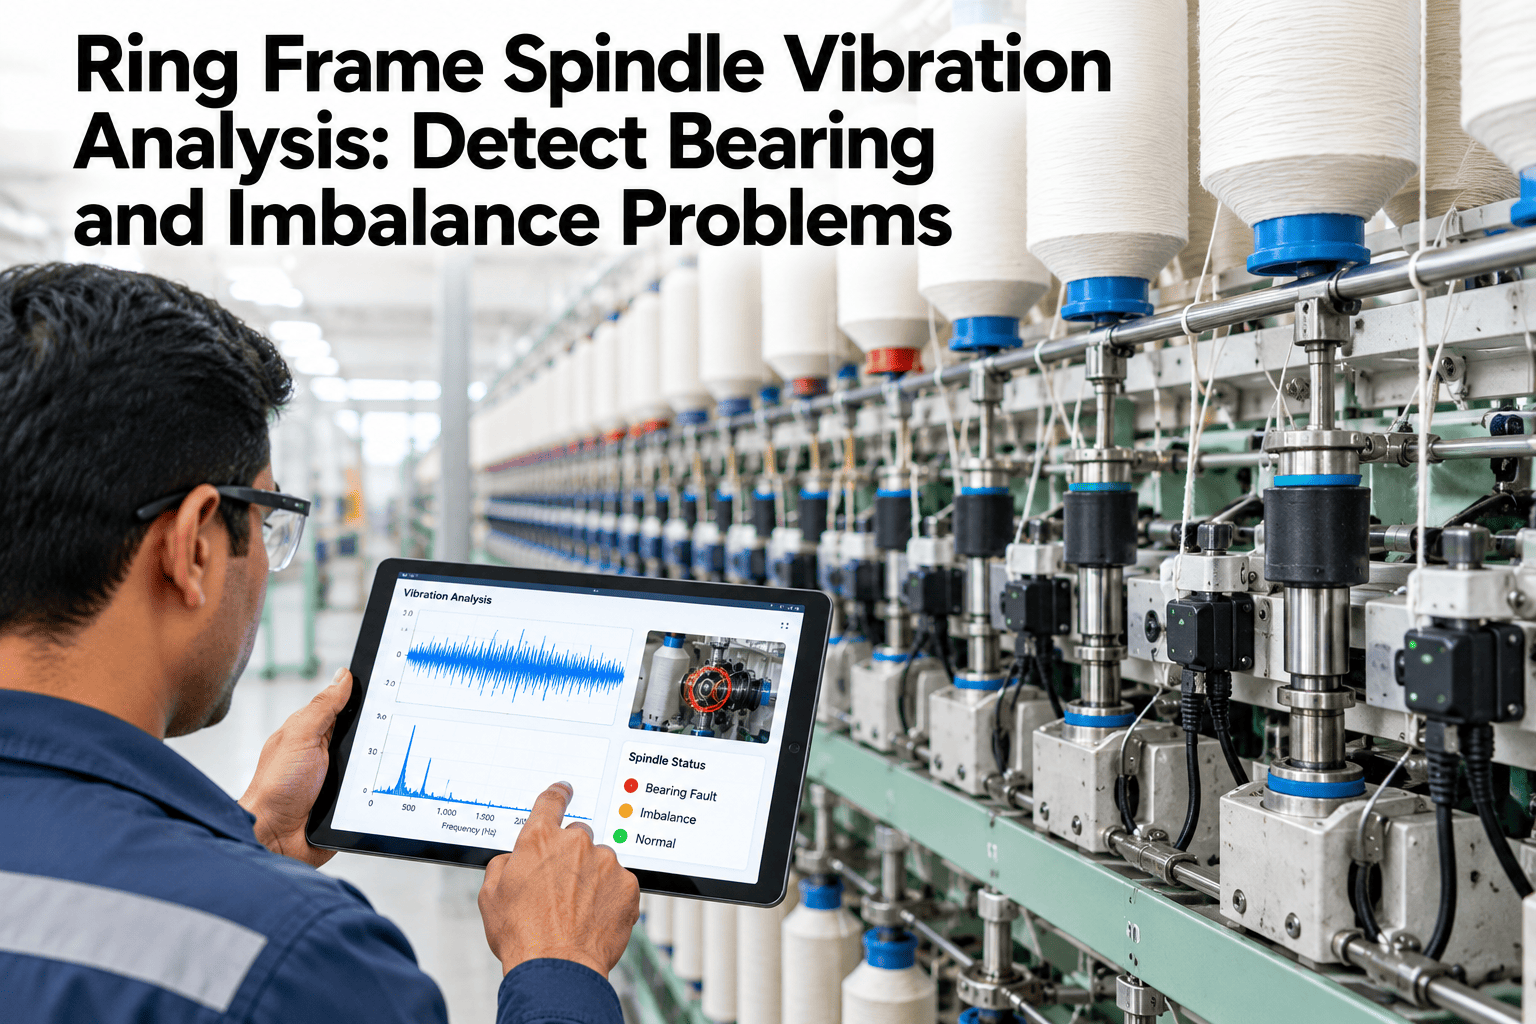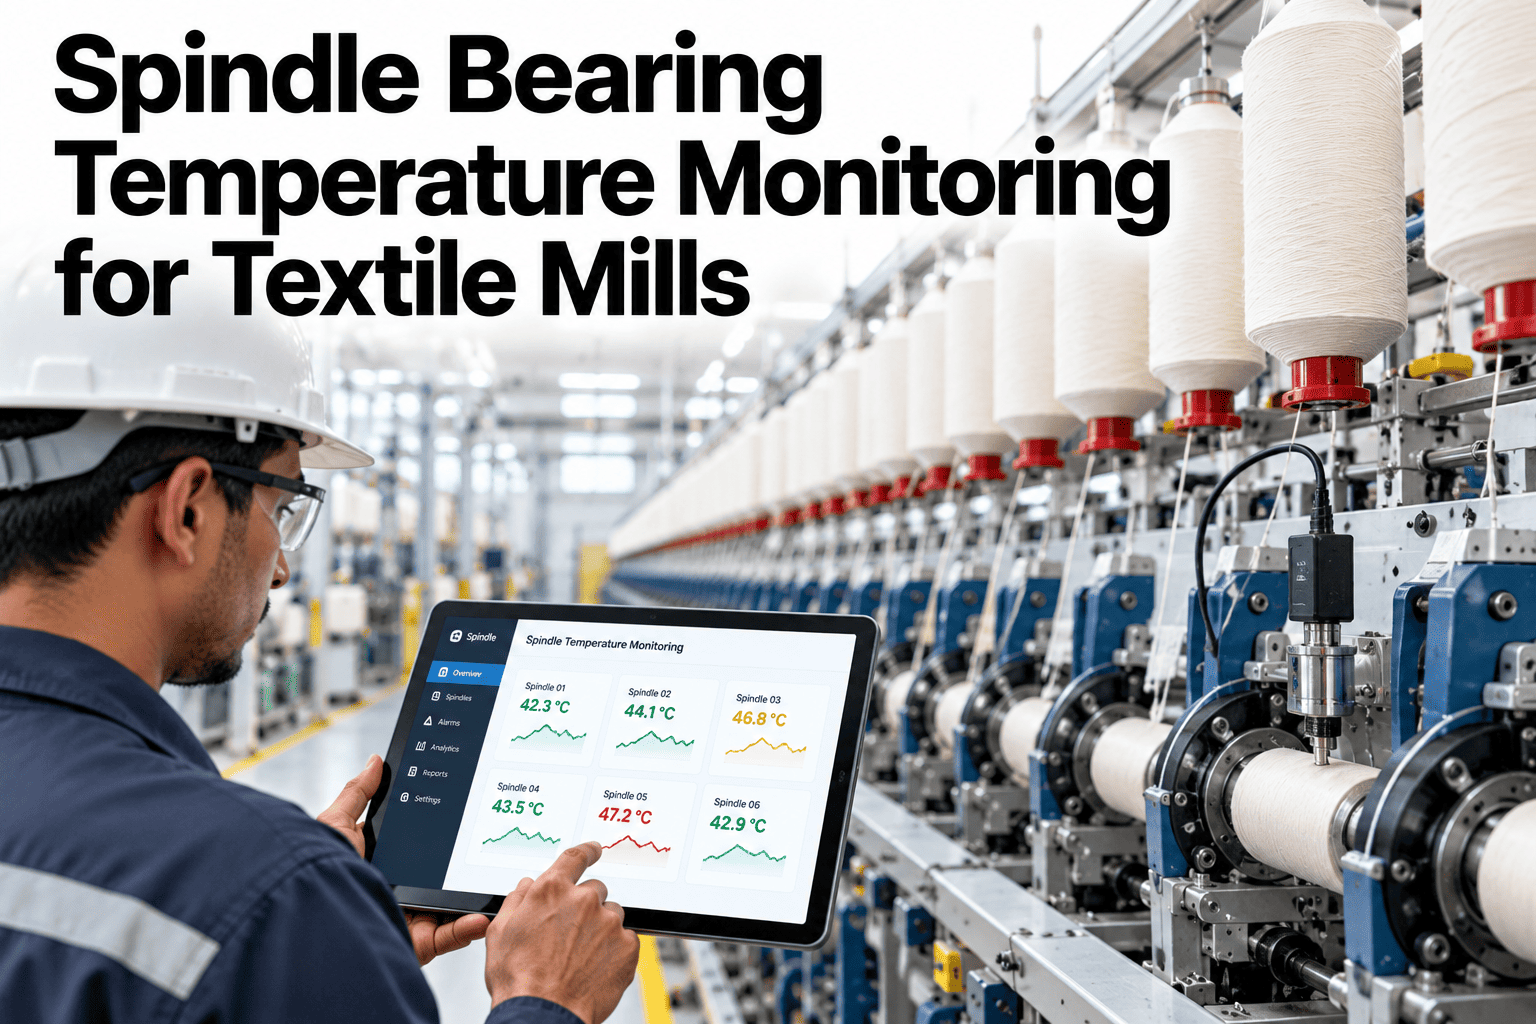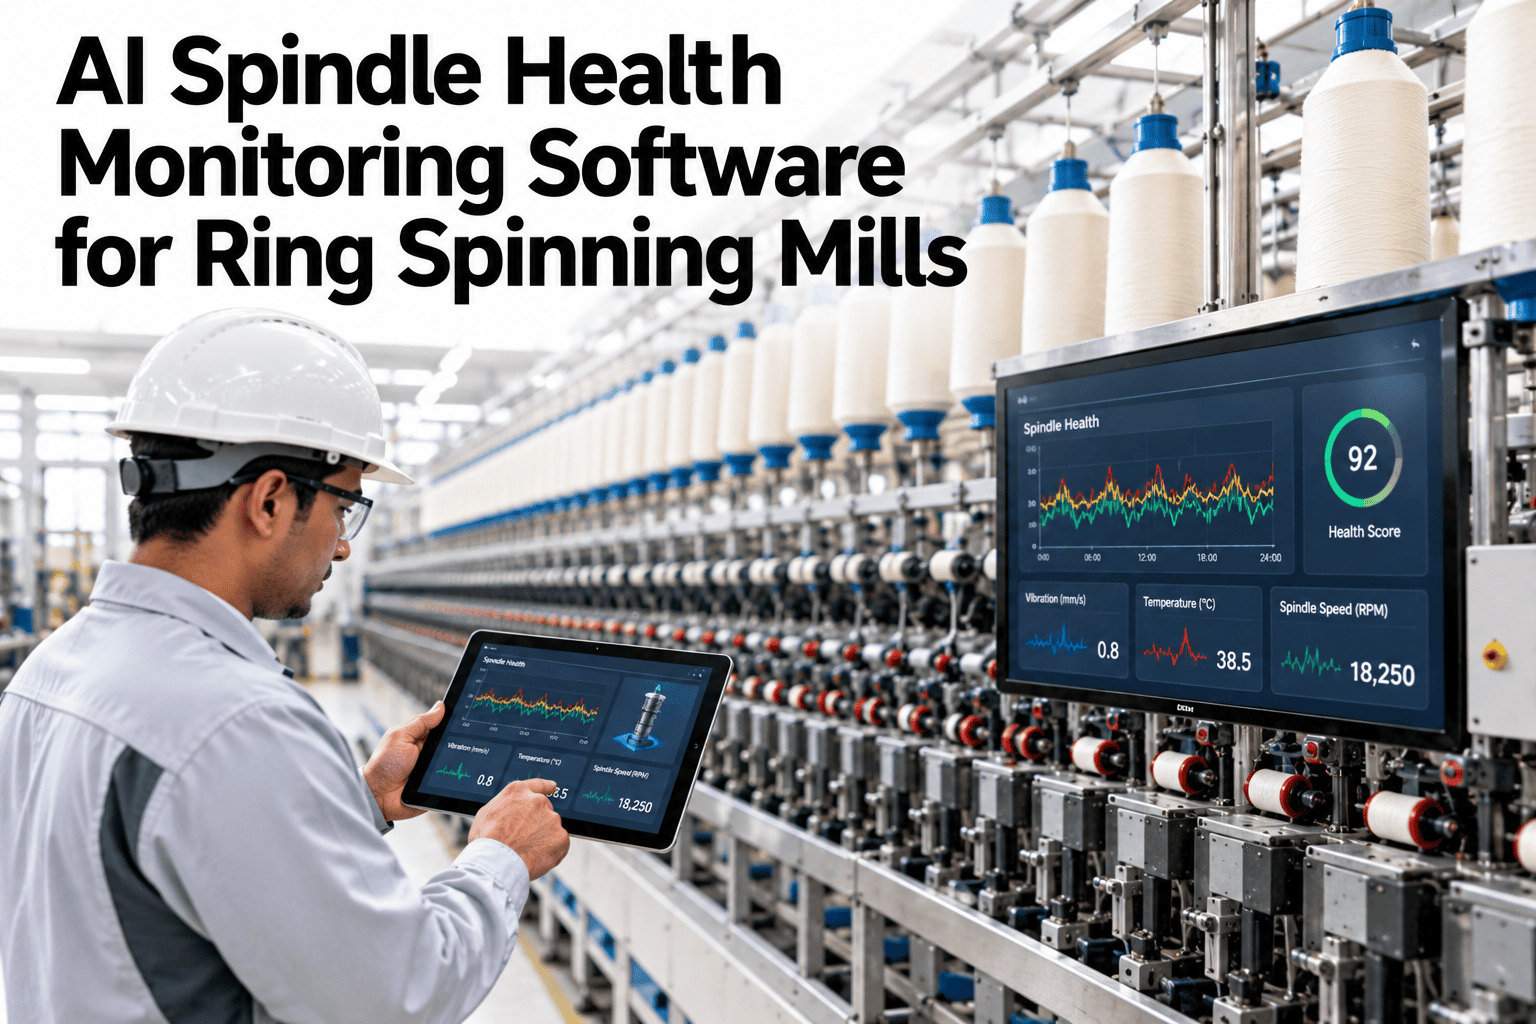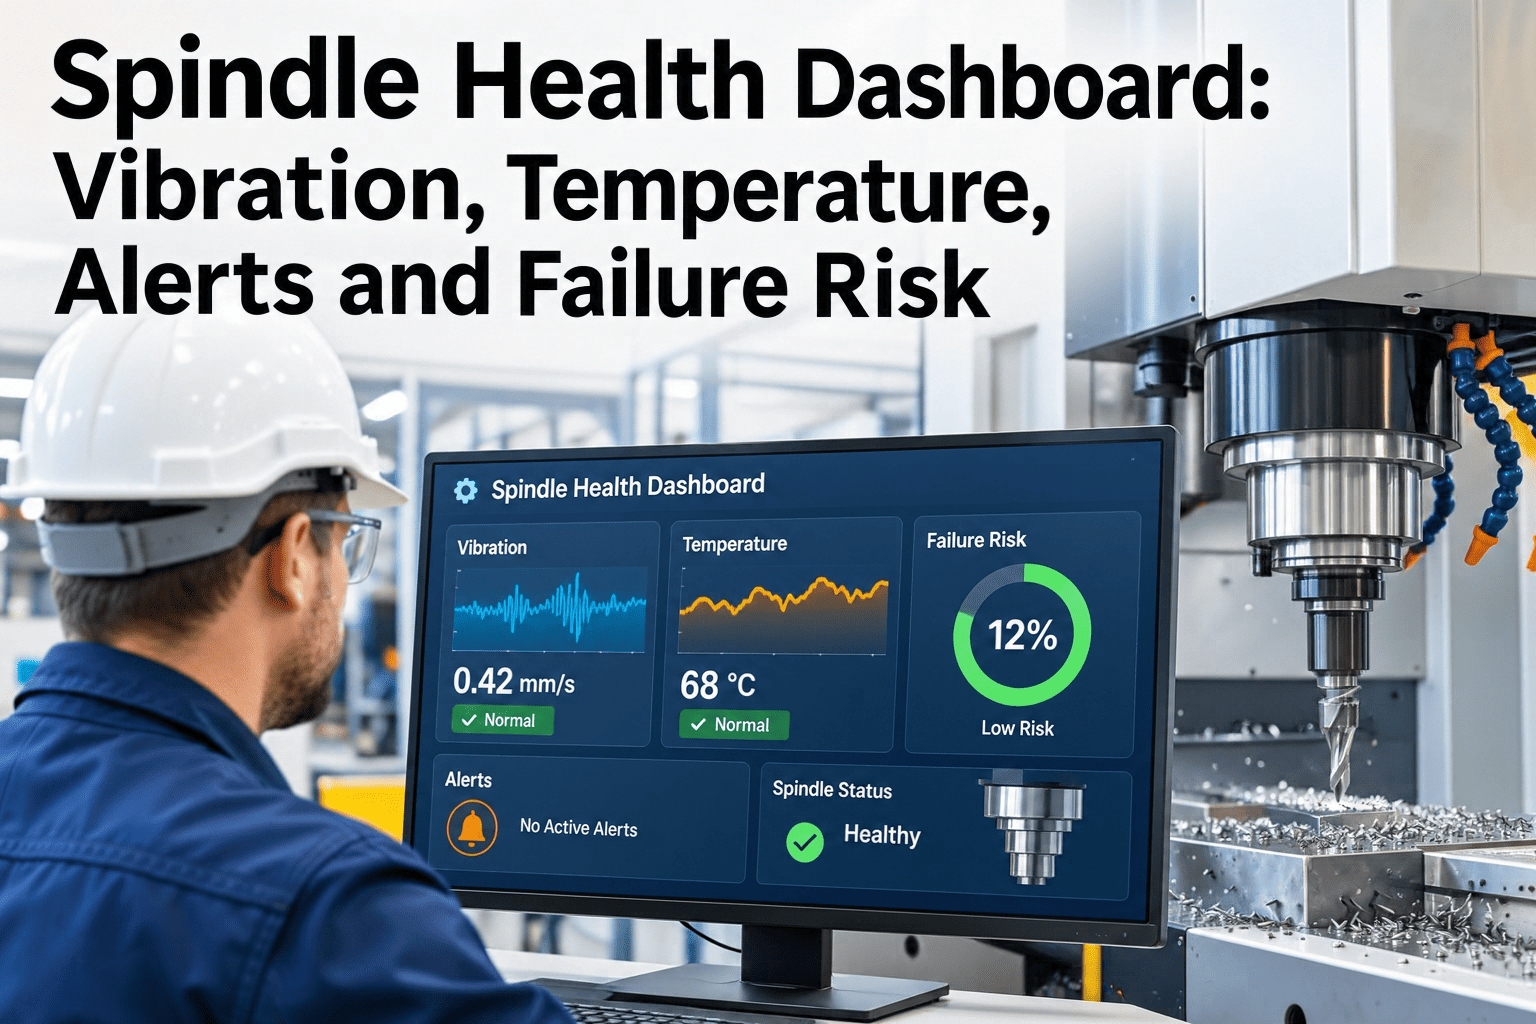
A spinning floor with 20,000 spindles across thirty ring frames generates more condition signals per shift than any maintenance team can manually track — yet most mills review spindle health only when a bearing seizes, a bolster overheats, or the break rate on a frame crosses a threshold that triggers a supervisor call. By then, the problem has been building for days. A spindle health dashboard centralises vibration trends, temperature readings, maintenance status and failure risk indicators across the entire fleet on one live screen — giving spinning teams the view they need to act on the spindle that is about to cause a problem, not the one that already has. iFactory AI, deployed on-premise on NVIDIA GPU servers inside the mill, builds this dashboard from the sensor, maintenance and production data the mill already holds. Teams that want to see it run on their own fleet can book a 30-minute walkthrough with our team.
See Every Spindle's Health Status — Before the Break Rate Tells You There's a Problem
iFactory AI centralises spindle vibration trends, temperature alerts, maintenance status and failure risk across your ring frame fleet on one live dashboard — updated every shift.
What Should a Spindle Health Dashboard Show?
A spindle health dashboard is not a realtime alarm panel — it is a fleet reliability view that combines multiple health signals per spindle into a single risk score, displayed at the right level of detail for the person using it. A maintenance technician needs spindle-position resolution; a spinning room supervisor needs frame-level summary; a plant manager needs a fleet health percentage.
The Four Health Indicators on the Dashboard
A reliable spindle health dashboard combines four indicator types. Each adds a different dimension of information; together they provide a failure risk picture no single signal can deliver.
Stop Reacting to Spindle Failures — Start Seeing Them Coming
iFactory AI builds the spindle health dashboard from your existing sensor, maintenance and production data — giving your spinning team a live fleet reliability view, updated every shift.
Alert Types and Response Priorities
Not all dashboard alerts require the same response speed. The dashboard organises alerts into three tiers — each with a defined response window and a default action — so maintenance teams know immediately how urgently to act without interpreting raw sensor values.
| Alert Tier | Trigger Condition | Colour | Response Window | Default Action |
|---|---|---|---|---|
| Critical | Vibration >3σ above baseline OR temperature >15°C above baseline OR risk score >80 | Red | This shift | Dispatch technician; check bearing; assess stop-or-run decision |
| Warning | Vibration 2–3σ above baseline OR temperature 8–15°C above baseline OR risk score 50–80 | Amber | Within 48 hours | Log inspection; schedule service at next planned downtime window |
| Maintenance due | Days since last service >80% of scheduled interval AND condition within normal range | Blue | Next planned window | Pre-schedule service; order consumables; note in shift plan |
| Healthy | All signals within baseline ± 1σ AND maintenance current | Green | Monitor only | No action — confirm in next scheduled inspection round |
What the Dashboard Changes in Daily Operations
The practical impact of a spindle health dashboard is felt in the morning shift briefing, not in a monthly maintenance review. When the supervisor opens the dashboard at shift start, the daily maintenance dispatch is a 2-minute conversation rather than a reactive scramble at 10:00 when the first bearing seizes.
Frequently Asked Questions
What sensors are needed to build the spindle health dashboard?
At minimum, vibration sensors on the spindle bearing and temperature probes on the bolster provide the two primary health signals. Where individual sensors are not installed, ring monitoring systems (Uster Sentinel, Rieter ISM) or frame-level vibration sensors provide aggregated signals that enable frame-level health scoring. Review your current sensor coverage in a session before any commitment.
Can the dashboard work for a mill with no existing spindle sensors?
Yes — the dashboard can start with break rate data and maintenance records as the initial health signals, with vibration and temperature sensors added progressively to the highest-risk frames first. iFactory AI identifies which frames most need sensor coverage based on historical break and failure patterns. Ask our team how a phased sensor rollout is planned for a fleet of your size.
How is the failure risk score calibrated for each mill?
The risk score is calibrated from the mill's own historical failure and maintenance data — so the thresholds reflect your specific spindle types, running speeds, and failure patterns rather than generic industry values. The calibration improves as more data accumulates. See how the calibration process works for a new installation in a live walkthrough.
Can the dashboard integrate with an existing CMMS for work order generation?
Yes. Critical and warning alerts can automatically generate a work order draft in the connected CMMS with the spindle position, alert type and recommended action pre-populated — removing the manual step between detection and dispatch. iFactory AI includes its own CMMS module for mills without an existing system. Ask about CMMS integration options for your existing platform.
How does the dashboard handle high-speed ring frames differently from standard-speed frames?
High-speed frames (above 18,000–20,000 rpm) produce higher bearing temperatures and vibration baselines at normal operation — so the alert thresholds are set per frame type, not across the whole fleet. A temperature that would be a warning on a standard frame may be normal on a high-speed frame running at 22,000 rpm. See how per-frame-type threshold calibration is configured.
Give Your Spinning Team the Fleet Reliability View They Need at Shift Start
iFactory AI builds the spindle health dashboard from vibration, temperature, maintenance and production data — updated every shift, actionable before the first bearing seizes. Book a session built around your ring frame fleet.