Every kilogram of fiber that leaves a spinning mill as waste instead of yarn was already paid for at full raw material price, which makes waste percentage one of the few metrics that translates directly into a rupee figure on the cost sheet without any modeling required. Most mills know their overall waste percentage but few can say with confidence how much of that waste was genuinely unavoidable versus how much came from a process fault that quietly crept in over several weeks. See how waste stream tracking connects to real recovery opportunity with Book a Demo.
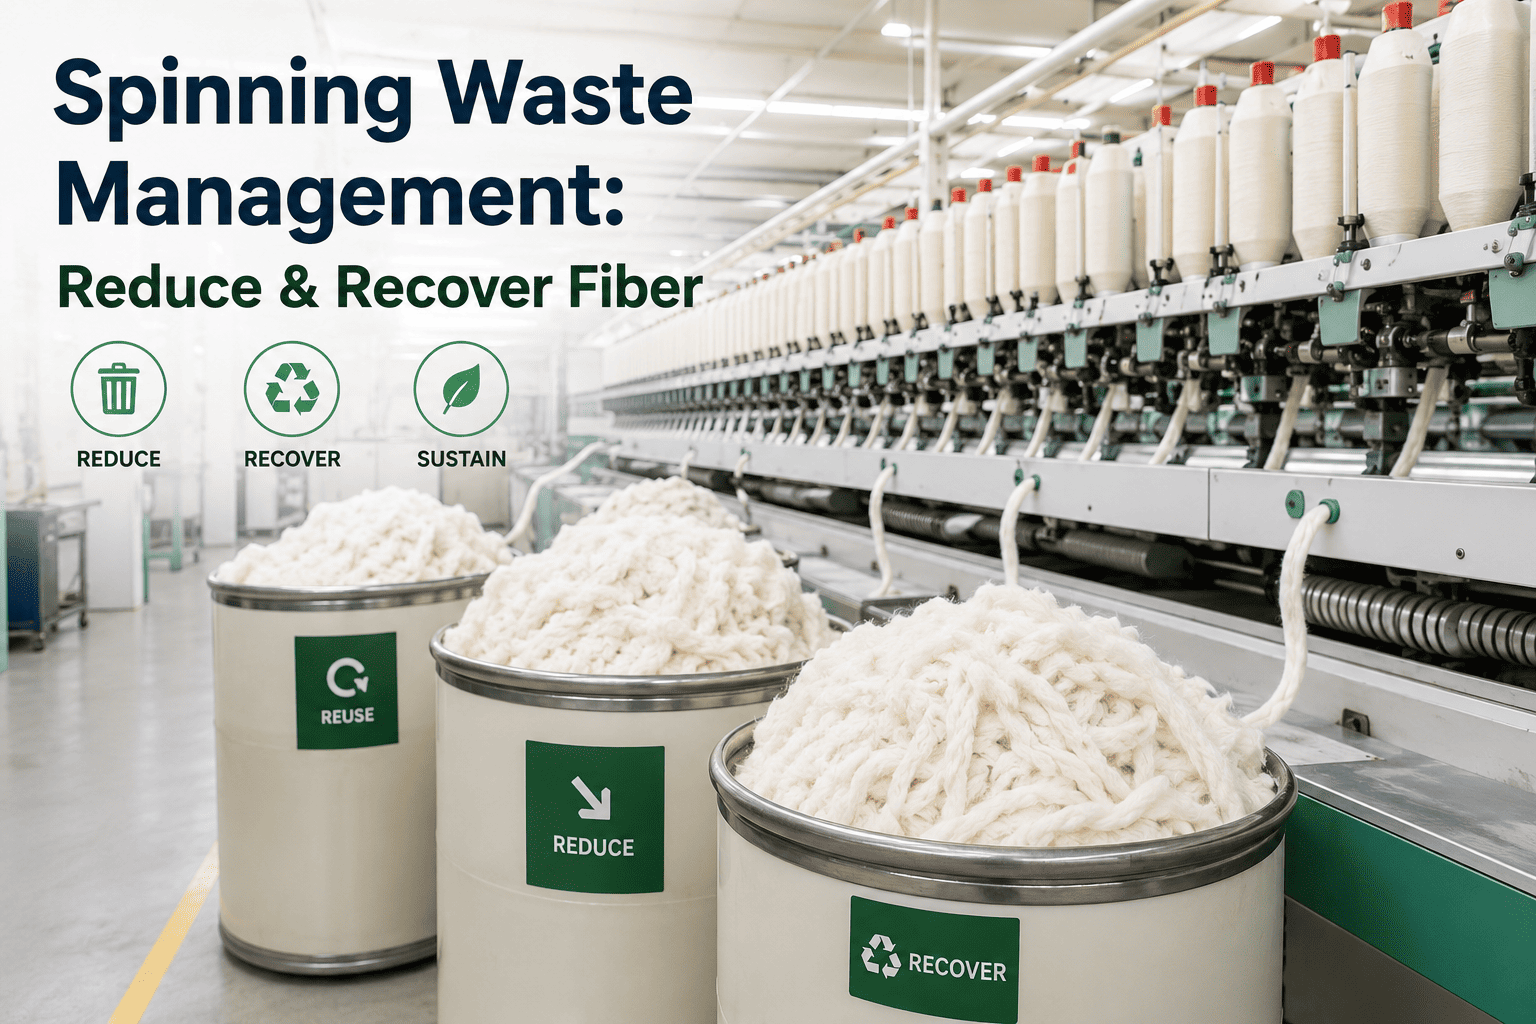
Spinning Waste Management: Reduce & Recover Fiber
A structured look at hard waste, soft waste, and usable waste streams across the spinning process, with benchmark percentages and where recovery effort actually pays off.
The Waste Stream, Traced From Blow Room to Winding
Waste is generated at every stage of the spinning process, but not all of it carries the same recovery value. Tracing where each stream originates is the first step to deciding where reduction effort belongs.
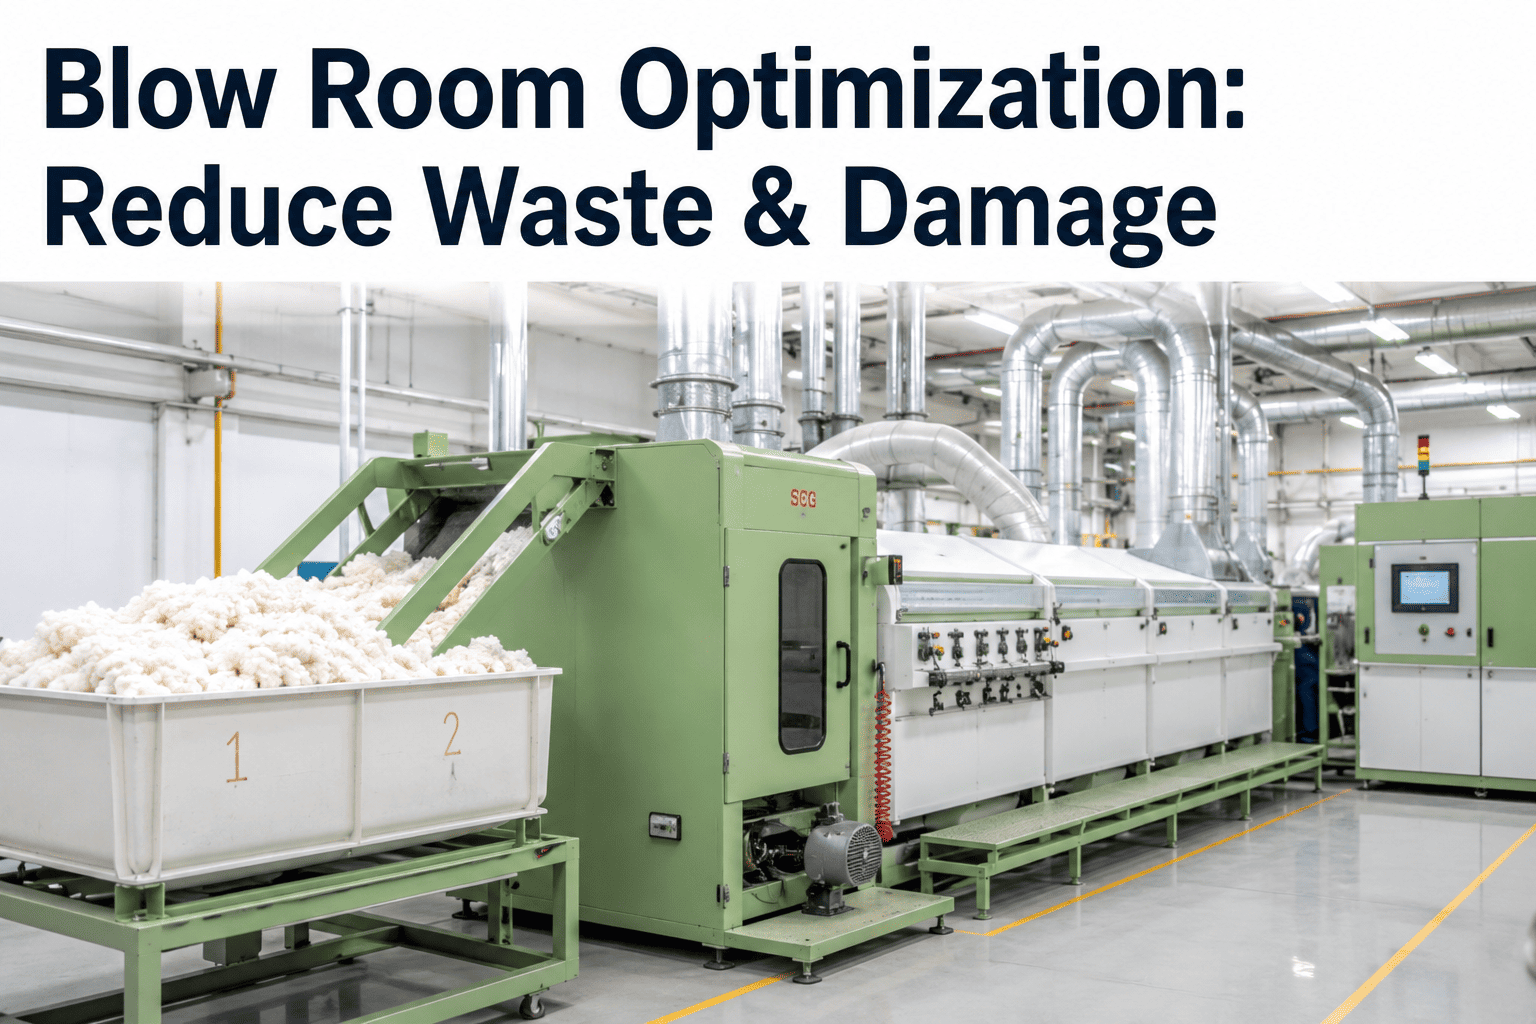
Blow Room
Trash, dust, and short fiber removed during opening and cleaning. Largest single waste-generating stage by volume.
Carding
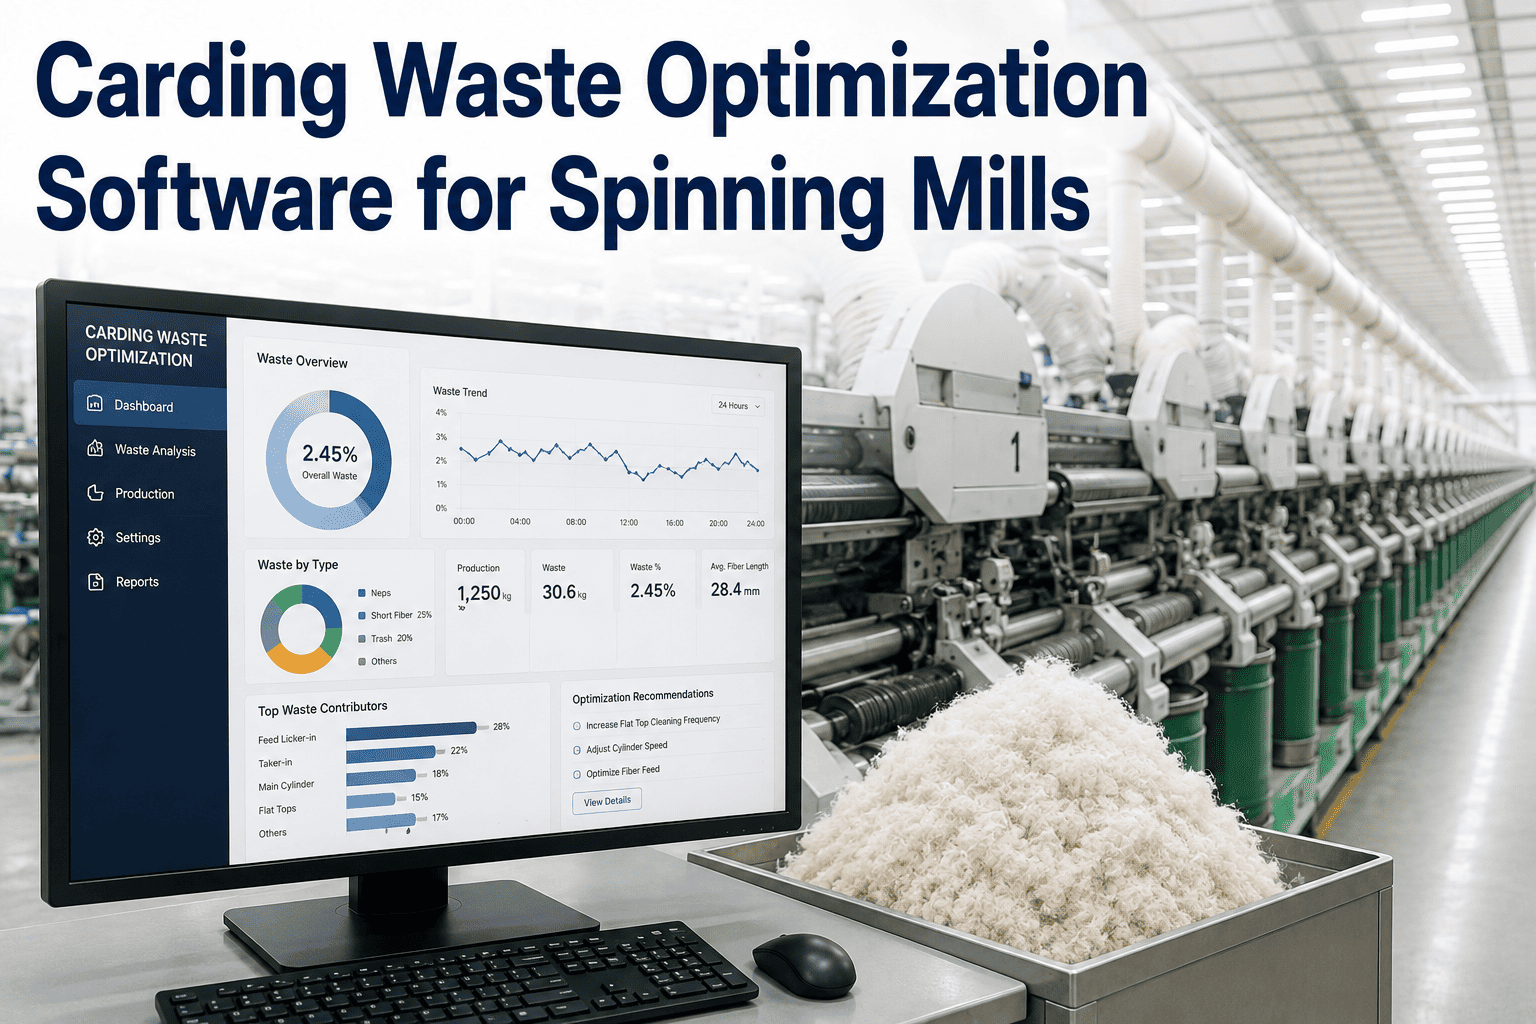
Card fly, flat strips, and licker-in waste. Contains recoverable fiber alongside genuine trash content.
Draw & Roving
Sliver and roving breaks, lap formations, and start-up waste. Mostly usable fiber lost to process interruption.
Ring Spinning
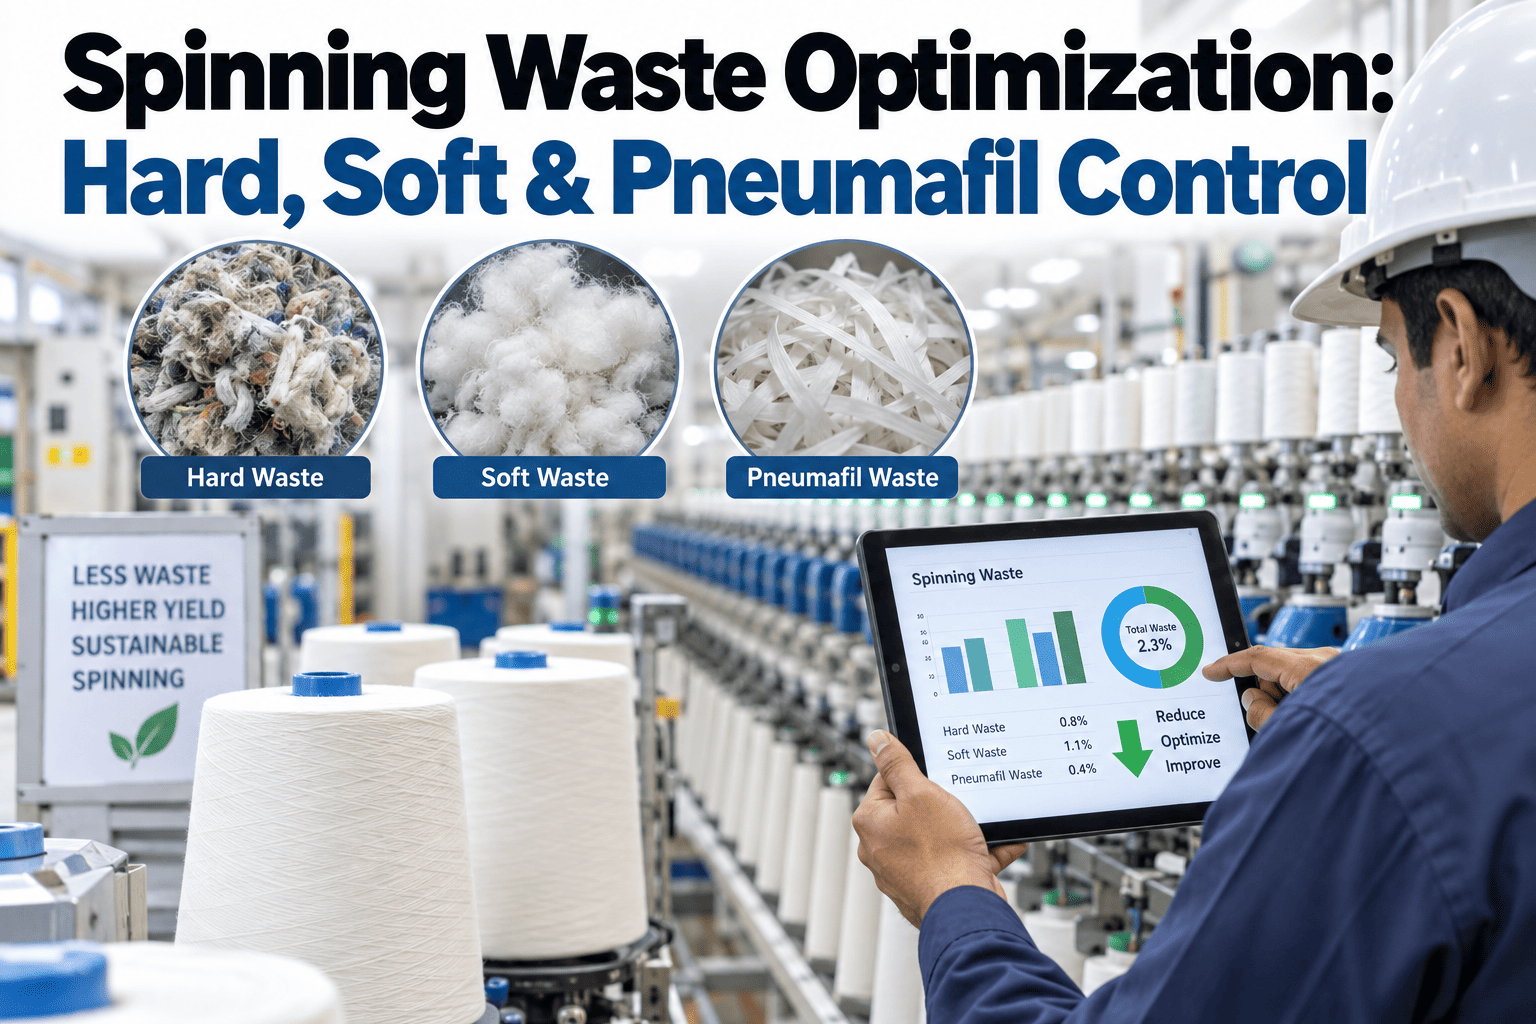
End break waste, pneumafil waste, and doffing residue. Highest recovery value per kilogram among all waste streams.
See Exactly Where Recoverable Fiber Is Being Lost
See automated waste stream tracking that separates avoidable loss from genuine process waste.
Hard Waste, Soft Waste, and Usable Waste Are Not the Same Problem
Hard Waste
Contaminated fiber, heavily entangled trash, and material unfit for reprocessing into yarn. Typically sold to secondary industries at low value.
Soft Waste
Clean fiber lost through breaks, doffing, and pneumafil collection. Retains enough quality to reprocess into coarser counts or nonwoven applications.
Usable Waste
Sliver and roving lap or start-up material still intact enough to feed directly back into an earlier process stage with minimal reprocessing.
Typical Waste Percentage Benchmarks by Process Stage
| Process Stage | Typical Waste % | Recoverable Share | Primary Waste Type |
|---|---|---|---|
| Blow Room | 3.5–5.0% | Low | Trash, dust, short fiber |
| Carding | 2.5–4.0% | Moderate | Card fly, flat strips |
| Draw Frame / Roving | 0.5–1.5% | High | Sliver and roving breaks |
| Ring Spinning | 2.0–3.5% | High | End breaks, pneumafil waste |
Where Waste Reduction Effort Delivers the Fastest Return
Ring frame end breaks are usually the highest-value target, since every break produces both waste fiber and lost production time simultaneously.
Roving and sliver breaks at the draw frame carry high recovery value because the fiber is nearly finished-grade at the point it becomes waste.
Blow room waste percentage is largely a function of raw fiber trash content, making it the hardest stream to reduce without changing fiber sourcing.
Tracking waste percentage by shift and machine, rather than as a single mill-wide average, reveals which specific positions are driving the total.
Frequently Asked Questions
Q: What is considered a healthy total waste percentage for a cotton spinning mill?
Total waste percentage across all stages typically falls between 8 and 12 percent for a well-run cotton spinning mill, though the exact figure depends heavily on raw fiber trash content and the count range being produced. Finer counts generally run somewhat higher waste percentages due to more aggressive cleaning and drafting requirements, while coarser counts tend to run lower. Comparing a mill's waste percentage against a fixed industry number is less useful than tracking the mill's own trend over time. Ask about waste stream benchmarking with Book a Demo.
Q: How is soft waste different from hard waste in terms of resale value?
Soft waste retains enough fiber length and cleanliness to be reprocessed into coarser-count yarn or used in nonwoven manufacturing, which gives it meaningfully higher resale value than hard waste. Hard waste, being heavily contaminated or fiber-damaged, is typically sold at a fraction of soft waste pricing to secondary industries with lower quality requirements. Because of this value gap, keeping soft waste properly separated and uncontaminated during collection directly affects how much a mill recovers from its waste stream.
Q: Why does ring frame end break waste carry higher recovery value than blow room waste?
Fiber lost at the ring frame has already passed through nearly the entire spinning process and retains its full fiber length and alignment, making it far closer to finished yarn quality than raw fiber trash removed at the blow room. This means ring frame waste can often be reprocessed with minimal quality loss, while blow room waste is predominantly genuine trash and short fiber with limited reprocessing potential regardless of how it is handled. Reach out through Support Contact to review waste stream classification for your mill.
Q: Can waste percentage be reduced without investing in new machinery?
Yes, in most mills a meaningful share of waste reduction comes from process discipline rather than capital investment, particularly around minimizing end breaks through better traveller selection, humidity control, and roller maintenance. Reducing the frequency of machine stoppages and restarts, which generate disproportionate waste relative to running time, is another lever that does not require new equipment. Machinery investment tends to matter more for reducing blow room and carding waste, where cleaning efficiency is more directly tied to equipment capability.
Q: How often should waste percentage be tracked to catch a process problem early?
Daily tracking by machine and shift is generally sufficient to catch a sustained upward trend before it becomes a significant cost, though catching a sudden spike from a specific fault benefits from more frequent or continuous monitoring. A gradual creep in waste percentage over several weeks is easy to miss in a monthly summary report but obvious when viewed as a daily trend line against a stable baseline. This is one of the more common gaps between what a mill's monthly cost report shows and what was actually happening on the floor in real time.
Turn Waste Percentage Into an Actionable Trend
See how continuous waste stream tracking helps separate avoidable loss from unavoidable process waste.