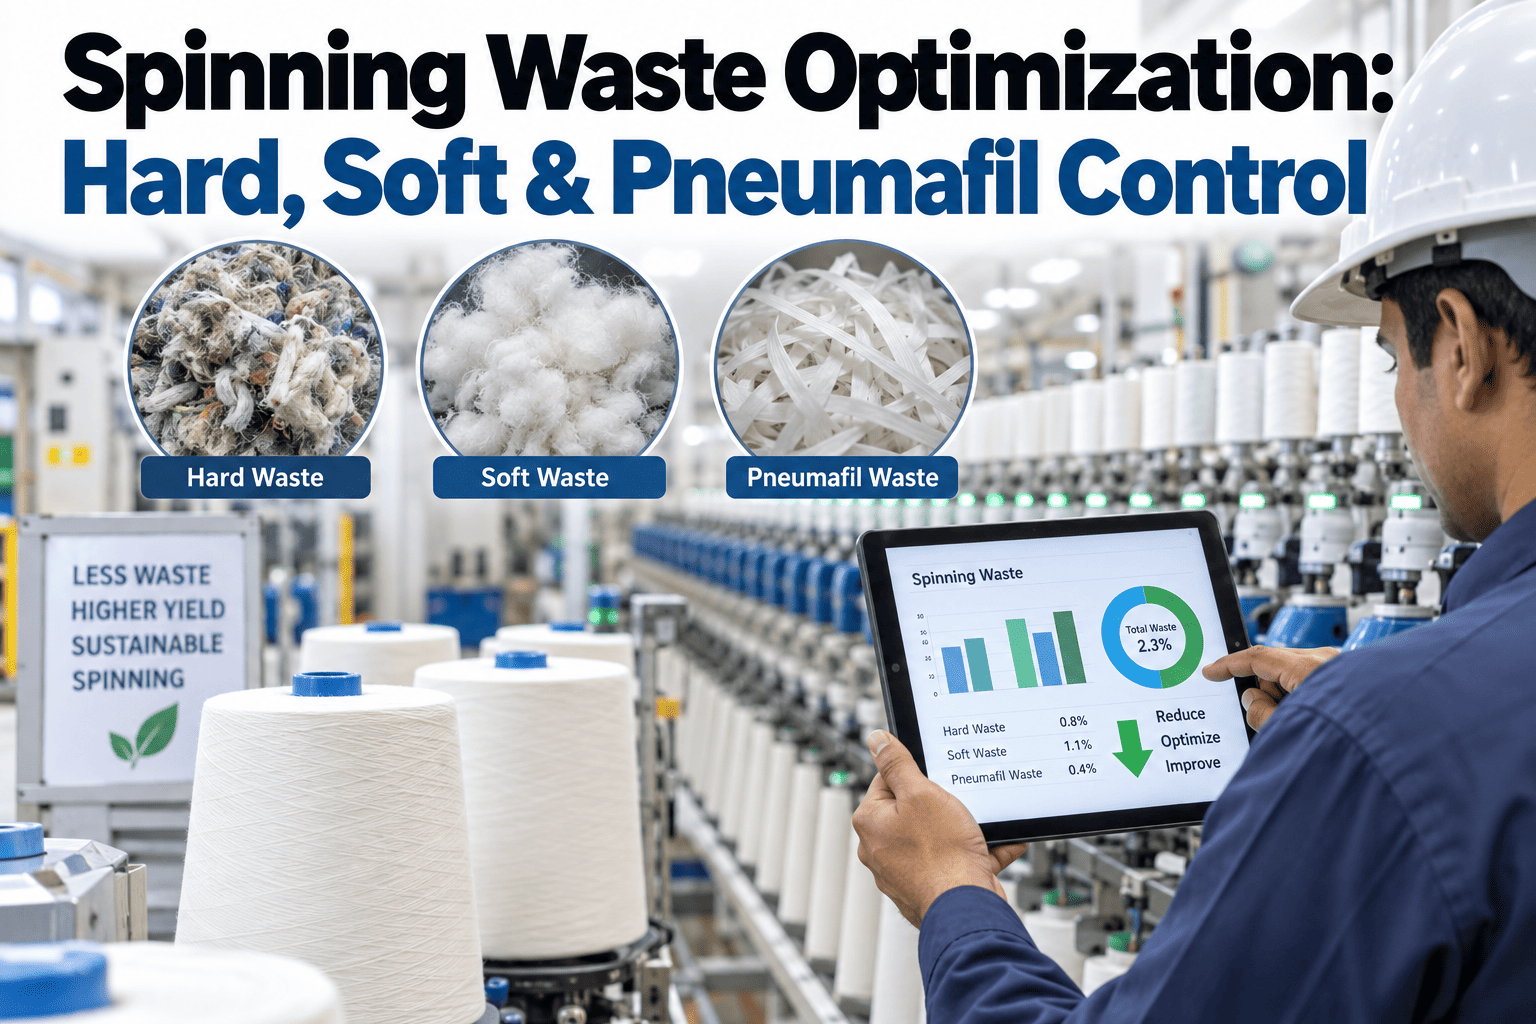
Spinning waste gets tracked as a single blended percentage at most mills, a number that goes into the monthly report and rarely gets questioned as long as it stays roughly where it has always been. That single number hides three fundamentally different waste streams with completely different causes, different recovery values, and different improvement levers: hard waste from breaks in roving and sliver, soft waste from carding and combing operations, and pneumafil waste collected through the pneumatic fiber collection system. Because all three roll up into one figure, a genuine deterioration in one category can be masked entirely by stable or improving performance in the other two, meaning a real problem can persist for months or years without anyone on the floor noticing it in the aggregate number. A mill running 4.2% total spinning waste might be running an efficient 1.1% hard waste alongside a genuinely excessive 2.4% soft waste that nobody has separately identified as the actual improvement opportunity. Breaking the blended number apart by category, setting a specific target for each, and tracking recovery value separately is what turns spinning waste from a static line item into a real cost reduction program. If your mill is still tracking spinning waste as a single number, you can book a demo to see how iFactory separates it automatically by category.
SPINNING WASTE · HARD, SOFT & PNEUMAFIL CONTROL
Separate Your Blended Waste Percentage Into Three Actionable Categories
iFactory tracks hard waste, soft waste, and pneumafil collection separately, with category-specific targets and recovery value, so improvement effort targets the actual biggest opportunity.
THE THREE WASTE CATEGORIES
Hard Waste, Soft Waste, and Pneumafil Each Need a Different Response
Each spinning waste category originates from a different point in the process and responds to a different type of intervention. Treating them as one number means a fix targeted at one category can look ineffective simply because it never touched the categories actually driving the blended total, which is a common source of frustration for process engineers who implement a genuinely effective fix for one category only to see the overall waste percentage barely move because a different, untouched category was the real driver all along.
HARD WASTE
Roving ends, sliver breaks, waste from ring frame and roving frame stops
Primarily a tension setting and mechanical maintenance issue, addressed through machine calibration and reducing break frequency.
SOFT WASTE
Card droppings, comber noil, cleaning waste from blow room and carding
Driven by raw material quality and process settings, addressed through fiber grade selection and carding parameter optimization.
PNEUMAFIL WASTE
Fiber collected through pneumatic suction systems at the ring frame
Reflects fly and loose fiber generation, addressed through humidity control and yarn tension consistency.
TARGET VS ACTUAL
Comparing Category-Specific Targets Against a Typical Underperforming Mill
The chart below illustrates how a blended total can mask meaningful variance at the category level, using a representative mill running above target in one category while performing well in the other two.
In this example, the blended total of 4.5% looks moderately over a 3.3% target, but the entire gap is concentrated in soft waste. A mill responding to the blended number alone would likely spread effort evenly across all three categories instead of focusing entirely on carding and fiber quality.
Find Out Which Waste Category Is Actually Driving Your Total
iFactory separates your spinning waste into hard, soft, and pneumafil categories automatically, showing exactly where the real opportunity is.
RECOVERY STRATEGIES
What Can Actually Be Recovered From Each Waste Category
Not all spinning waste has the same recovery potential. Understanding what can realistically be reprocessed or resold changes the true net cost of each category and should factor into which improvement projects get prioritized first. A category with high recovery value but poor generation control might actually represent a smaller net cost opportunity than a category with lower generation volume but almost no recovery value at all, which is why net cost after recovery, rather than raw generation percentage, is ultimately the more useful figure for prioritization.
Hard Waste Recovery
Relatively clean and consistent in composition, hard waste is often reprocessable back into lower-grade yarn or sold to secondary spinning operations at meaningful recovery value.
Soft Waste Recovery
Comber noil in particular retains reasonable fiber value and is commonly sold into lower-count yarn production, while card droppings typically carry lower recovery value due to contamination.
Pneumafil Recovery
Generally the lowest recovery value category due to fiber degradation and contamination from the collection process, though some mills successfully divert a portion into nonwoven applications.
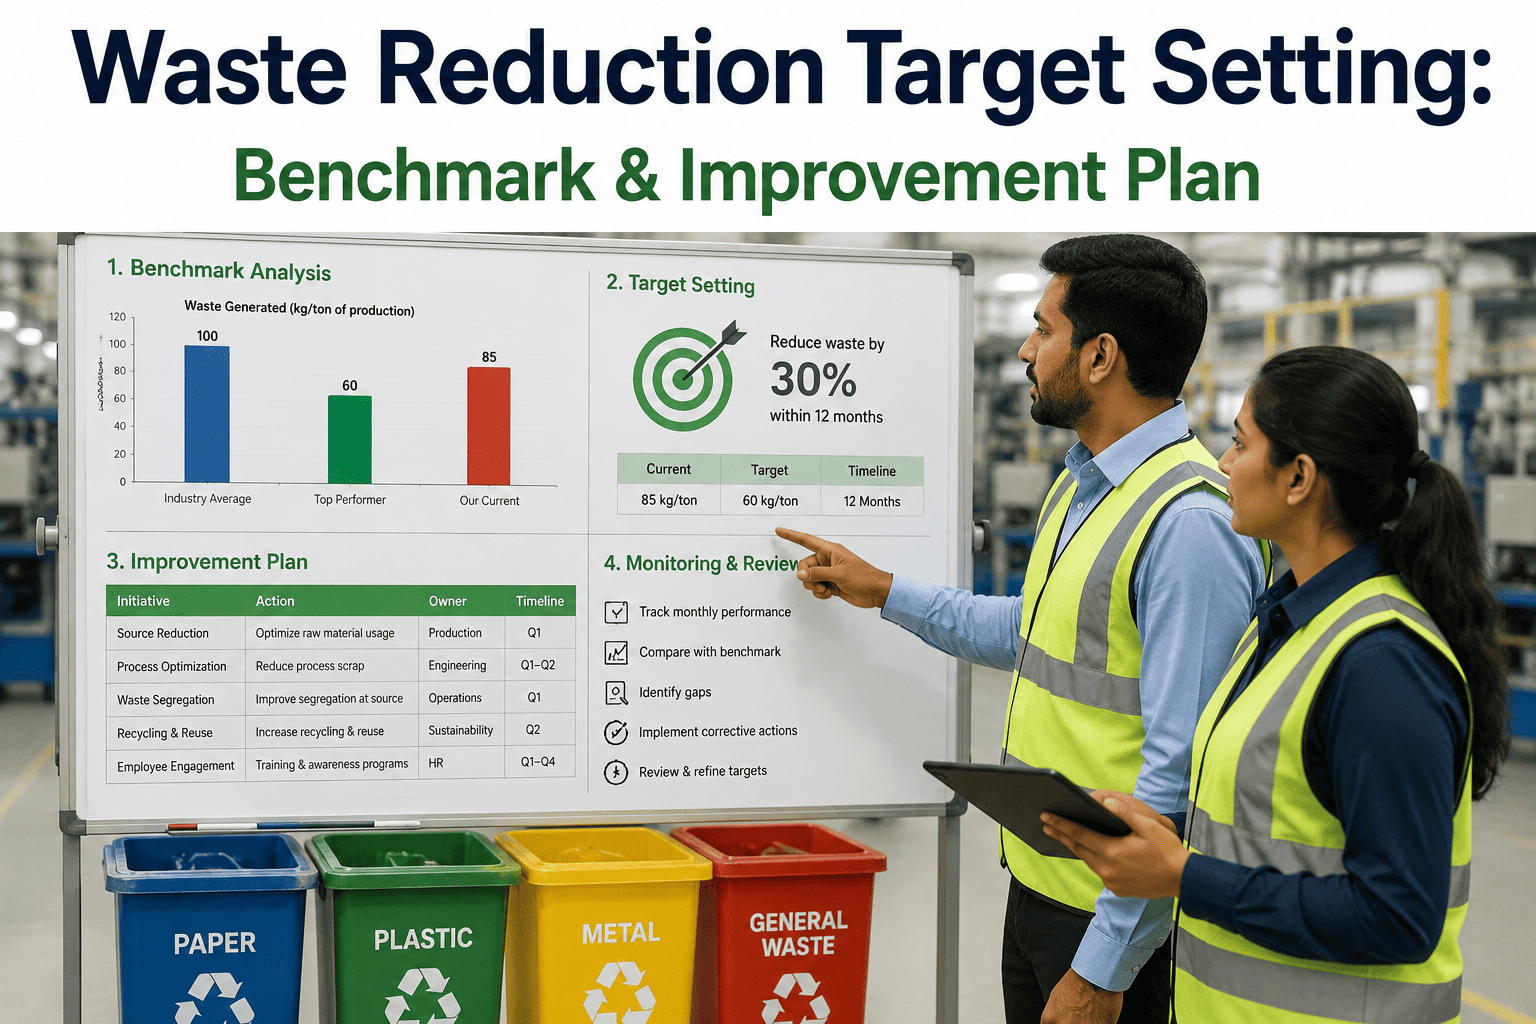
SETTING REALISTIC TARGETS
Building Category-Specific Waste Targets for Your Own Mill
Generic industry percentages provide a useful starting reference, but your specific fiber grade, yarn count mix, and equipment age all shift the realistic achievable target for each category. The steps below outline how to build targets grounded in your own operation.
Step 1
Separate Historical Data by Category
Pull existing waste records and split them into hard, soft, and pneumafil categories if they are not already tracked separately.
Step 2
Segment by Yarn Count and Fiber Grade
Waste rates vary meaningfully by count and fiber quality, so targets should be set within these segments rather than as one mill-wide figure.
Step 3
Benchmark Against Best-Performing Periods
Identify the lowest sustained waste rate your mill has achieved historically in each category as a proven, realistic target.
Step 4
Track and Adjust Quarterly
Revisit targets as fiber suppliers, count mix, or equipment condition change to keep them realistic over time.
FREQUENTLY ASKED QUESTIONS
Questions Spinning Mill Managers Ask About Waste Categorization
How is waste automatically categorized into hard, soft, and pneumafil without separate manual collection points?
Where a mill's existing waste collection infrastructure already separates these streams physically, which is common since hard waste, soft waste, and pneumafil are typically collected through different mechanical and pneumatic systems in the first place, categorization is largely a matter of connecting to the existing collection point data rather than building new physical separation. For mills where some categories are still combined at collection, a combination of process-stage attribution, since each waste type is generated at a specific, known point in the process, and periodic sampling to establish the typical split ratio provides a practical categorization approach without requiring a full physical rework of collection infrastructure.
Book a demo to review categorization for your specific collection setup.
Why is our soft waste percentage consistently higher than published industry benchmarks even after process adjustments?
Soft waste is heavily influenced by raw fiber quality and grade, meaning a mill running a lower-grade or more variable fiber input will structurally run higher soft waste than a mill running premium, consistent fiber, regardless of how well the carding process itself is tuned, so comparing against a generic industry benchmark without accounting for your specific fiber grade can create a misleading sense of underperformance. The more useful comparison is against your own mill's best-performing historical periods using the same or similar fiber grade, which controls for this variable and reveals whether there is genuine room for process improvement within your actual material constraints.
Contact support to build a fiber-grade-adjusted benchmark for your soft waste.
How much does humidity control actually affect pneumafil waste generation in practice?
Humidity has a measurable and often underappreciated effect on pneumafil waste, since fiber fly and loose fiber generation both increase in overly dry conditions where static and reduced fiber cohesion make fibers more prone to breaking free during the spinning process, meaning mills in climates or seasons with lower ambient humidity often see a corresponding rise in pneumafil waste that has nothing to do with machine settings or fiber quality. Tracking pneumafil waste alongside logged humidity data over a full seasonal cycle typically reveals this correlation clearly and can justify investment in humidification equipment where the seasonal swing is significant enough to matter financially.
Book a demo to see humidity correlation reporting for pneumafil waste.
Is it worth investing in better recovery and resale arrangements versus focusing purely on waste reduction?
Both levers matter and are not mutually exclusive, but the right balance depends on where your mill currently stands: a mill already running near its realistic waste generation floor for a given category will see more value from improving recovery arrangements for the waste that is unavoidably generated, while a mill running well above its achievable target has more room for value from actual waste reduction before recovery optimization becomes the more efficient use of effort. Most mills benefit from pursuing both simultaneously once categories and targets are clearly established, since recovery value calculations also help correctly prioritize which reduction projects deliver the best net financial return.
Contact support to evaluate the right balance for your current waste profile.
How quickly can category-specific tracking reveal a meaningful improvement opportunity?
Most mills identify their single largest category-level gap within the first two to four weeks of separated tracking, since even a short window of category-specific data is usually enough to reveal which of the three streams is running furthest above its realistic target, a pattern that a blended monthly percentage would have kept hidden indefinitely. Building the deeper segmentation by yarn count and fiber grade needed for the most precise targets takes longer, typically two to three months of production data across your normal count and fiber mix, but the initial category-level insight alone is usually enough to launch a first, well-targeted improvement project.
Book a demo to discuss a realistic timeline for your mill.
Stop Managing Spinning Waste as a Single Blended Number
iFactory separates hard, soft, and pneumafil waste automatically and tracks recovery value by category. Book a demo to see your own breakdown.