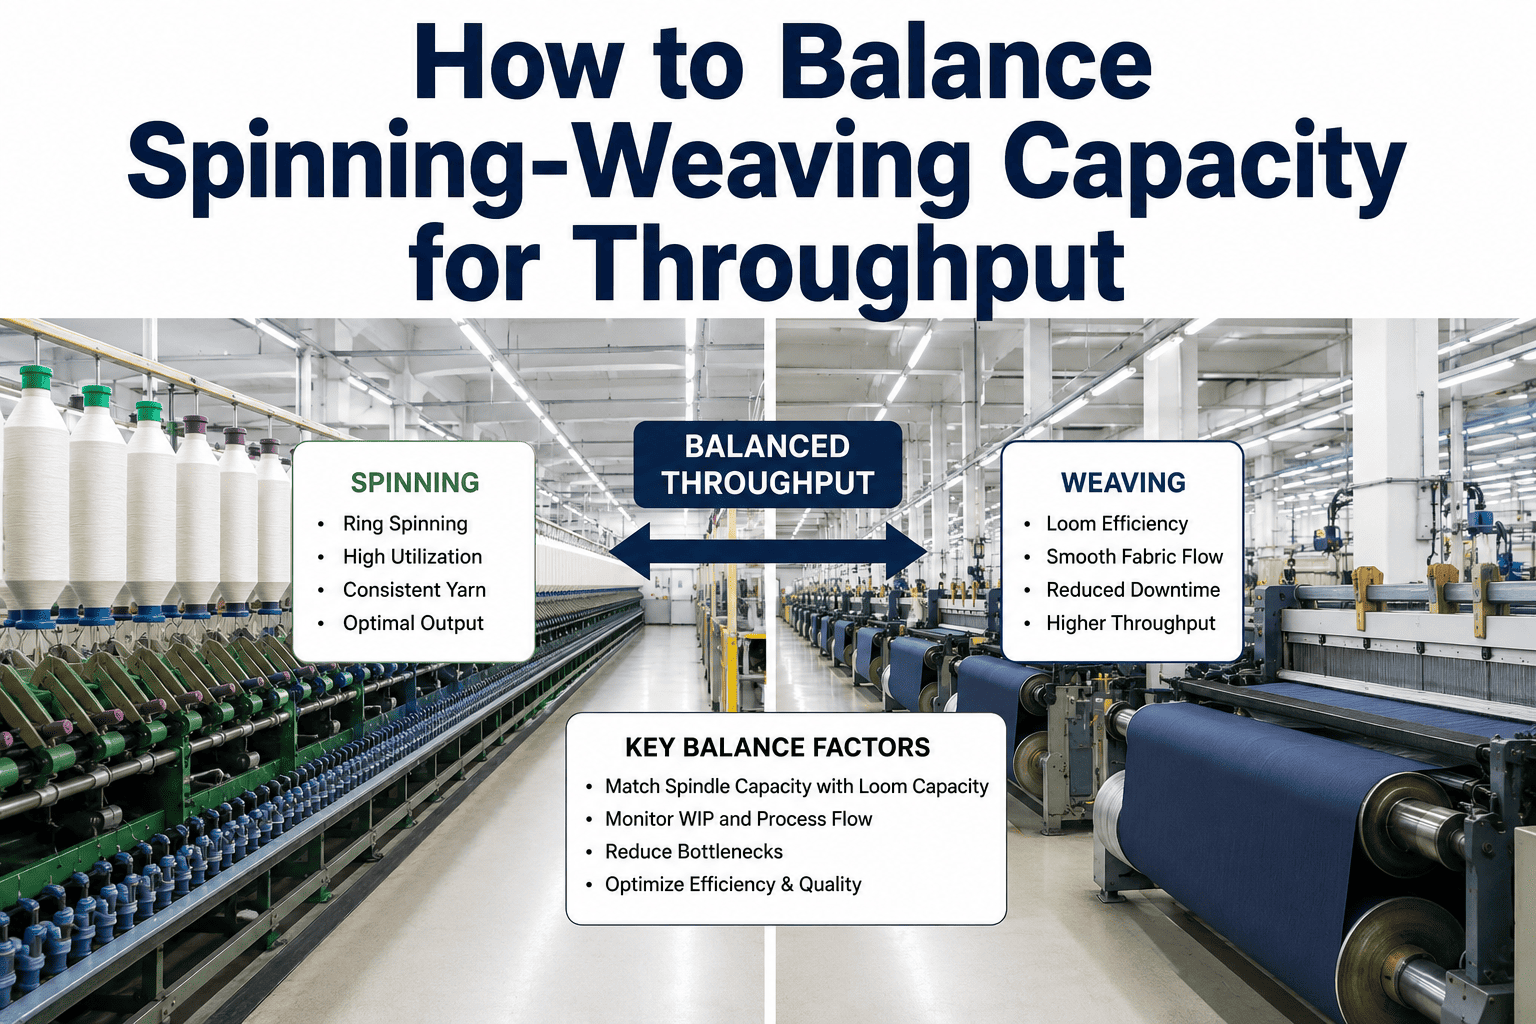
Spinning and weaving are the two departments most mills expand first, and they're also the two departments most likely to end up badly mismatched in capacity, because expansion decisions for each one tend to get made independently, on separate budgets, at separate times, against separate vendor proposals — with nobody stepping back to check whether the two production rates actually line up. A spinning department running meaningfully ahead of weaving's consumption rate builds yarn inventory that ties up working capital and risks quality drift while it sits in storage; a weaving department running ahead of spinning's supply rate sits starved, buying yarn externally at a cost premium to keep looms running. Getting this balance right isn't a one-time calculation — it shifts every time either department adds capacity, changes product mix, or experiences a yield change. This guide covers how to calculate matched throughput, how buffer inventory should be sized between the two departments, and how to plan expansion so the balance doesn't quietly drift out of sync. Mills managing spinning and weaving capacity together can book a 30-minute demo to see how iFactory tracks production rate alignment between departments in real time.
Spinning & Weaving Capacity Balancing — Throughput Matching
How to align spinning and weaving production rates, size the buffer inventory that absorbs normal variation between them, and plan expansion so the two departments don't quietly drift out of balance again.
Why These Two Departments Drift Out of Balance
Spinning and weaving expansion decisions typically happen independently — a spinning capacity addition gets approved based on yarn sales opportunity or fiber cost advantage, while a weaving capacity addition gets approved based on order book growth in fabric, and the two business cases rarely reference each other's timeline or capacity math directly. Over several rounds of independent expansion, small mismatches compound into a real imbalance that nobody deliberately created but that quietly costs the plant either excess yarn inventory or expensive external yarn purchases every month.
Calculating Matched Throughput
Total yarn output capacity across all spinning frames, adjusted for realistic utilization and count mix, expressed in a common unit like kilograms per day that can be directly compared against weaving's yarn consumption rate.
Total yarn consumption across all looms at realistic utilization, factoring in warp and weft requirements for the actual fabric constructions being run, since different constructions consume yarn at meaningfully different rates.
Spinning output should sit modestly above weaving consumption — enough to build a small buffer and absorb normal variation, but not so far above that yarn inventory accumulates faster than weaving can realistically draw it down.
Sizing Buffer Inventory Correctly
Too little buffer
A weaving department with too little yarn buffer is exposed to any spinning disruption — a machine breakdown, a quality hold, a count changeover — immediately translating into loom downtime with no cushion to absorb the gap.
Too much buffer
Excess yarn inventory ties up working capital, occupies warehouse space, and creates its own quality risk if yarn sits long enough to be affected by humidity, storage conditions, or simply falls out of the current production plan.
The right size
A buffer sized against actual historical spinning disruption frequency and duration — enough days of weaving consumption to cover a typical disruption window, reviewed periodically rather than set once and left unchanged for years.
Planning Expansion Without Losing Balance Again
| Expansion Scenario | Risk If Unmatched | Planning Approach |
|---|---|---|
| Adding spinning capacity only | Yarn inventory buildup, working capital tied up | Model weaving consumption growth alongside, not just yarn sales opportunity |
| Adding weaving capacity only | Yarn shortage, reliance on costlier external purchase | Confirm spinning has headroom or plan matched spinning expansion in parallel |
| Product mix shift toward finer counts | Spinning output rate drops even at same machine count | Recalculate balance whenever count mix shifts materially |
| New fabric construction with higher yarn consumption | Weaving consumption rate rises even at same loom count | Model consumption rate by construction type before committing new fabric programs |
The most common planning mistake is treating spinning and weaving capacity expansion as two separate business decisions rather than one linked calculation — a matched throughput model should be a required input to either department's expansion business case, not an afterthought checked once the equipment is already on order.
Frequently Asked Questions
How can a mill tell if spinning and weaving are currently out of balance?
The clearest signal is a sustained trend in yarn inventory — steadily rising yarn stock points to spinning running ahead of weaving's consumption, while a shrinking yarn buffer or increasing reliance on external yarn purchase points to weaving running ahead of spinning's supply. A single week's data can be noisy, so this is best tracked as a multi-week trend rather than a snapshot, since normal day-to-day variation in either department can look like imbalance without actually being a structural mismatch. Contact iFactory Support for help setting up yarn inventory trend tracking between spinning and weaving.
Why does buffer inventory need to be resized periodically rather than set once?
Buffer sizing depends on the actual historical frequency and duration of spinning disruptions, and that pattern changes over time as equipment ages, maintenance practices evolve, or product mix shifts change how often changeovers happen. A buffer sized correctly five years ago based on the disruption pattern at that time may be significantly oversized or undersized for the plant's current reliability profile, which is why buffer levels should be reviewed against recent disruption data rather than left at their original setting indefinitely.
Does a shift toward finer count yarns really change the spinning-weaving balance that much?
Yes — finer count yarns take meaningfully longer to spin per unit of weight than coarser counts on the same equipment, which means a spinning department's effective output rate in kilograms per day can drop noticeably even with no change in machine count or utilization, simply because the product mix shifted toward finer counts. This is exactly the kind of change that can quietly move a previously balanced spinning-weaving relationship out of alignment without any deliberate expansion decision on either side. Book a demo to see how count mix changes affect matched throughput calculations.
Should a mill always add spinning and weaving capacity together in the same project?
Not necessarily together as a single project, but the two decisions should always reference the same matched throughput model so the mill knows going in whether an expansion in one department will create a temporary imbalance and for how long. Sometimes it makes business sense to add weaving capacity first and plan to buy yarn externally during a bridge period, or vice versa, as long as that bridge period and its cost are a deliberate, planned decision rather than an unplanned consequence discovered after the fact.
What's the cost of staying out of balance rather than fixing it?
An unbalanced relationship carries an ongoing cost either way — excess yarn inventory ties up working capital and adds storage and quality risk, while a yarn shortfall forces reliance on external yarn purchase, which is almost always more expensive per unit than internally spun yarn and can also introduce quality variation from a different source. Both failure modes are recurring monthly costs rather than one-time events, which is why fixing an identified imbalance typically pays back the correction cost fairly quickly. Contact iFactory Support for help quantifying the cost of a current spinning-weaving imbalance.
An imbalance nobody planned still costs money every single month.
iFactory tracks spinning output, weaving consumption, and buffer inventory levels together in real time, so a drift between the two departments shows up early instead of after months of accumulated cost. A 30-minute demo builds a live view against your own production data.