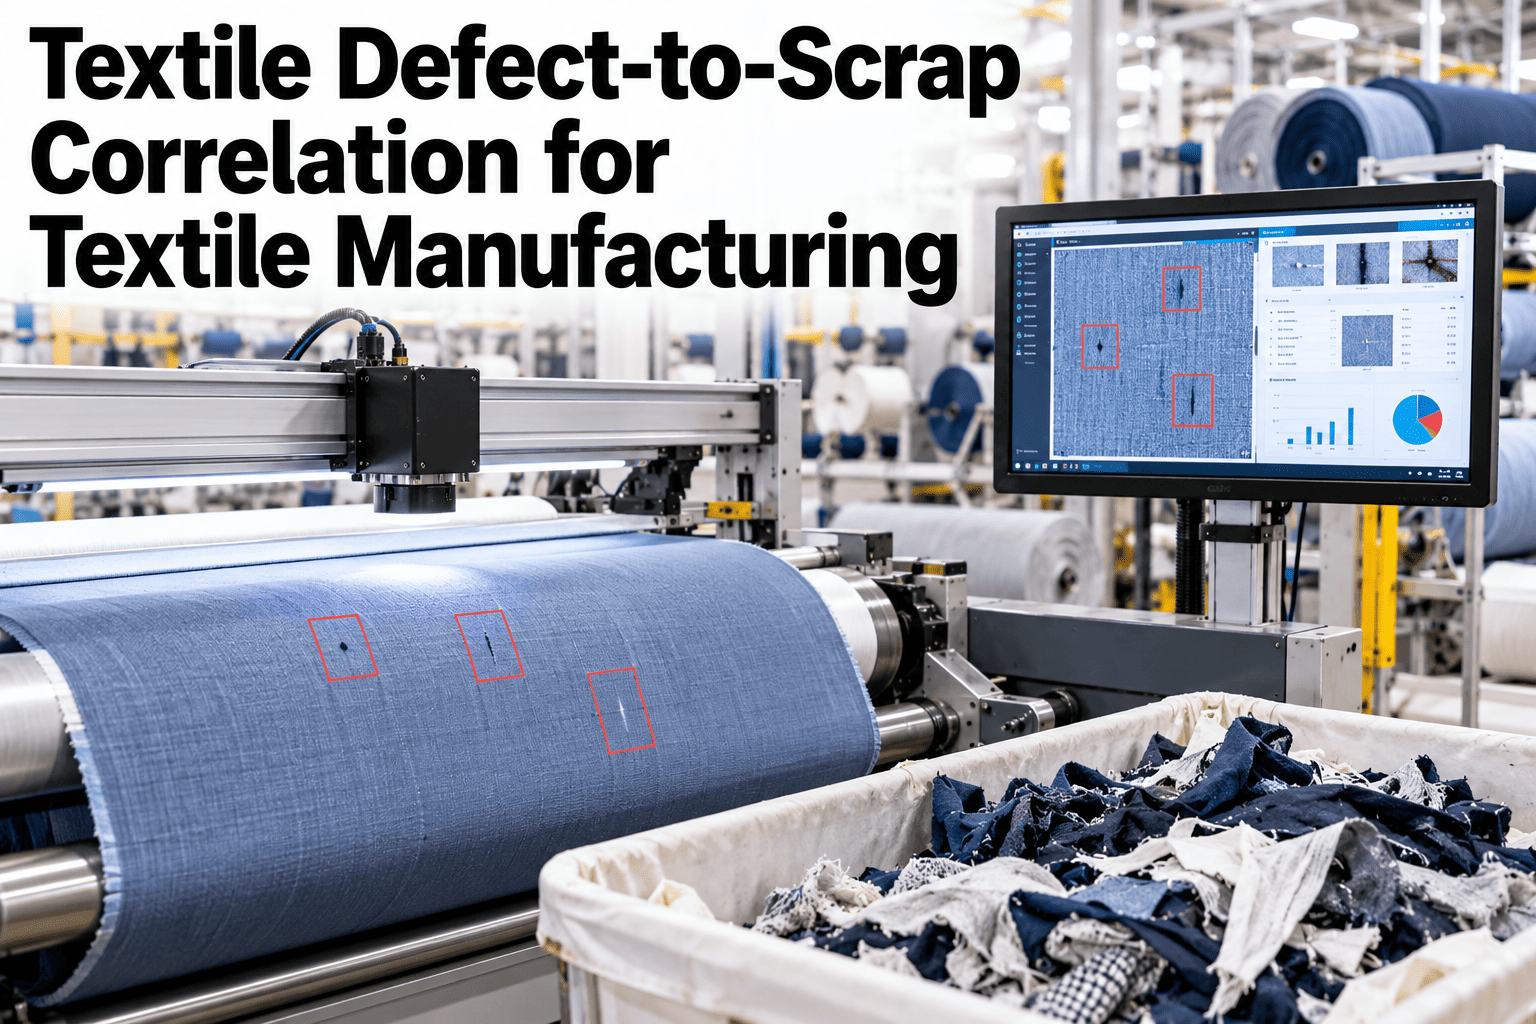
Counting defects and counting what they cost are two different exercises. A defect that happens often but is easily repaired barely hurts, while a rare one that sends a whole roll to scrap can dominate the quality cost. Defect-to-scrap correlation links each defect type to what happened to the fabric afterwards, repaired, downgraded or scrapped, so effort follows money instead of frequency. Teams who want that ranking can ask iFactory AI how defects are linked to scrap and material loss.
Rank Defects by What They Cost You in Scrap, Not by How Often They Occur
iFactory AI follows each defect to its outcome, so the defects that quietly turn fabric into scrap rise to the top of the list.
Where a Defect Goes After It Is Found
Finding a defect is only the first step. What happens next decides its cost.
The Three Outcomes and Their Cost
Each outcome has a different price. Counting them separately changes priorities.
Rework
Material is saved, but labour, machine time and delay are spent again.
Downgrade
Fabric is sold as a lower grade, losing part of its value.
Scrap
Material, time and margin are lost completely.
A Worked Example: When the Ranking Flips
This is illustrative arithmetic with a fixed cost of 100 units per scrapped roll.
| Defect | Occurrences | Share Scrapped | Scrap Cost |
|---|---|---|---|
| Barre | 120 | 10% | 1,200 |
| Holes | 40 | 60% | 2,400 |
| Oil stains | 60 | 35% | 2,100 |
| Uneven dyeing | 30 | 80% | 2,400 |
Count Versus Cost on One Chart
The chart shows the same defects ranked two ways. Look at how the order changes.
Find Out Which Defects Are Really Turning Fabric Into Scrap
Book a 30-minute session and iFactory AI will review your defect and scrap records to show how the ranking changes when cost, not count, is the measure.
Which Defects Tend to End Up Where
The matrix, shown as an illustration, links typical defect families to their usual outcome.
| Defect Family | Rework | Downgrade | Scrap |
|---|---|---|---|
| Minor surface marks and slubs | High | Moderate | Low |
| Barre and shade variation | Low | High | Moderate |
| Holes and runs | Moderate | Low | High |
| Oil and stains | High | Moderate | Moderate |
| Weight and width out of tolerance | Low | Moderate | High |
Counting Defects or Counting Cost
Both views matter, but they answer different questions.
Building the Correlation in Five Steps
A first version works with data most mills already hold.
Log each defect with type, position and roll.
Record the disposition for every defective roll.
Attach material and handling cost to each outcome.
List defects by total cost, not by count.
Pick the top one and assign an owner and a target.
Defect Cost Checklist
Use this list when building or reviewing your ranking. Each box should be answerable from records.
A Composite Scenario: The Quiet Costly Defect
This is a composite example, not a named mill. It shows how cost ranking redirects effort.
Mistakes in Defect-to-Scrap Analysis
These habits distort the ranking.
Ranking only by count
Frequent but cheap defects dominate.
Not recording the disposition
The cost cannot be attached.
Ignoring rework cost
The biggest hidden cost goes unseen.
Using unagreed cost figures
Finance rejects the conclusion.
What iFactory AI Adds to Defect and Scrap Analysis
iFactory AI is smart manufacturing and industrial software for textile operations. Explore defect-to-scrap analytics in a live product tour on realistic data.
A 30-Day Plan to Start
A month is enough to build a first cost ranking for one product.
Review of Defect-to-Scrap Correlation
A practical review of what makes defect cost ranking useful, written as editorial guidance rather than a named expert quote.
Record the disposition
Without the outcome, a defect has no cost.
Agree costs with finance
A ranking finance trusts gets resourced.
Rank by cost, not count
The top defect by count is often not the costliest.
Frequently Asked Questions
What is defect-to-scrap correlation?
It is linking each defect type to what happened to the fabric afterwards, repair, downgrade or scrap, so defects can be ranked by cost. See the ranking built on live data in a short demo. It directs effort to what costs most.
Why rank defects by cost instead of count?
Frequent defects are not always costly, and rare ones can scrap whole rolls. Cost ranking shows where effort pays back. The order often changes completely.
What data do we need?
Defect type and position, the disposition of each defective roll, and agreed cost figures. Ask support what your existing records can already show before adding capture. Many mills hold most of it.
How do we include rework in the cost?
Estimate the labour, machine time and delay of a typical repair for each defect and apply it to every reworked roll. Agree the figures with finance. Rework is often the largest hidden cost.
How soon can we see a new ranking?
Many mills build a first cost ranking within a month on one product. Book time to scope a defect cost pilot with your quality and finance teams. A changed top defect is a powerful result.
Fix the Defects That Cost the Most, Not the Ones That Appear the Most
iFactory AI links every defect to its outcome and ranks them by cost, so quality effort follows money. Book a walkthrough to see it on your own defect data.