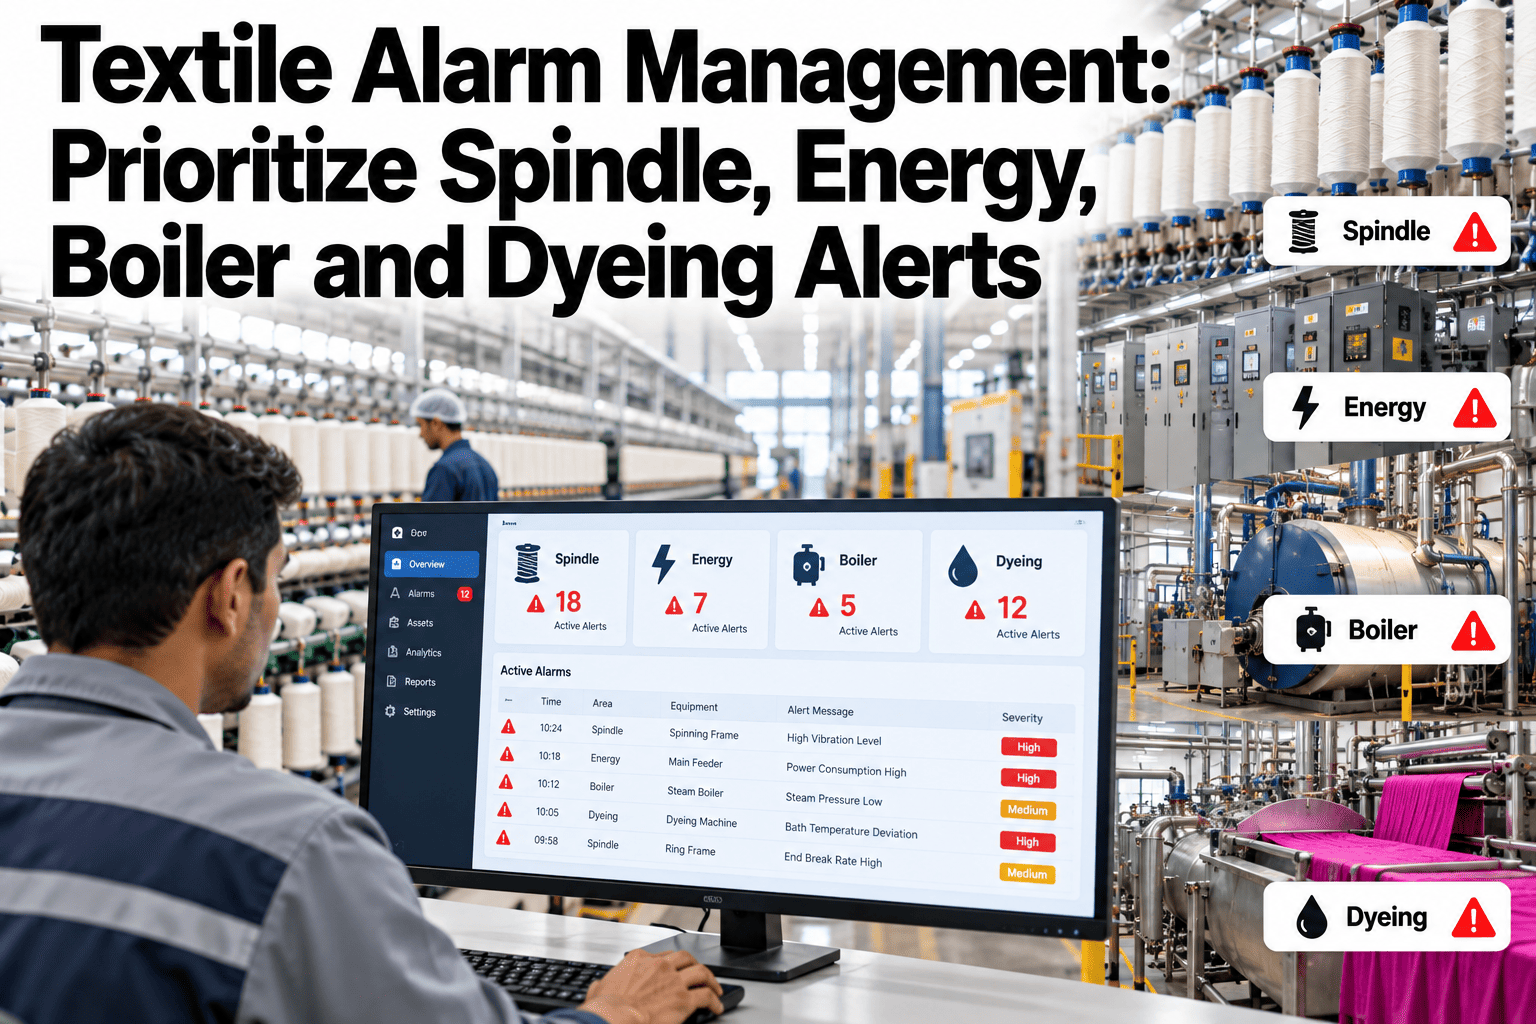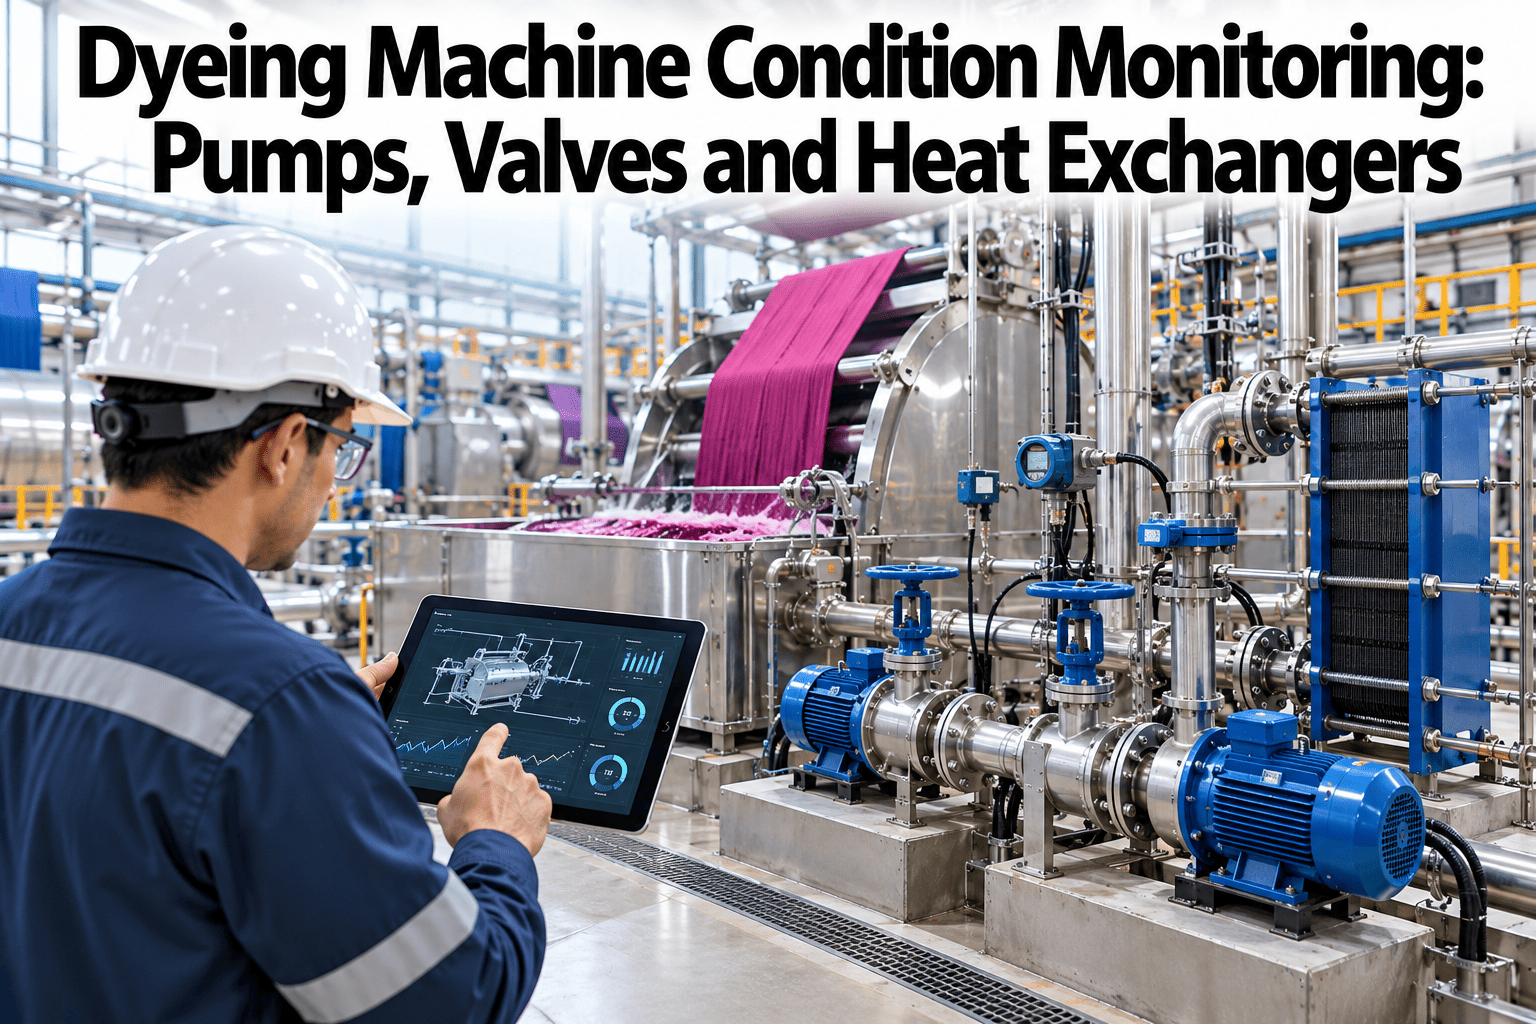
When a ring frame starts drawing 12% more electricity per kg than its baseline, that number is a maintenance signal as much as an energy signal. The extra draw comes from somewhere — worn spindle bearings, deteriorated aprons creating extra drafting resistance, an unbalanced drive adding vibration load. The same relationship holds across textile machines: a stenter with fouled air circulation burns more gas per tonne, a sizing machine with a failing steam trap consumes more steam per kg, a weaving machine with leaking compressed air fittings runs the compressor harder. Machine condition and energy intensity are directly correlated, but most mills manage them in separate departments with no shared data. iFactory AI connects the maintenance history of each machine to its energy consumption curve so engineers can identify which machines are wasting power because of a condition issue that maintenance can fix.
The Machine Drawing Extra Power Is Sending a Maintenance Signal. Are You Reading It?
iFactory AI overlays energy consumption curves with maintenance history, work order frequency, and component condition — revealing which machines are wasting power due to degradation, and prioritizing the interventions that recover both performance and efficiency.
Why Does Machine Condition Affect Energy Consumption in Textile Mills?
Every machine in a textile mill converts energy into a physical output — yarn twist, fabric movement, air pressure, thermal transfer. Any degradation in the mechanical or thermal pathway between the energy source and the output increases the energy required to deliver the same result. The relationship is direct and predictable: worse condition means higher specific energy consumption for the same production rate.
The maintenance signal embedded in an energy deviation is often earlier than the signal embedded in a production or quality deviation. A ring frame's motor current begins rising when spindle bearings start to degrade — well before yarn count variation or end breaks become a production problem. Teams who want to see this correlation pattern on their own machine data can run a maintenance-energy overlay analysis with iFactory AI's textile team.
Machine Energy Data Is a Condition Report. Start Treating It as One.
iFactory AI connects your machine energy intensity trends with maintenance history, work order frequency, and component age — so the maintenance team gets an energy-driven condition alert before failure, not after. Book a demo to see this on your machines.
How to Correlate Maintenance History with Energy Intensity
The correlation analysis requires two data streams joined on a shared machine ID and time axis: energy intensity by machine (kWh per kg or GJ per tonne), and maintenance events by machine (work orders, planned maintenance dates, component replacement records). When these are overlaid on a single timeline, the pattern becomes visible: energy intensity rises steadily between maintenance events, drops sharply after a work order or planned maintenance, and drifts up again until the next intervention.
The most valuable insight from this analysis is the energy recovery at the work-order close: if the energy intensity does not return to baseline after a maintenance intervention, the intervention did not fully address the root cause. This feedback loop — energy confirms the fix worked — is not available without the energy-maintenance correlation layer.
Energy Intensity Benchmarks by Machine Type — Maintenance Signal Thresholds
The table shows typical energy intensity benchmarks and the percentage deviation that reliably signals a maintenance intervention is needed — before the condition becomes a production or quality problem.
| Machine type | Energy metric | Healthy baseline range | Early drift threshold | Maintenance signal threshold | Likely root cause |
|---|---|---|---|---|---|
| Ring frame | kWh per kg yarn | 0.30–0.45 kWh/kg | +8% | +15% | Spindle bearings, aprons, traveller condition |
| Stenter | GJ per tonne | Substrate-dependent | +10% | +20% | Fan fouling, nozzle blockage, insulation |
| Air-jet loom | kWh per metre | 0.4–0.8 kWh/m | +15% | +25% | Compressed air leaks, reed/nozzle wear |
| Dyeing machine | kg steam per kg fabric | 3.5–8 kg/kg (substrate varies) | +10% | +20% | Steam trap failure, insulation, cycle drift |
| Sizing machine | kg steam per kg | Varies by recipe | +8% | +15% | Steam trap, cylinder insulation, speed mismatch |
Where iFactory AI Fits in Textile Maintenance-Energy Analysis
iFactory AI is an on-premise AI platform for textile manufacturing that connects machine energy meters, production data, and CMMS work order records through OPC-UA, Modbus, and 50+ standard connectors. The maintenance-energy correlation module builds an energy intensity baseline per machine and substrate, overlays CMMS work order and planned maintenance events on the same timeline, and generates a ranked list of machines where energy drift is the leading indicator of a condition requiring attention.
Frequently Asked Questions
How is energy-based condition monitoring different from vibration or acoustic monitoring?
Vibration and acoustic sensors detect the specific mechanical signature of a bearing or component — excellent at identifying which component is failing. Energy-based condition monitoring detects the system-level effect of degradation — the extra load the failing component is placing on the drive. The two approaches are complementary: energy monitoring provides the early warning that something in the system is degrading; vibration or acoustic analysis can then pinpoint the specific component. iFactory AI supports both and links them through the same machine ID and timeline. See how energy and vibration data are combined in iFactory AI's condition monitoring module.
Can energy-based maintenance signals reduce over-maintenance as well as under-maintenance?
Yes — and this is one of the most commercially valuable aspects of the approach. If a machine's energy intensity is stable at baseline, a planned maintenance interval can be extended safely, freeing maintenance capacity for machines that are actually drifting. iFactory AI's energy data makes the case for interval extension data-driven rather than a judgement call. Plants that have implemented condition-based maintenance intervals using energy data typically see maintenance labour redistributed toward the machines where intervention is genuinely needed. Ask our maintenance engineering team about condition-based interval management.
How much energy can a maintenance intervention typically recover?
The recovery depends on the degree of degradation at intervention and the machine type. For a ring frame with worn spindle bearings and aprons, a full set change can recover 8–15% of per-spindle energy draw — a figure that is directly measurable in the post-maintenance energy trend. For a stenter with fouled air fans, a cleaning and balance intervention typically recovers 10–20% of thermal energy intensity. iFactory AI's post-maintenance energy verification confirms the actual recovery per intervention, building a database of return values that improves future planning. See energy recovery examples from maintenance interventions on similar machines.
Does the analysis require sub-meter readings at the machine level, or can it use department-level energy data?
Machine-level meters deliver the most precise correlation and the most actionable alerts. Department-level meters can still support the analysis when machine-level data is unavailable — the system uses production scheduling data to estimate per-machine loading within the department total. For the highest-energy and highest-maintenance-cost machines, iFactory AI recommends adding machine-level sub-metering during deployment; the payback from the first few avoided breakdowns typically exceeds the meter cost. Ask our instrumentation team to review your current meter coverage.
How does the correlation handle seasonal or product-mix variation in energy intensity?
iFactory AI's energy baseline model controls for the variables that legitimately change machine energy intensity — fabric weight, speed, ambient temperature, and product count — so that normal variation in product mix or seasonal conditions does not trigger false maintenance alerts. Only consumption that exceeds the adjusted baseline for current conditions is flagged as a potential condition signal. This is the same multi-variable baseline approach used in the energy drift detection module. Walk through how the baseline model handles your machine and product mix variability.
Your Energy Meters Are Already Telling You Which Machines Need Attention. Let's Listen.
iFactory AI overlays machine energy consumption curves with CMMS maintenance history to surface the correlation between condition and consumption — so maintenance is planned from data, not calendar. Book a demo to see the analysis on your machines.