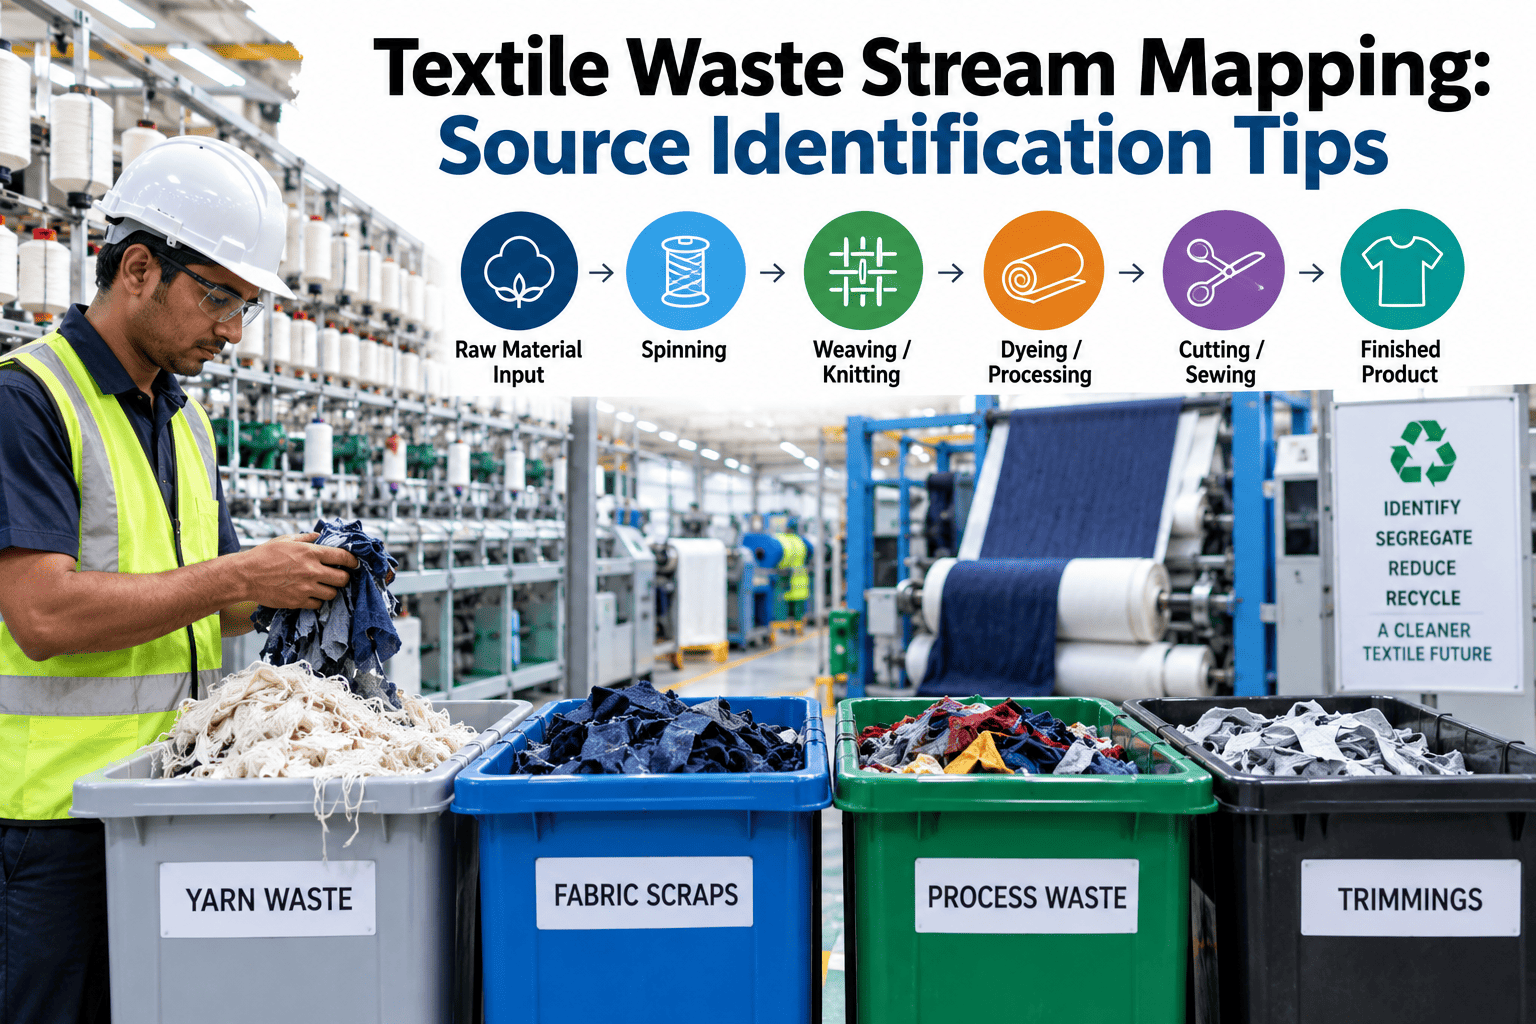
Textile Waste Stream Mapping: Source Identification Tips

By James Smith on September 7, 2026

textile-waste-stream-mapping-source-identification

Ask most textile mill managers how much material is lost to waste across the entire operation and you will typically get a rough percentage pulled from a purchasing reconciliation done once a year, not a real breakdown of where that waste is actually generated. Waste accumulates in dozens of small pockets across spinning, weaving, dyeing, and finishing, and because no single department owns the full picture, the mill ends up managing waste reactively rather than strategically, chasing whichever waste type happens to be visible that month rather than the one actually costing the most money. This reactive pattern tends to repeat year after year, with the same handful of visible waste sources receiving attention while genuinely larger but less visible losses continue unchecked simply because nobody has ever measured them precisely enough to make the comparison. A proper waste stream map traces material loss department by department, quantifies each source individually, and attaches a real cost figure to it, turning a vague annual percentage into a prioritized list the plant can actually act on. If your mill has never mapped waste this precisely, you can book a demo to see how iFactory builds this picture automatically from production data you already generate.

TEXTILE WASTE MANAGEMENT · SOURCE MAPPING

See Exactly Where Material Loss Is Coming From Across Every Department

iFactory maps waste generation department by department, attaching a real quantity and cost figure to each source so improvement effort targets the biggest loss first, not the most visible one.

THE PRODUCTION FLOW

Where Waste Enters the Process at Each Stage of Textile Production

Waste is not generated uniformly across a textile mill. Each department has its own characteristic waste types, driven by the specific mechanical and chemical processes happening at that stage. Mapping the flow department by department is the first step toward a complete picture, and it also reveals interdependencies that a department-siloed view would miss entirely, such as a spinning quality issue that manifests later as woven fabric defects several stages downstream from where the actual root cause originated.

Spinning
Hard waste from roving and sliver breaks
Soft waste from carding and combing
Pneumafil waste from fiber collection systems
Weaving
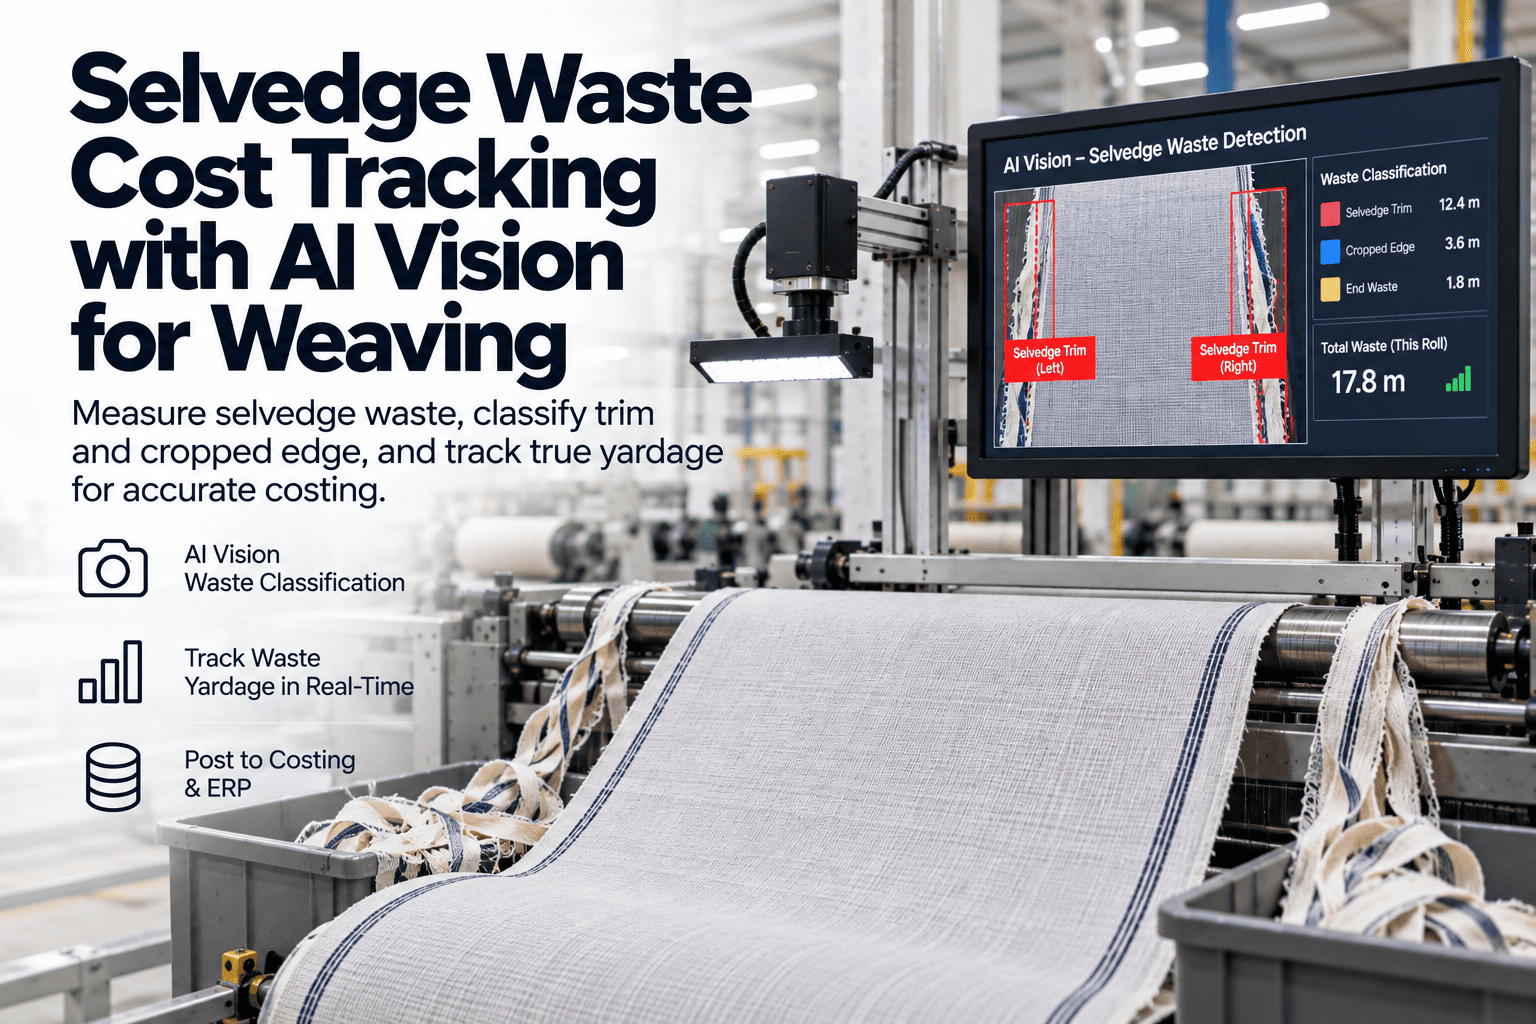
Selvedge trim from fabric edges
End pieces from beam changes
Defective fabric from quality rejects
Dyeing and Finishing
Off-shade or mismatched batches
Chemical and water process losses
Trim loss from finishing width adjustment
Cutting and Packing
Fabric remnants from cutting layout
Packaging material overage
Rejected finished goods from final inspection
MEASURING WHAT MATTERS

Three Dimensions Every Waste Source Should Be Measured Against

Identifying a waste source is only the first step. To prioritize improvement effort correctly, each source needs to be measured along three dimensions rather than judged solely by how visible or frequent it seems on the floor.

1

Quantity Generated

The actual weight or volume of material lost from this source, tracked consistently over a representative production period rather than a single spot check.

2

Material Cost Per Unit

The raw material and processing cost already invested in the material by the point it becomes waste, which rises sharply the later in the process the loss occurs.

3

Recovery Value

What portion of the cost can be recaptured through recycling, reprocessing, or resale, which varies significantly by waste type and material composition.

Get a Complete Waste Map Instead of a Single Annual Percentage

iFactory quantifies every waste source across your mill automatically, so you know exactly where to focus your next reduction initiative.

WHY LATE-STAGE WASTE COSTS MORE

The Same Physical Waste Weight Carries Very Different Costs Depending on Where It Occurs

A kilogram of waste generated at the fiber stage costs far less than a kilogram of finished, dyed, and cut fabric that ends up rejected, even though the raw material weight might be identical. This cost escalation is why prioritizing waste reduction purely by volume, without accounting for where in the process the loss occurred, consistently misdirects improvement effort toward the wrong target. A mill focused only on the department generating the most kilograms of waste, without weighting by the embedded cost per kilogram, will often overlook a smaller-volume but far more expensive loss occurring later in the process, where every kilogram lost represents a much larger share of total production cost.

Stage of LossRelative Cost per KilogramWhy the Cost Escalates
Raw fiber, pre-spinning Baseline Only raw material cost is embedded, no processing investment yet
Spun yarn 2-3x baseline Spinning energy, labor, and machine time are now embedded in the material
Woven greige fabric 4-6x baseline Weaving adds significant labor and machine time on top of yarn cost
Dyed and finished fabric 7-10x baseline Chemical, water, energy, and finishing labor costs are now fully embedded
Cut and assembled goods 10x+ baseline Full production cost plus cutting and assembly labor is lost entirely
BUILDING THE MAP

A Practical Four-Step Process for Mapping Waste Across Your Mill

Building a complete waste stream map does not require a lengthy consulting engagement. The steps below outline a practical approach most mills can execute internally using data that already exists in production and purchasing records.

Step 1

Walk Every Department

Physically observe each production stage to catalog every point where material visibly leaves the process as scrap, trim, or rejected output.

Step 2

Quantify Each Source

Establish a measurement method for each identified source, whether by weighing, counting, or estimating from existing production records.

Step 3

Attach a Cost Figure

Calculate the fully loaded cost of material lost at each stage, accounting for the processing investment already embedded by that point.

Step 4

Rank and Prioritize

Sort every identified source by total annual cost impact to build a clear, evidence-based priority list for reduction initiatives.
FREQUENTLY ASKED QUESTIONS

Questions Textile Operations Teams Ask About Waste Mapping

How is waste quantity actually measured automatically instead of through manual weighing?
Where production equipment already reports throughput and output data, waste quantity for many sources can be calculated as the difference between input material consumed and output material produced, cross-referenced against known process yield rates for that specific machine and fabric type, avoiding the need for manual weighing at every single collection point across the mill. For waste streams where this calculation approach is not reliable, such as trim loss during cutting operations, periodic sampling combined with existing scale data from waste collection points provides a practical measurement method without requiring continuous manual tracking. Book a demo to see how quantity is calculated for your specific process stages.
How often should a full waste stream map be updated once it is initially built?
A full remapping exercise is typically warranted annually or after a significant process change, such as a new fabric line, a change in raw material supplier, or new equipment installation, since these events can shift where and how much waste is generated in ways that make the previous map outdated. Between full remapping cycles, ongoing tracking of the top-priority waste sources identified in the initial mapping should continue continuously, since these are the sources where improvement progress and any regression need close monitoring regardless of whether a full remap has been scheduled. Contact support to set up an ongoing waste tracking cadence.
Does waste mapping account for material that is recovered or recycled rather than truly lost?
Yes, the recovery value dimension specifically accounts for this, since material that is fully recycled back into production or sold to a secondary market has a meaningfully lower true cost impact than material that is entirely discarded, and treating all waste as a total loss without accounting for recovery would distort the prioritization toward sources that are actually less costly than they first appear. Building an accurate recovery value requires understanding your specific recycling and resale arrangements for each material and waste type, which can vary considerably even within a single mill depending on the fiber composition and contamination level of the specific waste stream. Contact support to discuss recovery value calculation for your waste streams.
Can waste mapping data help with sustainability reporting requirements from customers or regulators?
Yes, a detailed, quantified waste stream map is directly useful for sustainability and environmental reporting, since many customer sustainability questionnaires and emerging regulatory frameworks require specific data on material efficiency and waste generation that a vague annual percentage cannot adequately support, while a department-level, source-level map provides the granularity these reporting frameworks increasingly expect. Mills that have already built this mapping capability for internal cost reduction purposes find it substantially easier to respond to these external reporting requests, since the underlying data collection work has already been done rather than needing to be built specifically for a compliance deadline. Book a demo to discuss sustainability reporting use cases.
How do we get department managers to actually engage with a mill-wide waste mapping initiative rather than viewing it as an audit?
Framing the initiative around identifying cost-saving opportunities specific to each department, rather than as a top-down audit looking for problems, tends to generate far more genuine engagement, particularly when department managers are given visibility into how their specific waste sources compare in cost impact and are involved in setting realistic reduction targets for their own area rather than having targets imposed without context. Sharing early wins from the highest-priority waste source, once identified and addressed, also helps build momentum and buy-in for continuing the mapping effort into other departments that have not yet been fully analyzed. Contact support to discuss rolling out a mapping initiative across your departments.

Turn a Vague Waste Percentage Into a Prioritized Action List

iFactory maps, quantifies, and costs every waste source across your mill so your next reduction project targets the biggest opportunity. Book a demo to get started.


Share This Story, Choose Your Platform!