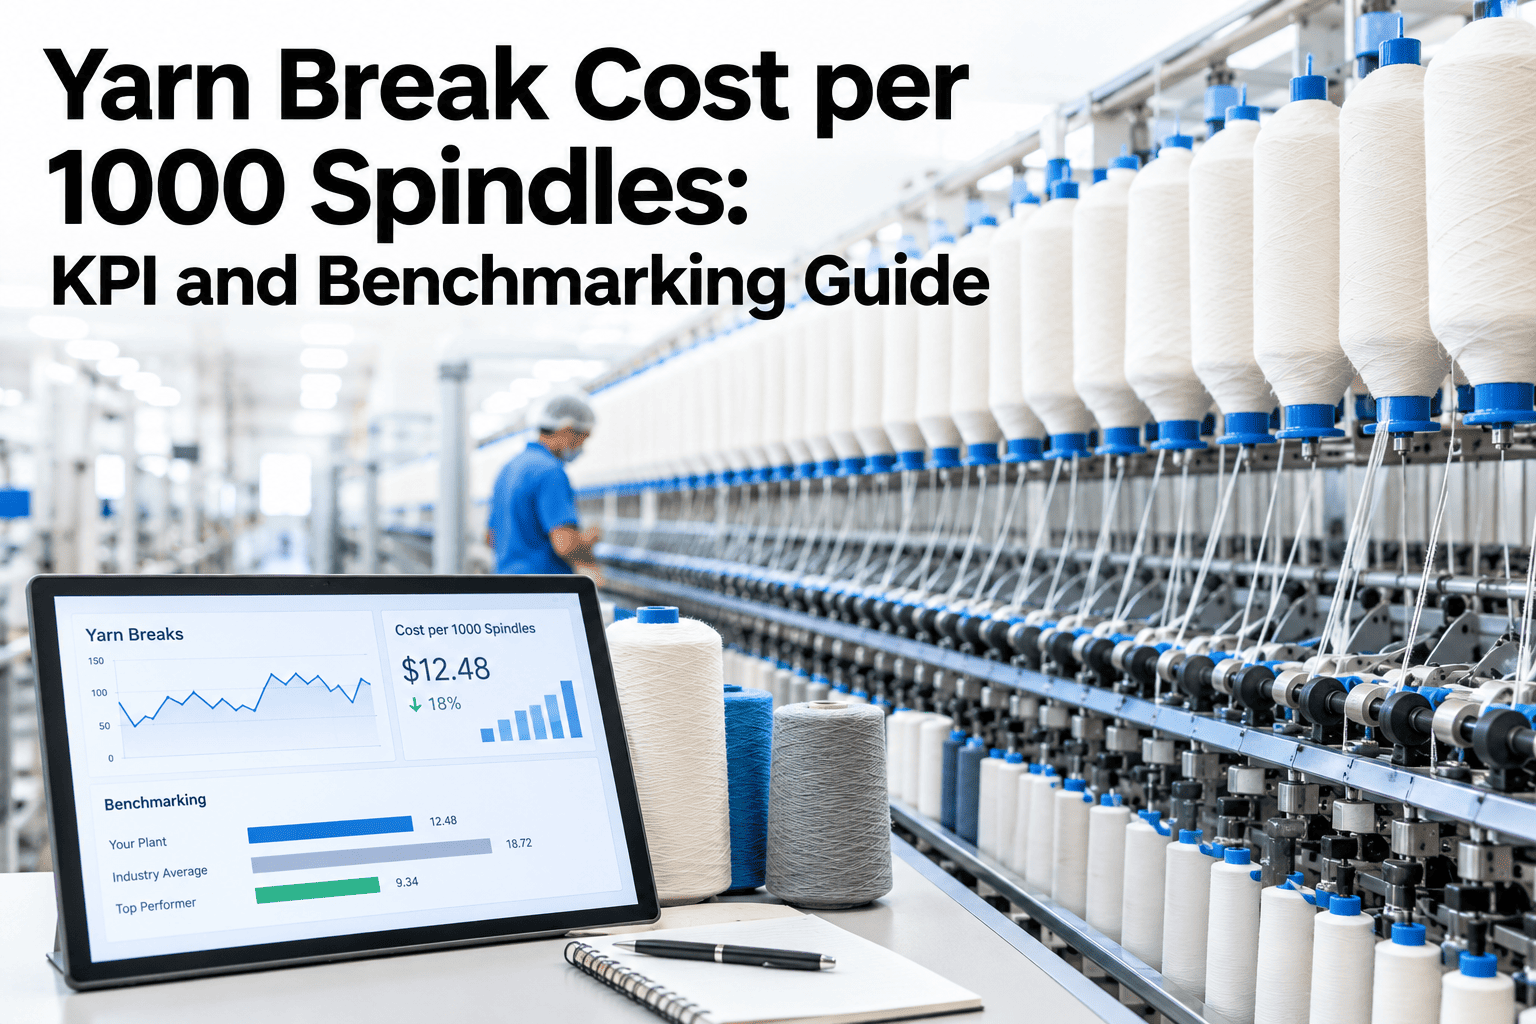
Yarn breaks per 1000 spindle-hours is a familiar number on most spinning mill reports, but the figure alone doesn't tell a plant manager whether 16 breaks on Frame 3 this week is a maintenance problem, a quality problem, or just what Ne 40 combed cotton normally looks like on an older frame. Turning the raw break count into a cost-per-1000-spindles figure, benchmarked across frames, shifts and yarn counts, is what actually tells a mill where to spend its next maintenance hour. iFactory AI, an on-premise AI platform for textile operations, can calculate this KPI against your mill's own frame and shift data before your next review.
A Break Count Alone Doesn't Tell You What It's Costing
Yarn break cost per 1000 spindles turns a raw break count into a comparable, benchmarkable figure across frames, shifts and yarn counts, so a mill can see where maintenance attention actually pays off.
Why Raw Break Counts Mislead Across Frames
A frame running Ne 40 combed cotton will naturally show a different break rate than one running Ne 20 carded, and comparing their raw counts side by side tells a plant manager almost nothing. Normalizing to cost per 1000 spindles, and segmenting by yarn count, lets the same frame be compared against its own history and against comparable frames elsewhere in the mill — which is the comparison that actually points to a maintenance gap instead of a product-mix artifact.
Minutes to locate, clean, re-thread and restart, multiplied by breaks.
Material lost per break event, valued at the yarn's own cost per kilogram.
Operator time pulled from other duties to clear each break.
Breaks correlate with downstream hairiness and unevenness increases.
Benchmarking Across Frames and Shifts
The same metric, tracked consistently, becomes a ranking tool rather than a single number to react to in isolation. Our team can set up this benchmark against your mill's frame list.
| Frame | Yarn Count | Breaks / 1000 Spindle-hrs | Cost / 1000 Spindles |
|---|---|---|---|
| Frame 1 | Ne 20 carded | 11 | Baseline |
| Frame 2 | Ne 20 carded | 13 | +18% vs Frame 1 |
| Frame 3 | Ne 40 combed | 22 | Baseline for its count |
| Frame 4 | Ne 40 combed | 31 | +41% vs Frame 3 |
See Your Frames Ranked by Cost, Not Just Count
Share your break logs by frame and yarn count, and get a benchmarked ranking that separates real maintenance gaps from normal product-mix variation.
A Healthy Range by Yarn Count
What Pushes a Frame Above Its Normal Range
Rollers and aprons past their service life raise break rates independent of count.
Wrong traveller weight or worn travellers for the yarn count in use.
Spinning room conditions outside the yarn's tolerance window.
Fiber quality shifts between lots can raise breaks on every frame running it.
A Composite Scenario: The Frame That Looked Fine on Paper
Picture a mill comparing raw break counts across four frames, where Frame 3's count looked unremarkable next to Frame 4's higher number.
Once breaks were normalized against yarn count, Frame 3 was actually the worst performer among frames running the same Ne 40 combed cotton, a fact the raw comparison against a carded-cotton frame had completely obscured. Maintenance attention redirected to Frame 3 closed the gap within a few weeks. The scenario illustrates the value of normalized comparison, not a guaranteed finding for every mill.
Where iFactory AI Fits
iFactory AI calculates yarn break cost per 1000 spindles automatically from existing break logs and frame data, normalized by yarn count so comparisons across the mill are actually meaningful.
Frames compared fairly within the same yarn count, not against each other blindly.
Downtime, waste and labor rolled into one ranked figure.
The worst-performing frame for its count surfaces without manual spreadsheet work.
Frequently Asked Questions
There's no single universal target, since it depends heavily on yarn count and fiber type, which is why benchmarking a frame against others running the same count matters more than chasing one fixed number. Get a benchmark for your specific yarn counts.
It typically combines downtime minutes valued at production rate, yarn waste valued at material cost per kilogram, and an allowance for labor reallocation, summed per break event and then scaled to the 1000-spindle basis. Review the cost components for your mill's specific rates.
Yes, shift-level tracking often reveals operator technique or handling differences that a frame-only view would miss, especially for break-clearing speed and consistency across the same equipment. Set up shift-level tracking alongside frame benchmarking.
Weekly is typical for an active review cycle, with a rolling four-week average used to smooth normal day-to-day variation before drawing conclusions about a specific frame. Discuss a reporting cadence that fits your review meetings.
Partially — if several frames running the same fiber lot all show elevated breaks simultaneously, that points to raw material rather than any single machine, which is a pattern worth checking before assuming a maintenance cause. Review how to separate these causes in your own data.
Know Which Frame Actually Deserves Attention Next
iFactory AI turns raw break counts into a normalized, benchmarked cost figure across every frame, shift and yarn count in the mill.