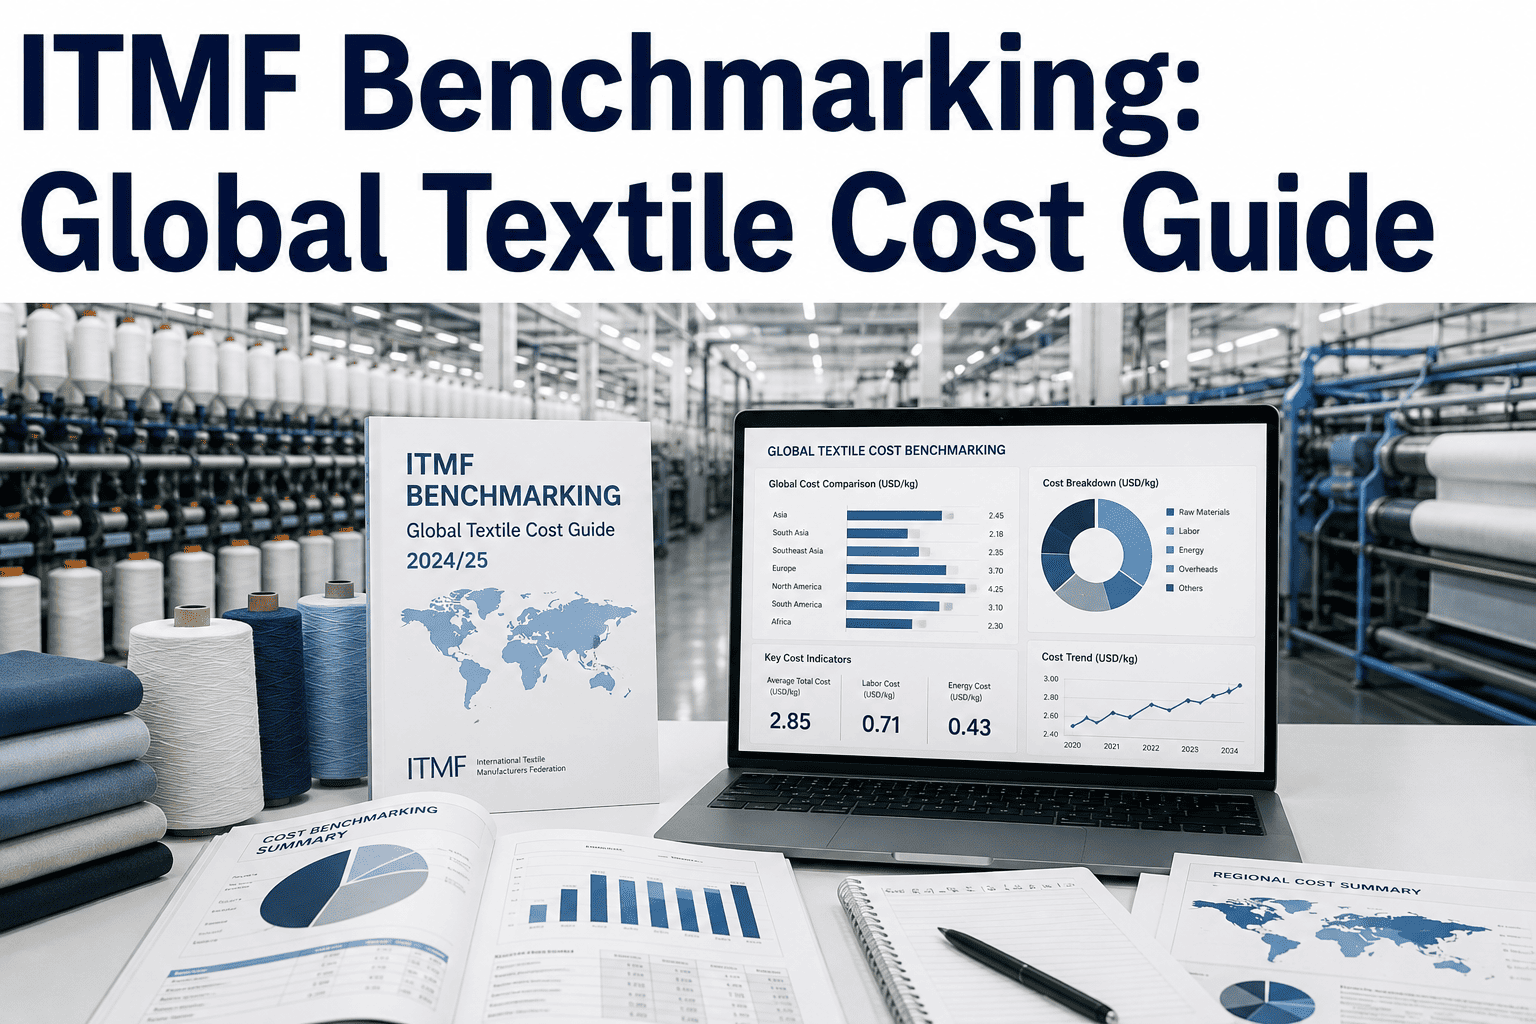
Every textile mill owner has heard some version of the same claim in a trade meeting — "our costs are competitive with Vietnam" or "we're cheaper than Bangladesh on spinning." Most of the time, nobody in the room has actually checked. The ITMF International Production Cost Comparison has quietly become the closest thing the textile industry has to an audited scoreboard, tracking spinning, weaving, and finishing costs across dozens of countries using a standardized methodology instead of anecdotal trade-show comparisons. iFactory's plant intelligence platform helps mills translate that global benchmark into a line-by-line view of where their own cost structure actually stands, and where the gap can realistically be closed — reach out through iFactory support to see how your mill's numbers compare.
Global Cost Intelligence · Textile Manufacturing
Where Does Your Mill Actually Rank Against the World, Not Just the Mill Down the Road
ITMF's benchmarking studies compare spinning, weaving, and finishing costs across 20+ producing countries using standardized cost-per-kg and cost-per-hour methodology. iFactory helps you map your own plant's real numbers onto that global picture — down to the shift, the machine, and the shift supervisor.
Illustrative Spinning Cost Index (Cotton Ring Yarn, Relative Scale)
Lower index reflects a lower relative cost position based on typical ITMF study inputs; actual figures vary by mill scale, energy mix, and labor structure.
Why This Matters More Than It Used To
Cost Gaps That Used to Take Years to Close Now Shift Within a Single Contract Cycle
A decade ago, a two or three point cost advantage between producing countries was durable — buyers didn't reshuffle sourcing that fast, and energy or wage differentials moved slowly. That stability is gone. Energy price volatility, currency swings, and rapidly changing labor costs in Southeast Asia and South Asia mean a mill's relative position on the ITMF chart can move meaningfully within a single fiscal year. Mills that only benchmark themselves informally, at trade shows or through buyer feedback, tend to find out about a competitive slip only after volumes have already started moving to a cheaper origin.
The mills that hold their ground are the ones that treat the ITMF comparison as a live input rather than an annual curiosity — checking their own cost-per-kg against the study's methodology regularly enough to catch drift before a buyer's sourcing team does.
What Actually Makes Up the Number
Five Cost Components the ITMF Study Breaks Every Country Down Into
31%
Raw Material
Cotton, polyester, and blended fiber input cost, typically the single largest and most globally correlated component across countries.
24%
Labor
Direct operator wages plus statutory benefits, varying most sharply between South Asian, Southeast Asian, and East Asian producing regions.
19%
Energy
Electricity and thermal energy for spinning, weaving, and wet processing, increasingly the most volatile line item in the entire cost stack.
15%
Capital & Depreciation
Machine investment amortized over expected life, weighted heavily toward countries running older, fully depreciated spinning assets.
11%
Overheads & Logistics
Factory overhead, maintenance spares, and inbound-outbound freight, often underweighted in informal cost comparisons between mills.
Process-Level View
Spinning, Weaving, and Finishing Cost Position by Region
Table is horizontally scrollable on smaller screens. Positions are directional and drawn from typical ITMF study patterns; actual rankings shift year to year.
Knowing the Global Number Is Step One. Knowing Where Your Own Mill Sits Inside It Is the Part That Pays.
iFactory pulls your machine-level energy consumption, labor hours, and material yield data and maps it directly against ITMF-style cost categories, so you're not guessing where your mill actually stands.
How the Comparison Is Built
The Methodology Behind a Credible Country-to-Country Cost Comparison
1
Standardized Product Basket
A fixed set of representative products — combed cotton ring yarn, plain weave fabric, dyed and finished cloth — is priced identically across every participating country to remove product-mix distortion.
2
Machine Park Assumptions
A representative, modern machine configuration is assumed for each process stage, so a country isn't penalized or flattered purely because of the age of the specific mills surveyed.
3
Local Input Pricing
Actual local labor rates, industrial energy tariffs, and prevailing raw material prices are gathered from in-country sources rather than global averages.
4
Currency Normalization
All figures are converted to a common currency using purchasing-power-adjusted exchange rates, smoothing out short-term currency volatility that would otherwise distort the comparison.
5
Peer Review and Publication
Participating national textile associations review the inputs for their own country before the comparative study is finalized and published for member use.
Applied Example
A Weaving Mill That Thought It Was Losing on Labor, and Was Actually Losing on Energy
A mid-sized weaving operation had been quoting higher prices than two regional competitors for three consecutive seasons and assumed it was simply a labor cost disadvantage, since that was the most commonly cited factor in industry conversation. When the plant mapped its actual machine-level data against ITMF-style cost categories using iFactory, the picture looked different: labor cost per meter was actually competitive, but energy cost per meter was running nearly 40% above the regional benchmark, driven by an aging compressor system and looms running well below optimal shed efficiency. The mill redirected its cost-reduction effort toward compressed air and loom efficiency instead of labor restructuring, closing most of the pricing gap within two quarters without touching headcount.
40%Energy cost above regional benchmark
2 quartersTo close most of the pricing gap
0Headcount changes required
What Mills Typically See
Outcomes After Mapping Plant Data Against Global Cost Benchmarks
6–14%
Typical Identified Cost Gap
Between assumed and actual cost position once machine-level data replaces informal estimates against the regional benchmark.
3 areas
Average Drivers Identified per Mill
Most mills find their true competitiveness gap concentrated in two or three specific cost drivers, not spread evenly across the whole operation.
Quarterly
Recommended Re-Benchmark Cycle
Given how fast energy and currency positions move, a quarterly internal check keeps a mill from being surprised by a full annual study release.
Frequently Asked Questions
ITMF Benchmarking and Plant-Level Cost Mapping — Common Questions
How often is the ITMF cost comparison study published?
The International Textile Manufacturers Federation typically releases its production cost comparison on a multi-year cycle, with select updates in between depending on how much input costs have moved. Because a full study can lag current conditions by a year or more, mills that rely on it as their only benchmarking source often operate on outdated assumptions between releases. Pairing the published study with your own continuously updated machine-level cost data closes that lag considerably.
Book a Demo to see how a live cost view compares to the last published study.
Can a single mill really compare itself against a whole country average?
Not directly, and that's an important distinction — the ITMF figure represents a country-level average based on a representative machine configuration, not any individual mill's actual performance. The useful comparison is between your own plant's true cost-per-kg, calculated from real machine and labor data, and the country average as a directional reference point. A mill running well above local average efficiency can beat the national number even in a higher-cost country, and the reverse is also true.
What data does iFactory need from our mill to build this comparison?
The core inputs are machine-level energy consumption, production output by shift, labor hours allocated per process stage, and raw material consumption and waste rates. Most of this already exists in your ERP, energy meters, or production logs — iFactory connects to those existing sources rather than requiring a separate manual data collection exercise.
Contact support to review what's available in your current systems.
Is this only useful for mills competing on price with lower-cost countries?
No — mills in higher-cost regions use the same comparison to identify exactly which cost categories justify a premium price and which ones represent avoidable inefficiency rather than a structural disadvantage. Knowing that your labor cost is structurally higher but your energy efficiency is genuinely best-in-class, for example, changes how a sales team frames pricing conversations with buyers who are comparing quotes across countries.
How quickly can we get an initial benchmark view of our own plant?
Mills with reasonably organized ERP and energy metering data typically see an initial cost-category breakdown within two to three weeks of connecting their systems, followed by ongoing quarterly refreshes as new production and cost data accumulates. Plants with less digitized records generally need a few additional weeks for data cleanup before the first comparison is reliable.
Book a Demo to scope a timeline for your specific setup.
Stop Guessing Where You Rank. Map Your Real Cost Structure Against the Global Benchmark.
Turn ITMF-style cost categories into a live view of your own spinning, weaving, or finishing operation, updated as your plant data comes in.