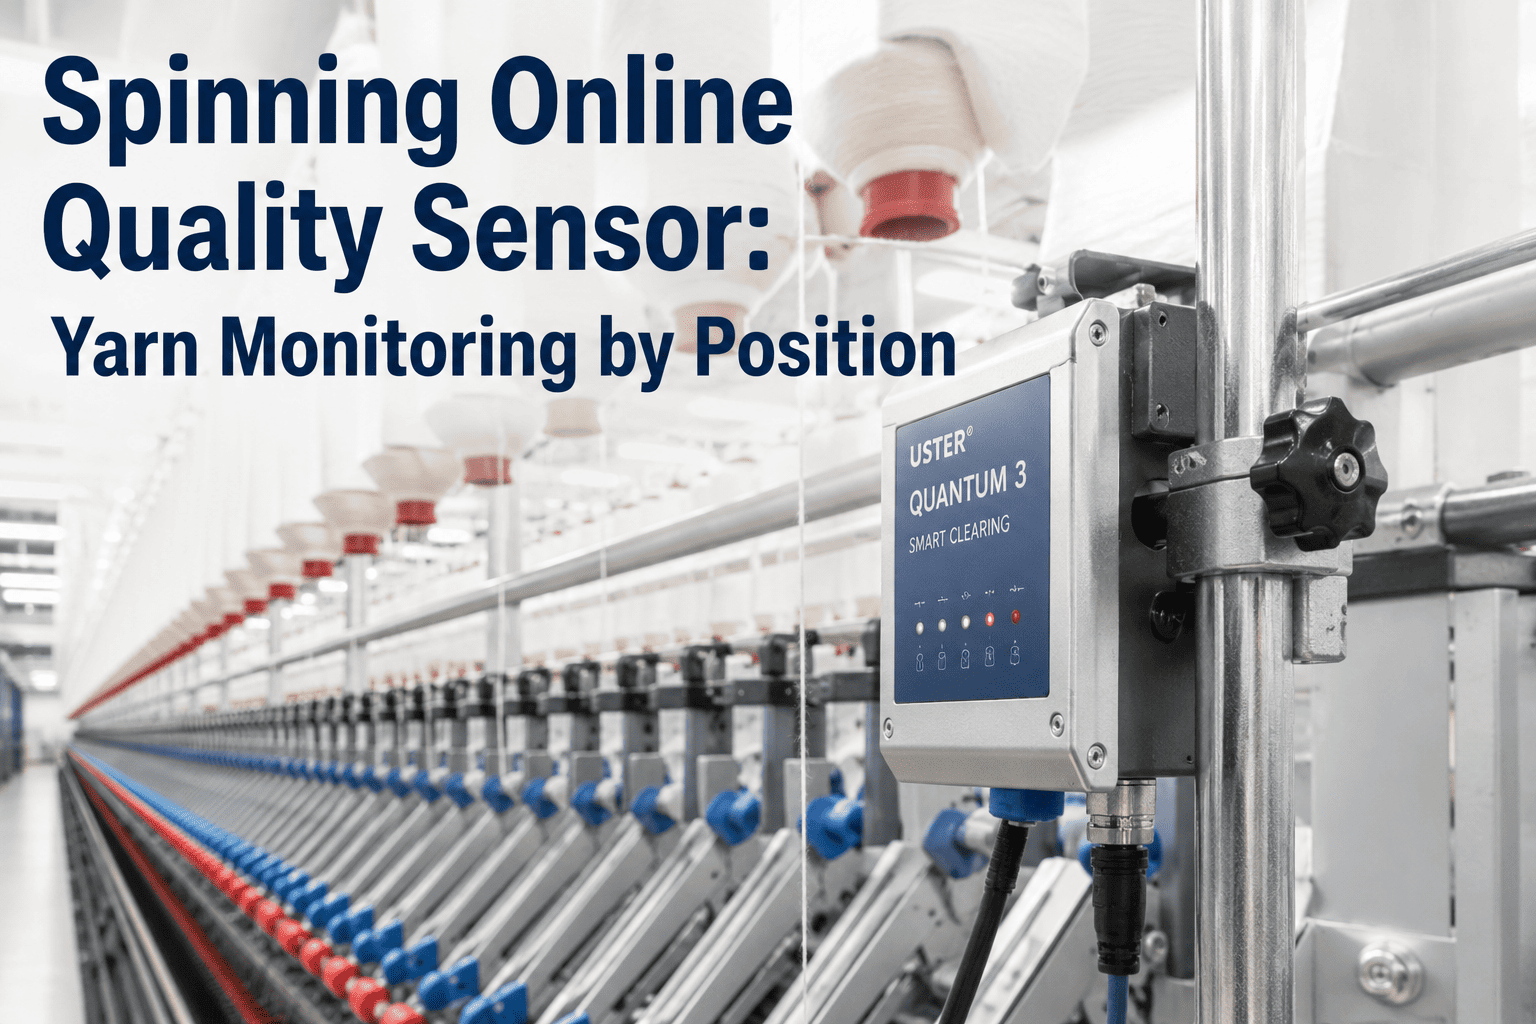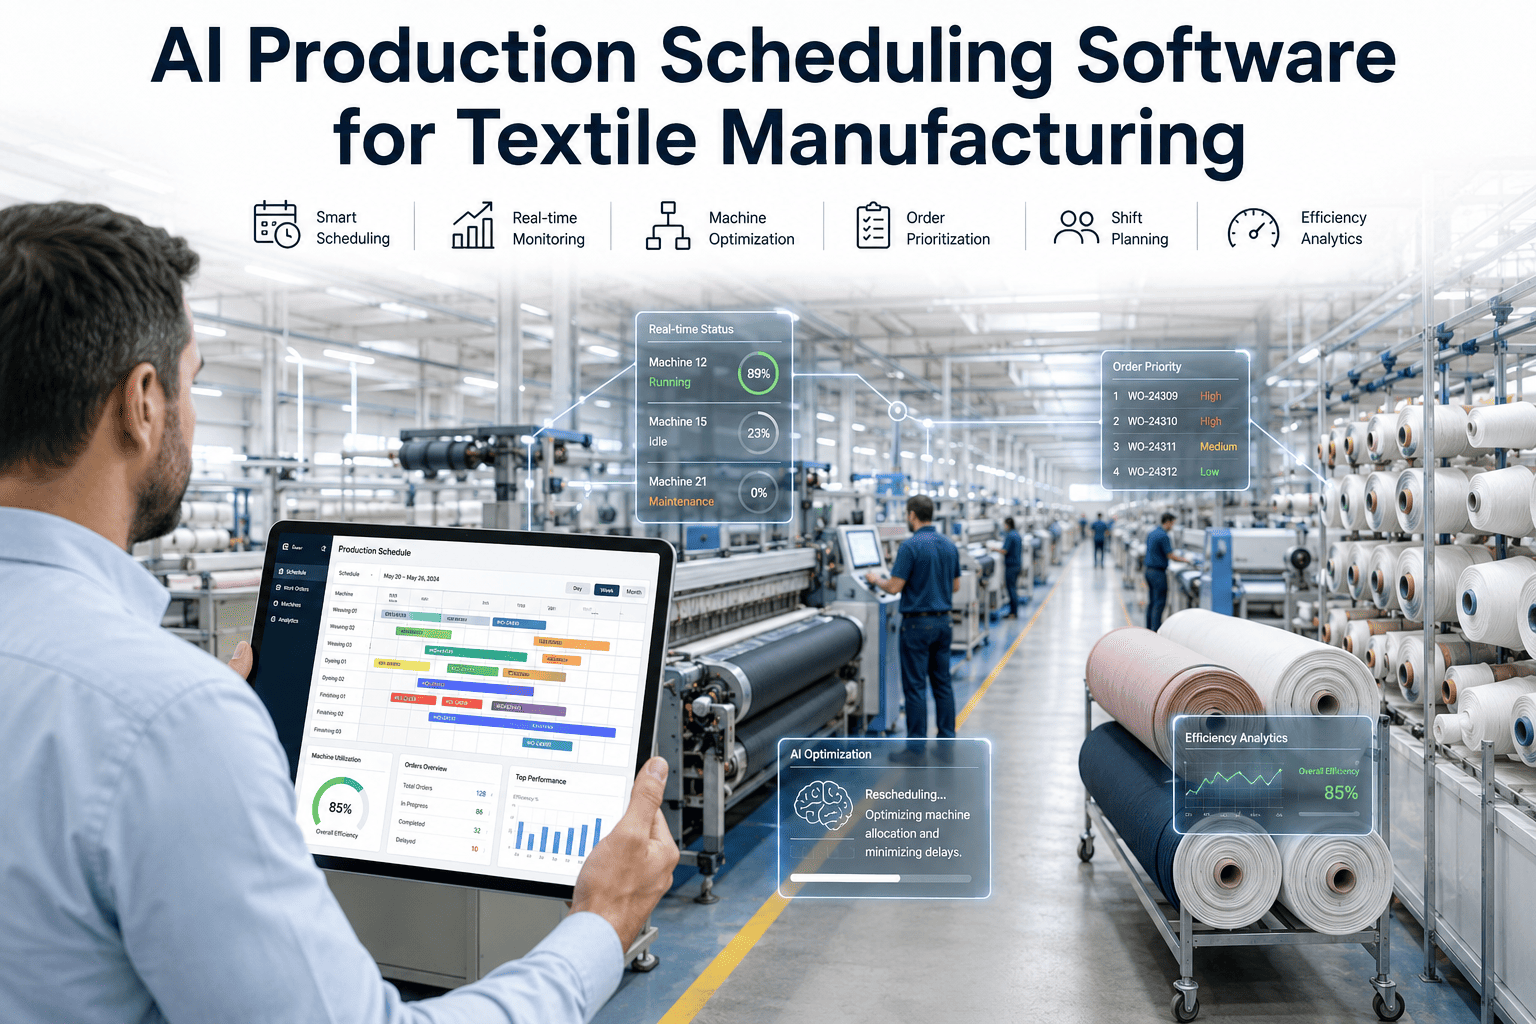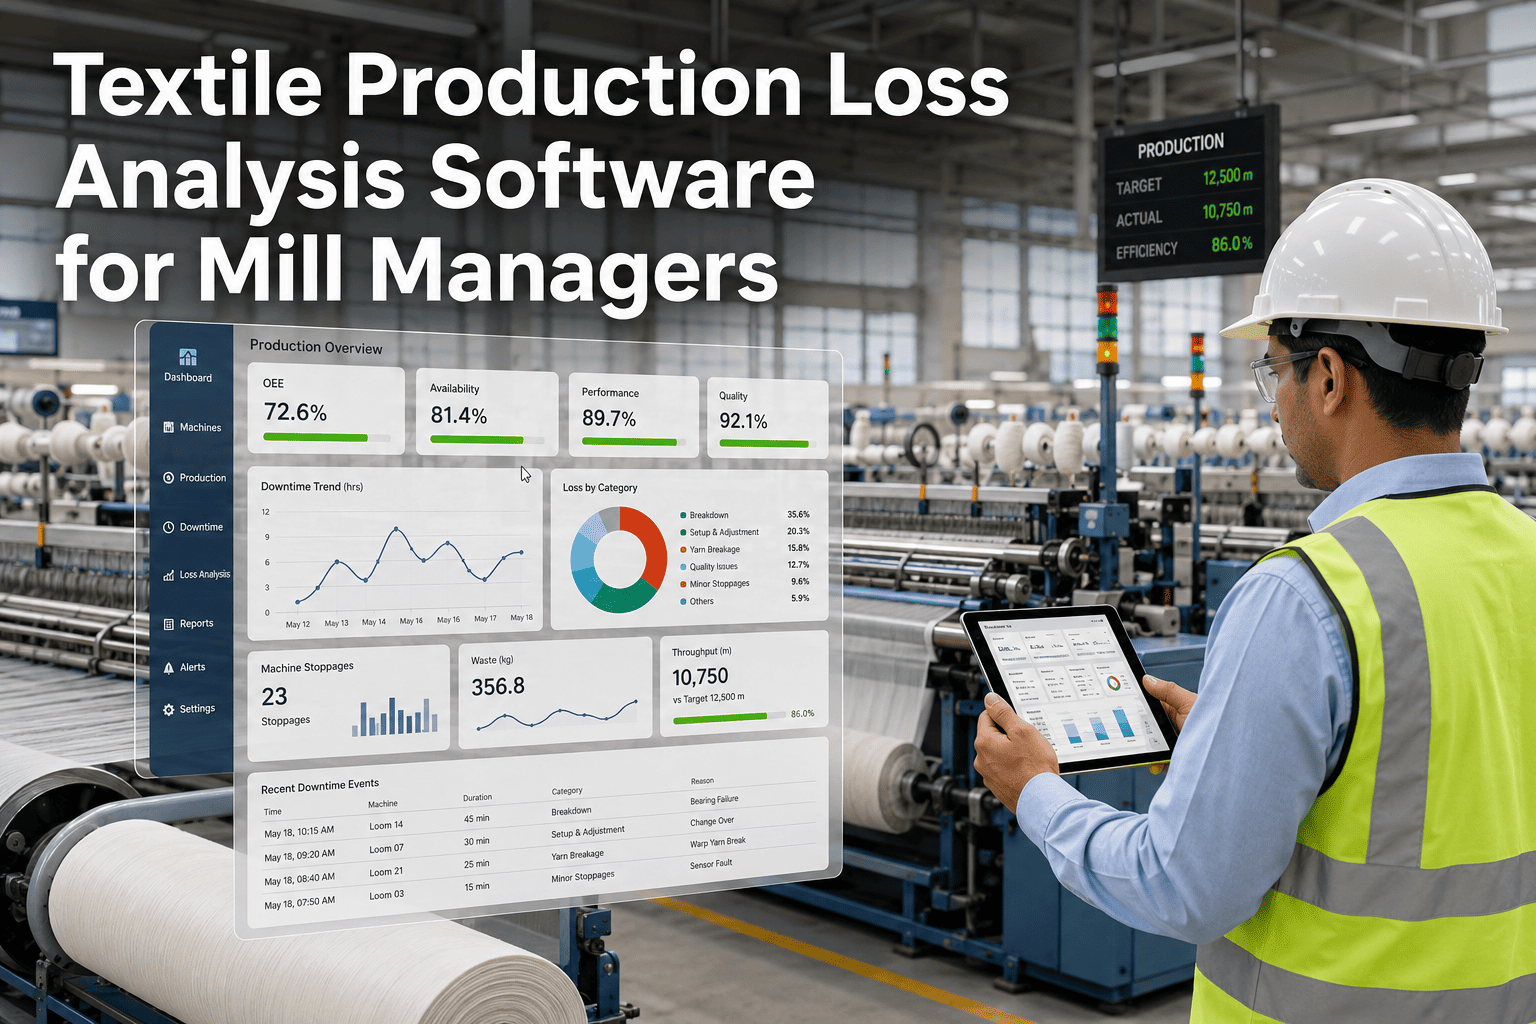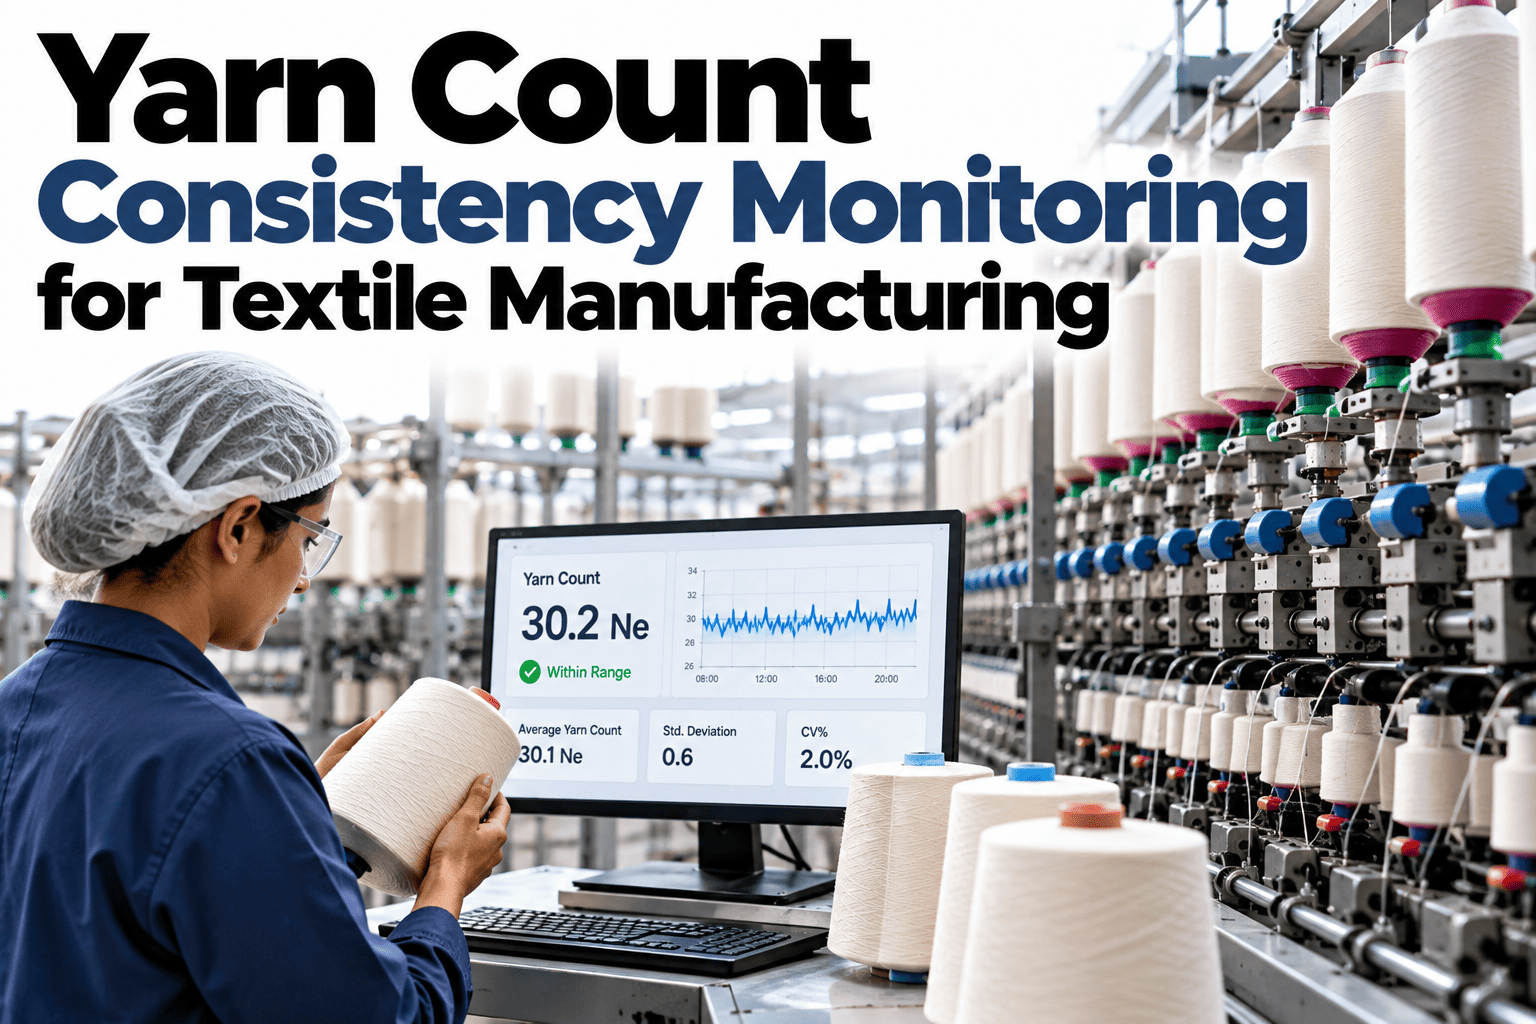
A yarn can pass every spot check and still cause trouble downstream, because count drift usually builds slowly between lab tests. When the average Ne creeps away from target, fabrics shift in weight, handle and shade, and the cause is often traced back days later. Monitoring count consistency closes that gap by turning scattered test results into a continuous picture of each frame and lot. Spinning mills that want that visibility can ask iFactory AI how count variation is tracked across their frames.
Catch Yarn Count Drift Before It Reaches the Fabric
iFactory AI follows Ne variation from sliver to finished yarn, so a drifting frame shows up as a trend you can act on instead of a complaint from the weaving shed.
What Count Consistency Really Means
Count consistency is not one number. It is how tightly the yarn stays around its target across a bobbin, a frame and a whole lot.
Where Count Drift Starts
Drift is rarely a ring frame problem alone. It is usually inherited from earlier stages and then amplified by draft.
How Strongly Each Cause Influences Each Stage
The matrix shows typical influence, not a measured mill. It helps decide where monitoring effort pays back first.
| Drift Cause | Sliver | Roving | Ring Frame |
|---|---|---|---|
| Sliver weight variation | High | Moderate | Moderate |
| Worn or wrong draft gears | Low | Moderate | High |
| Roving tension and hank | Low | High | Moderate |
| Humidity and temperature swings | Moderate | Moderate | High |
| Raw material mix changes | High | Moderate | Moderate |
Why Count Drift Costs More Than It Looks
A small shift in average count rarely triggers an alarm on its own. The cost arrives later, spread across fabric, finishing and customer conversations.
Fabric weight moves
A finer or coarser yarn changes grams per square metre, which can push a fabric outside its specification without anyone touching the loom.
Handle and shade shift
Count variation changes how light and dye behave across a roll, so streaks and barre can appear after dyeing, when fixing them is hardest.
Rework and claims grow
Defects discovered late mean regrading, reprocessing and sometimes returned lots, all of which cost far more than catching drift at the frame.
Planning gets noisy
When yarn properties wander, planners add safety margin everywhere, which quietly raises inventory and lead times.
Which Factors Move Count the Most
Count responds to many inputs at once. The chart shows an illustrative sensitivity ranking, which helps decide what to control first.
Find Out Which Frames Are Drifting Right Now
Book a 30-minute session and iFactory AI will review your count targets, test routines and frame data to show where variation hides.
Periodic Lab Tests or Continuous Monitoring
Lab testing remains the reference, but it samples a small fraction of production. Continuous monitoring fills the gaps between samples.
Reading the Trend
A count chart tells a different story depending on its shape. Learning to read the shape shortens the time to a fix.
| Trend Shape | Likely Meaning | First Check |
|---|---|---|
| Steady slide off target | Gradual wear or setting drift | Draft gears and settings on that frame |
| Sudden step change | Material, setting or doffing change | What changed at that exact shift |
| Saw-tooth pattern | Cyclic fault in roving or drafting | Roving bobbin and top roller condition |
| One frame apart from peers | Frame-specific fault | Compare against sister frames |
A Composite Scenario: The Frame That Slowly Drifted
This is a composite example, not a named mill. It shows how drift hides between scheduled lab checks.
What iFactory AI Adds
iFactory AI is smart manufacturing and industrial software for textile operations. Explore the spinning module in a live product tour to judge it on real data.
Frame-Level Count Trends
Ne trends per frame, article and shift make drift visible early.
Peer Comparison
Identical frames are compared automatically so outliers stand out.
Stage Traceability
Variation is linked back to sliver, roving or ring frame inputs.
Lab Result Linking
Test results sit beside live trends, so confirmation takes minutes.
A Weekly Count Review Routine
Monitoring only pays off when somebody looks at it on a schedule. This short routine fits into a normal weekly quality meeting.
Open the count trend for each article and note any lot outside tolerance.
Line up identical frames side by side to find the outlier.
Follow the outlier back through roving and sliver for a cause.
Assign a fix with a named owner and a due date.
Check next week that the trend has returned to target.
Count Considerations by End Use
Different products tolerate different amounts of variation. Setting expectations per end use keeps monitoring practical and targets realistic.
| End Use | Why Consistency Matters | What to Watch Closely |
|---|---|---|
| Fine knitted fabrics | Small count differences show as horizontal barre | Frame-to-frame spread and lot repeatability |
| Woven shirting and fine wovens | Uneven count shows in weight and hand | Warp yarn consistency across beams |
| Denim and heavier wovens | Slub and count effects are part of the look | Whether variation is intentional or accidental |
| Blended yarns | Blend ratio drift also changes count | Blend control at the sliver stage |
Common Mistakes in Count Monitoring
Most failed monitoring projects stumble on the same few habits. Knowing them in advance saves months.
Chasing every small wobble
Alerting on tiny moves trains the floor to ignore alerts, so tolerances must be set sensibly.
Ignoring the lab
Monitoring without lab confirmation loses credibility the first time an alert is wrong.
Skipping the baseline
Without a normal range for each article, drift cannot be judged fairly.
Treating all frames alike
Old and new frames behave differently, so compare like with like.
A 30-Day Plan to Get Started
A modest first month proves value without disrupting the spinning room. Here is a realistic sequence.
Review of Count Monitoring Practice
A process-focused review of how mills usually succeed or struggle with count monitoring, written as editorial guidance rather than a named expert quote.
Fix the baseline first
Monitoring only works when each article has a trusted target and tolerance, so drift is judged against something real.
Trust the pattern, not one point
A single odd sample is noise. Repeated drift on one frame is a signal worth a maintenance check.
Close the loop with the lab
Every flagged drift should end with a lab confirmation, which keeps alerts credible with the floor team.
Frequently Asked Questions
How is count variation different from average count?
Average count tells you where a lot sits against target, while variation tells you how consistent the yarn is around it. A lot can average perfectly and still scatter widely. See both measures plotted on live frame data to understand the difference. A tight average with wide scatter still produces uneven fabric, so both numbers belong on the same chart.
Can monitoring replace lab testing?
No. Lab testing stays the reference method and is still needed to confirm a flagged drift. Monitoring adds the continuous view between samples so problems are found sooner and tested with purpose. The best results come from using lab data to calibrate the monitoring, then letting monitoring guide where the lab looks next.
Which frames should be monitored first?
Start with frames running your most count-sensitive articles and any that already show complaints. A small first set proves the value quickly. The support team can help choose a sensible first group based on your product mix. Frames on count-sensitive articles, such as fine knits, usually repay attention fastest because small drift shows up in the cloth.
Does humidity really affect count?
Yes. Moisture changes fibre behaviour and weight during drafting and testing, so unmanaged swings add variation. Tracking conditions next to count trends helps separate environmental drift from mechanical wear. Keeping the spinning room within a steady humidity band removes one cause of drift before any machine setting is touched.
How fast can a mill see results?
Many mills see their first useful trends within weeks, once data connections and baselines are in place. Book time to scope a pilot on a handful of frames and agree what success looks like. Early wins are usually one or two frames found drifting, which builds the case for wider coverage across the mill.
Make Count Variation a Trend You Manage, Not a Surprise
iFactory AI shows count drift by frame and stage so your team can step in early. Book a walkthrough to see it against your own spinning data.