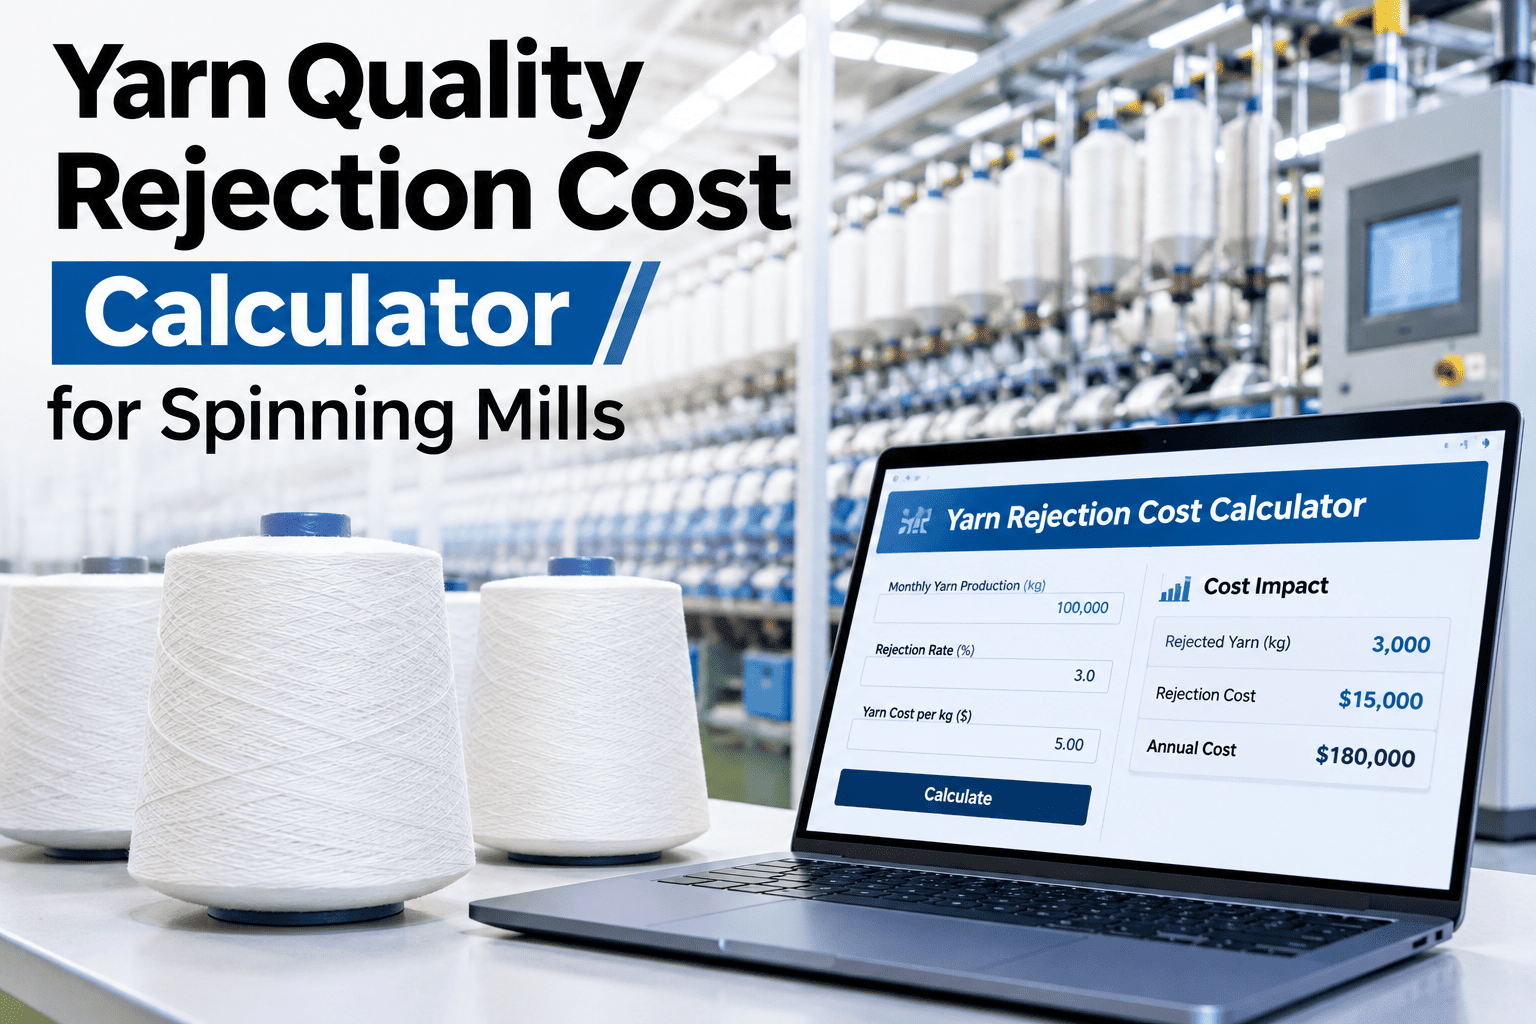
A rejected yarn lot's cost is rarely just the material in that lot. By the time a rejection is finalized, it has usually also consumed testing time, rework labor, production delay, and sometimes a customer claim that carries its own cost beyond the yarn itself. Estimating only the material loss on a rejection consistently understates the true cost of poor quality, which makes it harder to justify the improvement work that would prevent it. Spinning mills that want their own rejection cost calculated in full can review a full rejection cost breakdown using their own data with iFactory AI.
Material Loss Is Only Part of What a Rejected Lot Actually Costs
iFactory AI calculates the full cost of yarn quality rejection — material, rework, testing, downtime and customer claims — to prioritize improvement work accurately.
Six Cost Categories a Rejection Usually Touches
Each rejection does not necessarily touch all six, but a realistic estimate checks each one rather than assuming only material cost applies.
Why Prioritization Changes Once the Full Cost Is Counted
| Defect type | Material cost alone | Full cost including all categories |
|---|---|---|
| Strength failure | Moderate | High — often includes customer claim exposure |
| Minor unevenness | Low | Moderate — mostly testing and minor rework |
| Contamination | High | Very high — material, rework and claims combined |
See Your Own Full Rejection Cost, Not Just Material Loss
Share a recent rejection event and a short session will calculate its full cost across all six categories.
A Composite Scenario: The Improvement Project That Finally Made the Business Case
A mill's quality team had proposed an improvement project targeting a specific defect type for two budget cycles, each time presenting only material loss, which looked too small to justify the investment on its own. Recalculating the same defect's full cost — including rework labor, extra testing, and a customer claim that had occurred twice in the prior year — showed the true cost was several times the material figure alone. The project was approved on the third attempt once the full cost was presented, not because the defect had gotten worse, but because the case finally reflected its real impact — a recalculation iFactory AI's team can help apply to your own pending proposals.
Why Customer Claims Are the Hardest Cost to Estimate — and Often the Largest
Material, rework and testing costs are relatively straightforward to calculate from internal records. Customer claim cost is harder to pin down, since it can include credits, return freight, and a harder-to-quantify relationship cost, but it is often the single largest category when a quality issue actually reaches a customer rather than being caught internally.
Frequently Asked Questions
Calculate the Full Cost Before You Prioritize Your Next Project
iFactory AI calculates material, rework, testing, downtime and claim cost per rejection. Book a walkthrough with your own quality records.