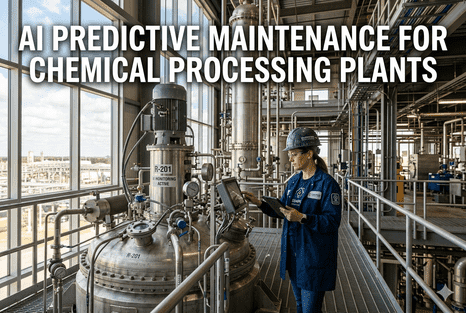
In 2023, a global chemical manufacturer operating a 1,200-acre integrated facility with batch and continuous processes across specialty chemicals, intermediates, and polymers faced a maintenance reliability crisis that was eroding margin, consuming capital, and frustrating plant leadership. Despite a mature CMMS platform, certified reliability engineers, and scheduled preventive maintenance programs, urgent maintenance orders — defined as work orders requiring same-day response to avert production loss, safety risk, or environmental exceedance — had reached 43% of all maintenance activity. Nearly half of every maintenance dollar and every maintenance hour was consumed by reactive, unplanned work that could not be scheduled, could not be optimized, and could not be cost-controlled. Root cause analysis traced the urgent maintenance volume to a structural detection gap: the plant's 33 most critical rotating assets — centrifugal pumps, compressors, agitators, extruders, blowers, and cooling tower fans — were monitored by monthly or quarterly vibration data collection, producing roughly 45 seconds of waveform data per measurement point per month. Incipient bearing degradation, impeller wear, seal deterioration, and coupling misalignment were progressing undetected between measurement intervals, reaching failure condition before the next scheduled data collection. iFactory AI's predictive maintenance platform, including its Shift Logbook and PdM analytics engine, was deployed across all 33 critical assets to close this detection gap with continuous vibration, temperature, and current signature monitoring — reducing urgent maintenance orders from 43% to under 10% within 12 months. Book a Demo to see how iFactory transforms chemical plant maintenance reliability.
The 43% Urgent Maintenance Problem — Why It Exists and Why It Persists
Urgent maintenance is the most expensive form of maintenance activity in any industrial facility, and it compounds across multiple dimensions. The direct labour cost is 2.5–4x higher than planned maintenance due to overtime premiums, call-out charges, and the inefficiency of diagnosing and repairing a failure under production pressure. The parts cost is 1.5–3x higher because emergency procurement — express shipping, premium pricing, minimum order quantities — replaces planned replenishment from stores. The production impact ranges from $12,000 to $120,000 per hour of unplanned downtime depending on process severity, with chemical processes that require steady-state stabilisation periods of 4–24 hours after restart adding additional hidden cost. At 43% urgent maintenance, this plant was incurring these premium costs on nearly half of all maintenance events — a ratio that made it structurally impossible to achieve industry-benchmark maintenance cost as a percentage of replacement asset value.
The root cause, as isolated through the plant's own RCA process, was not a failure of the preventive maintenance program. The CMMS was generating PM work orders on schedule. The vibration analysis contractor was collecting route data monthly. The reliability engineers were reviewing spectra quarterly. The failure mode was a sampling density gap: monthly vibration data collection covering less than 0.001% of each bearing's operating cycles could not detect the incipient spalls that initiate, propagate, and reach functional failure within 50–200 operating hours. The gap between measurement intervals was large enough for an entire bearing failure lifecycle to begin and end without being captured by the monitoring program. iFactory closed this gap by installing continuous wireless vibration and temperature sensors on all 33 critical assets, feeding data at 10-minute intervals to AI models that computed envelope spectra, classified fault severity, and estimated remaining useful life — delivering detection lead times of 2–6 weeks that converted urgent failures into planned interventions.
The 33 Critical Assets — What Was Monitored and What Was Predicted
The deployment covered 33 rotating assets across five process units: feed pumps and compressors on the ethylene oxide unit, agitators and circulating pumps on the intermediates unit, extruder drives and pelletizer motors on the polymers unit, cooling tower fans and circulating water pumps on the utilities unit, and blowers and vacuum pumps on the specialty chemicals unit. Each asset received a wireless triaxial accelerometer and surface temperature sensor transmitting at 10-minute intervals. iFactory's AI models were trained on each asset's baseline vibration signature, load profile, and failure history to establish asset-specific alarm thresholds — eliminating the generic industry thresholds that had been producing false alarms on assets with inherently higher operating vibration.
Centrifugal Pump Bearing and Seal Failure Prediction
Twelve centrifugal pumps — handling process fluids ranging from light hydrocarbons to viscous polymer intermediates — were the largest single asset class in the deployment. Bearing degradation and mechanical seal failure were the dominant failure modes, collectively accounting for 74% of all pump-related urgent maintenance orders. AI models detected bearing spalls via envelope spectrum analysis with 2–5 week lead time and seal degradation via vibration amplitude at impeller pass frequency combined with temperature trend deviation. Six pump failures were predicted and prevented in the first 6 months, each avoiding 8–24 hours of unplanned production downtime at $18,000–$45,000 per hour depending on process unit.
Centrifugal and Reciprocating Compressor Monitoring
Six compressors — two centrifugal process gas compressors and four reciprocating air compressors — represented the highest safety-criticality asset group. A centrifugal compressor unplanned failure could trigger a process unit shutdown lasting 3–7 days. AI models monitored casing vibration, bearing temperature, discharge pressure pulsation, and motor current signature. Two reciprocating compressor valve failures were predicted 3–4 weeks in advance, enabling scheduled valve replacement during planned maintenance windows rather than emergency shutdowns that would have cost $28,000–$55,000 per event in production loss.
Agitator, Mixer and Blender Mechanical Health
Eight agitators and high-shear mixers across the intermediates and specialty chemicals units were monitored for gearbox degradation, shaft wear, and impeller balance. Agitator gearbox failures were particularly costly — each unplanned failure required vessel drain-down, manway entry, and confined-space work that added 12–24 hours of ancillary downtime beyond the repair itself. AI models detected incipient gear tooth wear via gear mesh frequency harmonic trending and shaft imbalance via 1× RPM amplitude tracking, providing 3–6 week predictive lead time.
Extruder Drives, Pelletizers, Cooling Tower Fans, and Blowers
The remaining seven assets covered a diverse set of rotating equipment. Extruder drive gearboxes on the polymers unit were monitored for thrust bearing degradation and screw wear. Pelletizer motor current signature analysis detected cutter wear and feed fluctuations. Cooling tower fan gearboxes were monitored for lubrication degradation and shaft alignment drift. Blower and vacuum pump bearing and vane wear was detected through a combination of vibration envelope analysis and temperature trending. Each asset class had custom AI model parameters calibrated to its specific failure physics and operating profile.
The Transformation — From Reactive Firefighting to Planned Intervention
The most significant operational change observed in the 12-month deployment was not the reduction in urgent maintenance ratio — though that was the headline metric — but the structural shift in how the maintenance team allocated its time and resources. At Month 0, the maintenance team of 28 technicians and 6 engineers was operating in a reactive mode: 43% of work orders arriving as urgent, requiring immediate resource reallocation from planned work, creating a vicious cycle where deferred planned work generated more urgent failures, consuming more planned maintenance time. At Month 12, with urgent maintenance at 9.7%, the same team was consistently executing 85%+ of planned maintenance on schedule, completing condition-based work orders with 2–6 weeks of lead time, and had eliminated 90%+ of emergency procurement events. The maintenance planner's weekly meeting shifted from "which fire do we fight today" to "which predicted failure do we schedule for next month's outage."
Year 1 Financial Results — The Business Case for PdM Deployment
The total Year 1 investment for the 33-asset PdM deployment — including wireless sensor hardware, iFactory platform subscription, CMMS integration, and engineering support — was $184,000. The total Year 1 maintenance cost savings, validated through the plant's internal cost accounting system, was $2.47M, producing an ROI of 13.4:1 in the first 12 months. The savings were driven by three primary mechanisms: elimination of emergency procurement premiums, reduction in overtime labour, and avoidance of production loss from unplanned downtime. The plant's maintenance cost as a percentage of replacement asset value declined from 4.8% at Year 0 to 3.3% at Year 12 — moving from below-average to top-quartile performance against the Solomon Associates chemical industry benchmark.
| Cost Category | Pre-Deployment (Year 0) | Post-Deployment (Year 1) | Savings | Primary Driver |
|---|---|---|---|---|
| Emergency parts procurement | $892,000 | $134,000 | $758,000 | Planned replacement with 2–6 week lead time |
| Overtime and call-out labour | $1.14M | $412,000 | $728,000 | Scheduled vs emergency maintenance execution |
| Production loss — unplanned downtime | $3.62M | $2.12M | $1.50M | 41% reduction in unplanned downtime hours |
| Contractor vibration analysis | $96,000 | $24,000 | $72,000 | Reduced route frequency; AI augmenting analyst |
| Total maintenance cost | $5.75M | $3.69M | $2.06M | 31% total maintenance spend reduction |
Expert Perspective
In 22 years of process reliability engineering across specialty chemical and refining operations, I have never seen a plant achieve a 33-point reduction in urgent maintenance ratio within 12 months using traditional reliability methods. The reason is structural: monthly vibration data collection cannot detect bearing degradation that initiates, propagates, and reaches failure within 50–200 operating hours. The detection gap is built into the sampling interval. What this deployment demonstrated is that the gap is not a technology problem — wireless sensors and cloud AI platforms have been commercially available for years. The gap was the absence of a deployment model that paired continuous monitoring with CMMS-native work order generation and Shift Logbook integration, creating a closed loop from condition detection to intervention execution. The plant's reliability engineers did not become better analysts. They were already skilled. What changed is that they received 2–6 weeks of advance notice on equipment failures instead of finding them after they occurred. The 13.4:1 ROI is impressive but not surprising — it is the predictable result of eliminating the cost premiums that urgent maintenance inherently carries. The question every chemical plant with urgent maintenance above 20% should be asking is not whether the technology works, but why they are still waiting for their next failure to arrive on an emergency work order.
Key Takeaways for Chemical Plant Reliability Leaders
Five operational insights from this 33-asset deployment that apply broadly across chemical manufacturing facilities evaluating PdM modernization.
Monthly vibration data collection captures under 0.001% of a bearing's operating cycles. Incipient spalls initiate and propagate within 50–200 operating hours — the detection gap between measurement intervals is large enough for an entire failure lifecycle to complete.
Generic ISO 10816 velocity limits produce false alarms on assets with inherently higher operating vibration. Asset-specific baselines calibrated during a 14-day data collection period eliminated false alarms and built operator trust in the AI alert system.
AI predictions without CMMS-native work order generation create process friction. Auto-generated work orders with asset ID, fault type, RUL estimate, and recommended spares converted AI alerts into completed maintenance actions within the existing work management workflow.
4-week shadow mode comparing AI predictions against actual equipment condition without triggering work orders eliminated false positive risk and built maintenance team confidence before automated alerting was enabled in production.
Conclusion: The Urgent Maintenance Ratio Is the Diagnostic
The urgent maintenance ratio is the single most informative metric in any chemical plant's maintenance program — it directly measures the proportion of maintenance activity that is reactive, unplanned, and premium-cost. An urgent maintenance ratio above 25% indicates a structural detection gap: the condition monitoring program is collecting data too infrequently to detect the failure modes that drive the majority of emergency work. This 33-asset deployment demonstrated that closing that detection gap with continuous AI monitoring is not a theoretical exercise — it is a repeatable, economically justified intervention that delivered a 33-point reduction in urgent maintenance ratio within 12 months, a 2.06:1 reduction in total maintenance spend, and a 13.4:1 ROI. The technology — wireless sensors, cloud AI, CMMS integration — is commercially available and production-proven. The question for chemical plant reliability leaders is not whether the technology works. It is whether the organization is willing to deploy it at the scale required to move the urgent maintenance ratio from reactive territory into the planned maintenance zone where reliability programs achieve top-quartile performance. Book a Demo to assess your plant's urgent maintenance ratio and build a deployment plan for the critical assets that are driving your emergency work order volume.
Frequently Asked Questions
A traditional vibration analysis program expansion adds more measurement points to the monthly route-based data collection schedule and potentially hires additional certified analysts to review the increased data volume. This approach increases the volume of periodic data but does not close the fundamental sampling density gap — each measurement point still captures only 30–60 seconds of waveform data per month, representing less than 0.001% of bearing operating cycles. The iFactory AI approach changes the data ingestion model from periodic to continuous: wireless sensors transmit vibration and temperature data at 10-minute intervals, and AI models process every data point automatically, generating alerts based on envelope spectrum fault frequency trending, four-stage severity classification, and remaining useful life estimation. The existing vibration analysis contractor can continue providing periodic route-based data for non-critical assets; the AI layer covers the 33 most critical assets with continuous monitoring that periodic expansion could never match.
Production-grade AI predictive maintenance for chemical plant rotating assets covers four dominant failure categories: bearing degradation (inner race, outer race, rolling element, and cage faults detected via envelope spectrum analysis of BPFO, BPFI, BSF, and FTF frequencies with 2–6 week lead time), mechanical seal and packing wear (detected via vibration amplitude at impeller pass frequency correlated with temperature trend deviation and process fluid detection, with 1–3 week lead time), coupling misalignment and shaft imbalance (detected via 1× RPM amplitude trending and phase analysis, with 2–6 week lead time), and gearbox tooth wear and lubricant degradation (detected via gear mesh frequency harmonic trending and oil analysis correlation, with 4–6 week lead time). Each failure mode is detected, classified, and severity-trended independently across four standard progression stages with confidence scores and remaining useful life estimates updated every 10 minutes.
iFactory's platform integrates with both existing and new sensor infrastructure. For assets already equipped with accelerometers connected to a PLC, SCADA, or condition monitoring system, iFactory ingests data via OPC UA, Modbus TCP, or API integration — no new sensors required. For assets without existing continuous monitoring — which was the case for 28 of the 33 assets in this deployment — wireless triaxial accelerometer and temperature sensor kits are installed during a scheduled service window. The wireless sensors used in this deployment have a 5-year battery life and transmit at 10-minute intervals to an edge gateway connected to the iFactory cloud platform. For assets in hazardous areas (ATEX/IECEx Zone 1 or Class I Div 2), intrinsically safe sensor variants are available. The deployment philosophy is to maximise reuse of existing infrastructure while adding sensors only where the coverage gap exists.
Variable-speed drives and batch process operations present the most challenging operating condition for any vibration analysis program — fault frequency amplitudes vary with speed and load, making fixed-threshold alarming unreliable. iFactory addresses this challenge through load-condition normalisation: each asset's AI model learns the relationship between speed, load, and vibration amplitude during the 14-day baseline period, then normalises all subsequent measurements to a reference condition before comparing against thresholds. A bearing fault amplitude at 50% load is scaled to the equivalent amplitude at 100% load before the fault severity classification is applied. This eliminates the false alarms that fixed-threshold systems generate when a variable-speed drive ramps up or a batch process moves between fill, reaction, and discharge phases. For assets with highly variable operating profiles, the baseline period can be extended to 28–42 days to capture the full range of operating conditions across multiple batch cycles.
For a typical chemical plant deployment covering 25–40 critical rotating assets with existing CMMS and basic SCADA infrastructure, the total investment ranges from $145,000 to $225,000 for a 10–14 week implementation. The cost breakdown includes wireless sensor hardware ($25,000–$45,000 depending on hazardous area requirements), iFactory platform subscription including AI model training and CMMS integration ($85,000–$130,000 for Year 1), and engineering support for installation, configuration, training, and 30-day supervised operation ($35,000–$50,000). The implementation timeline follows the five-stage process — sensor installation and baseline (weeks 1–3), AI model training and validation (weeks 3–5), shadow mode (weeks 5–8), CMMS integration go-live (weeks 8–11), and continuous improvement ramp (weeks 11–14). ROI is typically demonstrated within 90 days of go-live through the first prevented urgent failure event. This deployment delivered a 13.4:1 ROI in Year 1, with payback achieved in Month 5. Book a Demo for a personalised investment projection based on your plant's critical asset inventory and urgent maintenance history.