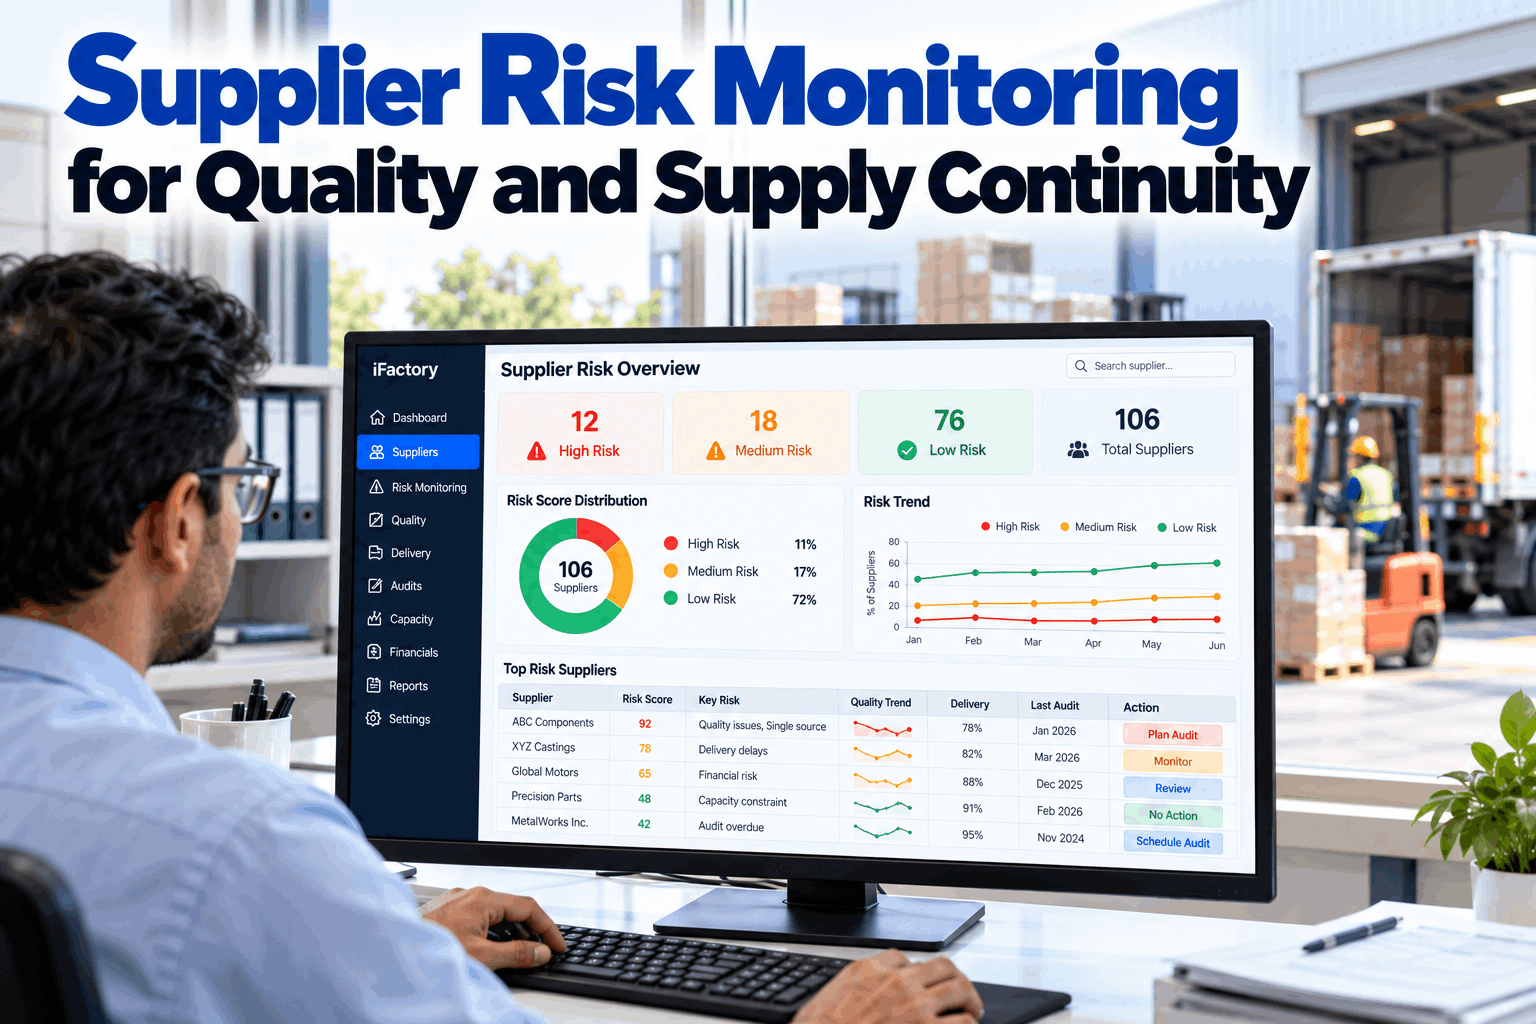
Most supply disruptions give warning before they hit: quality starts to slip, deliveries run late, audit findings pile up, and a single-source part sits on a supplier that is running out of capacity. The trouble is that those signals live in different systems and nobody sees them together until the line is short. Supplier risk monitoring brings them into one score so buyers can act early, which you can see in a short live demo.
See Supplier Risk Building Before It Becomes a Shortage
iFactory's Supplier Risk Agent blends quality, delivery and audit data into one risk score per supplier. It flags single-source exposure, spots capacity warning signs and suggests audits, so buyers and supplier quality teams act weeks earlier.
A Scorecard Looks Back. Risk Monitoring Looks Ahead.
Supplier scorecards measure what already happened: last quarter's PPM, on-time delivery and SCAR count. They are essential, but they are lagging indicators. Risk monitoring asks a different question: what is likely to go wrong next, and how badly would it hurt us? A supplier with a good scorecard can still be a serious risk if it is the only source of a critical part and is running at full capacity. The reverse is also true: a supplier with a few recent defects may be low risk if the parts are easy to resource and the trend is already improving. Treating the two views separately stops good suppliers being penalized for a bad month while a quiet risk builds elsewhere. Our supplier quality team can help you separate the two views.
- Quality PPM and defects
- On-time, in-full delivery
- SCAR count and response
- Reviewed monthly or quarterly
- Direction of quality and delivery trends
- Single-source and critical-part exposure
- Capacity, audit and continuity signals
- Refreshed continuously as data arrives
Six Signal Families That Feed a Supplier Risk Score
No single metric predicts supply trouble reliably. A useful risk score combines several families of signals, each weighted by how much it matters for your parts. Most of this data already exists across receiving inspection, ERP, the SCAR system and audit records. It just isn't looked at together. The value comes from combinations. A slight rise in PPM on its own is noise, but the same rise on a single-source part from a supplier whose lead times are also growing is a pattern worth acting on. We can map your data sources in a working session.
Direction and speed of change in PPM, receiving rejects and repeat defects, not just the current level.
On-time, in-full performance sliding, pushed-out ship dates and growing expedites.
Open major findings, overdue actions, late or weak 8D responses and repeat SCARs.
Single-source and sole-source parts, critical characteristics and the time it would take to qualify another source.
Rising lead times, partial shipments, allocation notices and your demand growing faster than their output.
Financial health indicators, location and logistics risks, and key changes such as ownership or site moves.
An Example Risk Score Model
The model below is a starting structure, not a standard. Set weights to reflect what hurts your operation most. For many manufacturers, sourcing exposure and quality trend carry the most weight because they decide how hard a problem would hit. Keep the model simple enough that a buyer can explain why a supplier scored the way it did. Calibration matters too. Check the model against suppliers that actually caused disruptions in the past two years, and if it wouldn't have flagged them early, adjust the weights before you rely on it. Our support team can help you calibrate weights against past disruptions.
Ask Which Suppliers Need Attention This Quarter
The Supplier Risk Agent explains every score, ranks where an audit or a second source would reduce the most risk, and answers buyers' questions in plain language.
Where Single-Source Risk Really Lives
Single-source parts aren't all equally dangerous. Exposure depends on how critical the part is and how hard it would be to replace the supplier. Plotting parts on these two axes shows quickly where to concentrate effort: dual sourcing, safety stock or closer monitoring. Replacement difficulty should include the real cost of switching, such as tooling, PPAP or validation, customer approval and the lead time to qualify a new source, not just whether another supplier exists. You can see the map built from your own item master in a short demo.
Qualify a second source, hold safety stock, audit regularly and monitor weekly.
Keep a pre-approved second source and watch quality and delivery trends.
Track lead times and allocation signals and plan longer-term options.
Rely on the standard scorecard and review once a year.
A Response Playbook for Each Risk Tier
A risk score is only useful if each tier triggers a clear, proportionate response. Set the playbook in advance so the action doesn't depend on who happens to be looking at the dashboard. Each tier should name an owner, a first action and a review date, so a supplier moving up a tier always sets something in motion. Our support team can configure tier thresholds and owners.
Standard scorecard review, annual audit cycle, no extra action.
A review call with the supplier, trend reported to the buyer and an audit date brought forward.
An on-site process audit, a recovery plan with dates and safety stock on critical parts.
Second-source qualification started, controlled shipping considered and leadership informed.
Leading Indicators Buyers Often Miss
The signals that come first are usually small and easy to dismiss one at a time. Seen together, and trending in the same direction, they are often the clearest warning you will get. Many of them never reach a formal report, because each one looks too minor to escalate. The agent watches for these combinations across every supplier, so a buyer doesn't have to notice them by chance. If you'd like to see which of these show up in your data, book a data review.
One Risk View, Four Different Jobs
A supplier risk score is shared by several teams, and each one needs something different from it. Designing the views around those jobs is what turns a number into a decision. A buyer needs to know what to negotiate or diversify, while a quality engineer needs to know where to send an auditor. When everyone works from the same score, the buyer, the quality engineer and the plant manager stop arguing about whose data is right and start discussing what to do. We can configure role-based views in a setup session.
Why Supplier Risk Programs Lose Credibility
A risk program is only useful if buyers trust it enough to act on it. These four pitfalls are the usual reasons that trust breaks down, and each one is easier to avoid at the start than to fix once the dashboard has been ignored for a quarter. Our support team can review your current approach against them.
A number with no explanation gets ignored. Every score needs its drivers shown so a buyer can check the reasoning.
Scores refreshed once a quarter arrive after the problem. Signals must flow in as events happen.
Too-sensitive thresholds flag most suppliers as high risk, and the real outliers disappear in the noise.
Without a defined response per tier, a high score becomes a report, not a decision.
Risk Agent, Data Connections and AI Server in One Package
iFactory delivers the Supplier Risk Agent as a turnkey bundle. A pre-configured NVIDIA AI server ships racked and ready with the agent and its connectors pre-loaded, so supplier performance data stays in-house. You rack it, plug in power and Ethernet, and the AI is live. To scope it for your supply base, request a turnkey quote.
- Pre-configured NVIDIA AI edge server, racked and ready
- Connectors for ERP, receiving inspection, SCAR and audit records
- Risk model with your weights and tier thresholds
- Cabling and plant network setup
- Buyer and supplier quality dashboards
- Training for purchasing and quality teams
- 24×7 remote monitoring
Server installed, supplier, item and performance data connected and cleaned.
Weights calibrated against past disruptions, scores reviewed with buyers.
Tier playbooks switched on, teams trained and quarterly reviews built in.
A Supplier Risk Agent That Explains Every Score
iFactory brings supplier quality, delivery and audit data into one forward-looking view and turns it into actions buyers can take. Our support team can review your current supplier monitoring before a pilot.
What Buyers and Supplier Quality Teams Ask
Act on Supplier Risk Weeks Earlier
Blend quality, delivery and audit signals into one explainable score, map single-source exposure and get clear suggestions for audits, safety stock and second sources. The full system is delivered turnkey and goes live in 6 to 12 weeks.