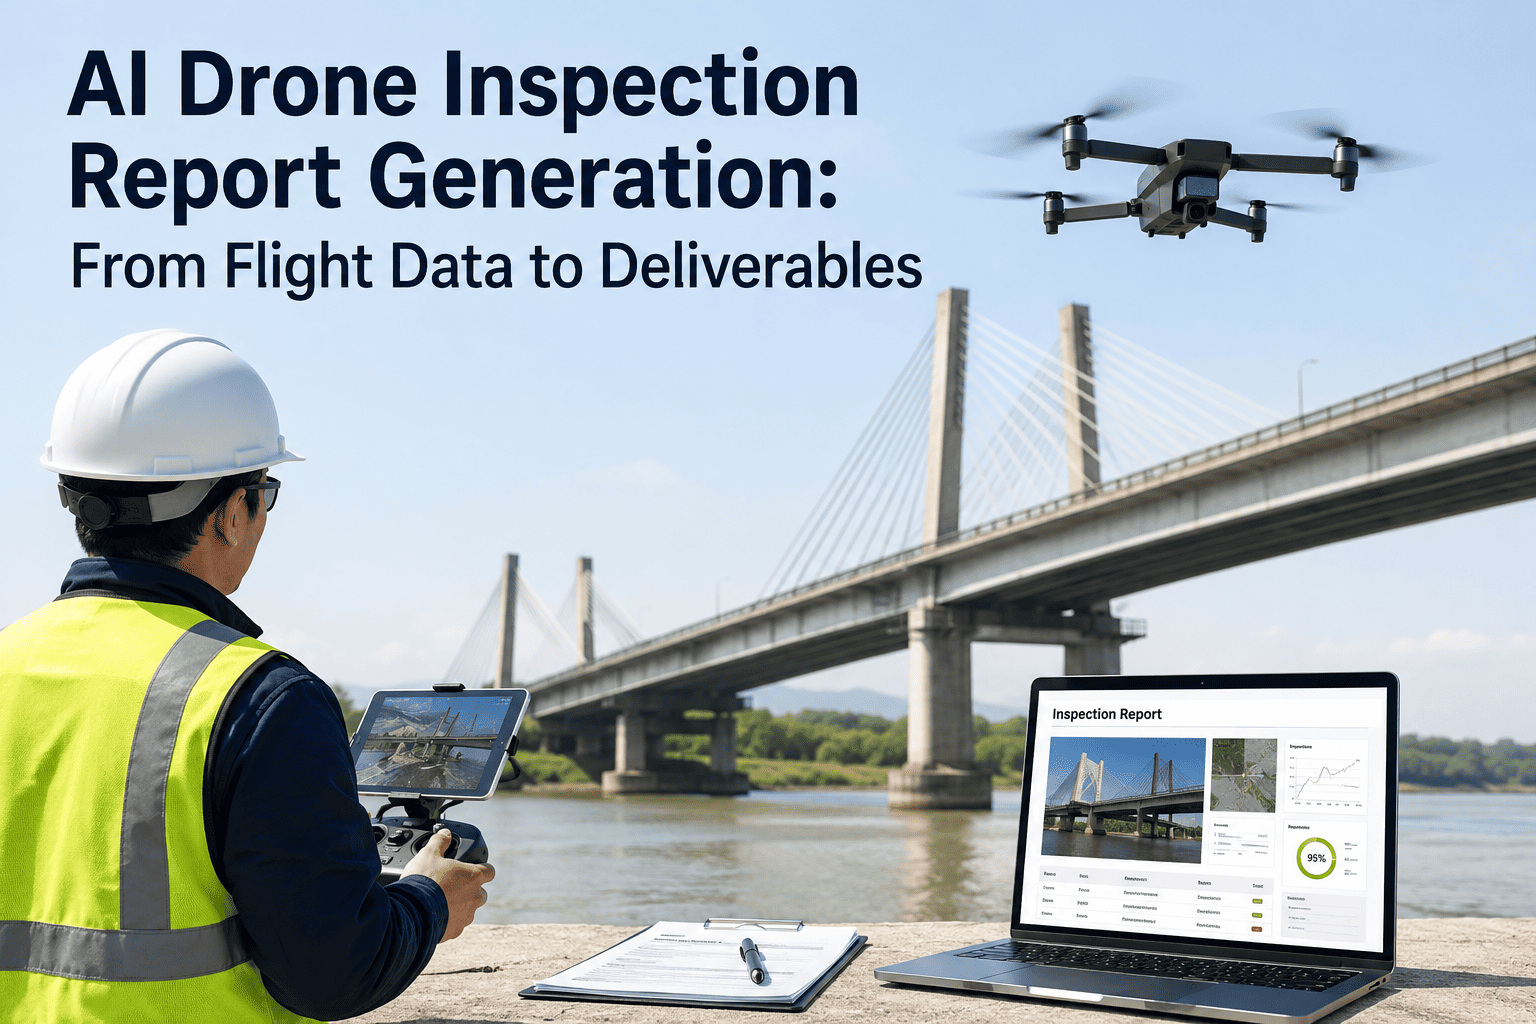
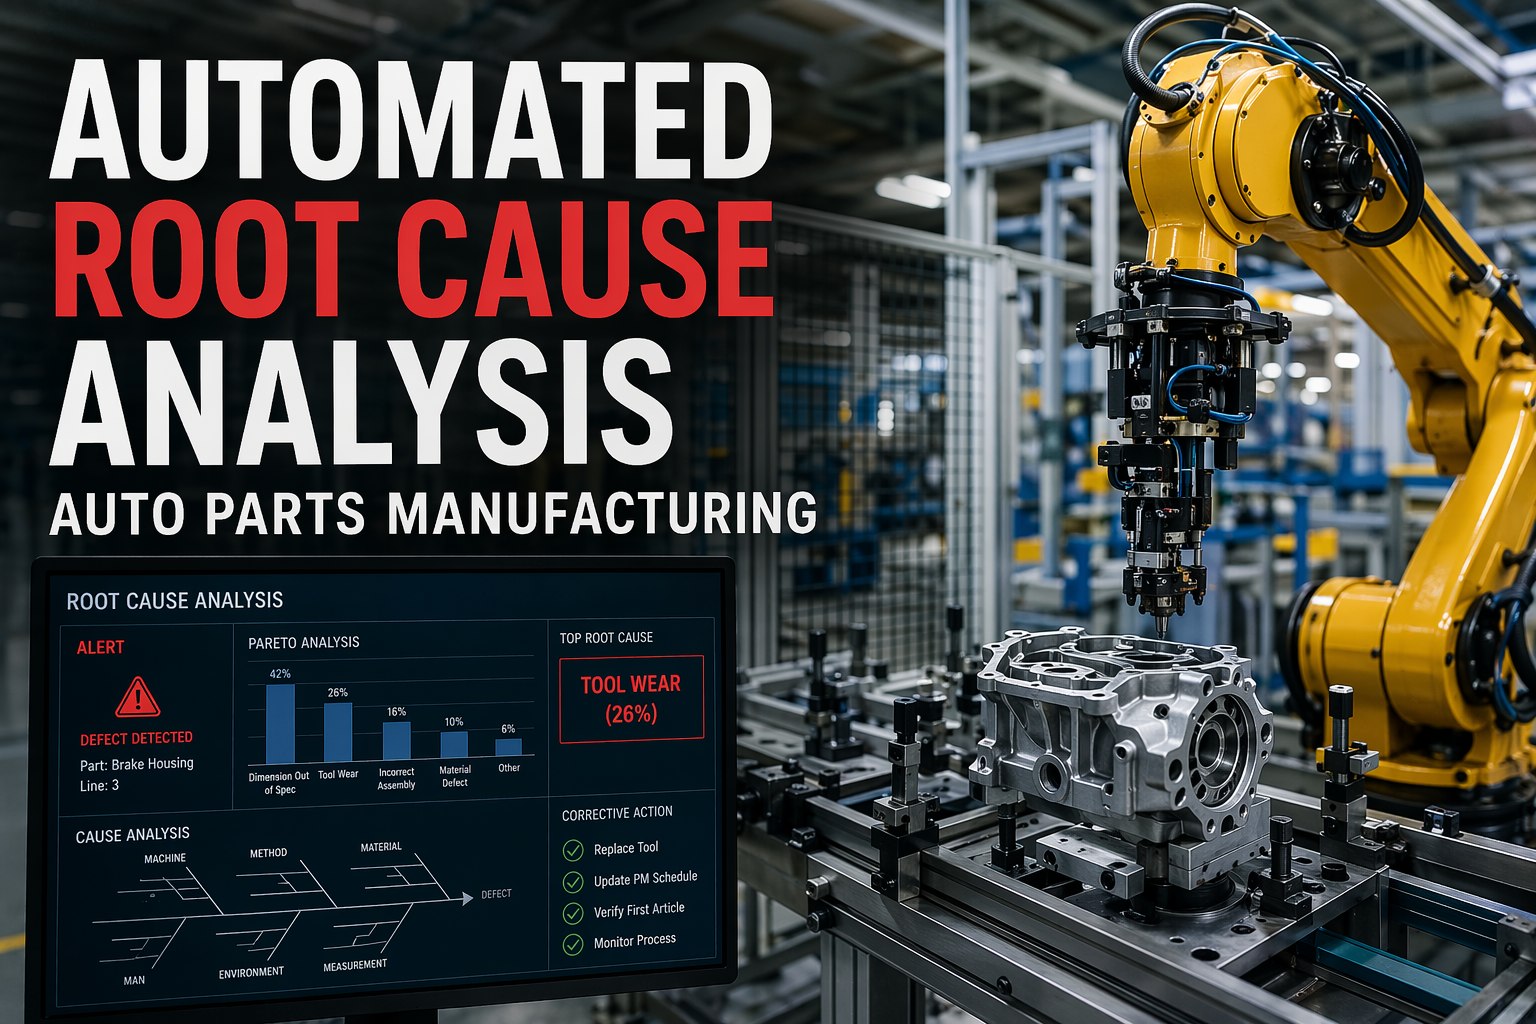
The flight takes twenty minutes. The report takes three days. That gap is the real bottleneck in most drone inspection programs, and it has nothing to do with drone hardware, which has been mature for years. It's what happens after the drone lands: an analyst scrolling through thousands of images, manually classifying defects, typing coordinates into a spreadsheet, and formatting a document a client can actually use. AI report generation collapses that gap, turning flight data into a finished, annotated deliverable within hours instead of days. Book a demo to see a flight turned into a finished report in real time.
DRONE INSPECTION · REPORT GENERATION
The Deliverable Isn't the Flight. It's the Report.
Clients don't pay for aerial footage, they pay for a document that tells them exactly what's wrong, where, and how urgent it is. AI closes the gap between landing the drone and delivering that document.
Hours
Typical AI-assisted turnaround vs. days for manual review
1,000s
Images from a single flight an analyst would otherwise review by eye
95%+
Defect classification accuracy reported in published AI inspection studies
WHERE THE TIME ACTUALLY GOES
The Flight Was Never the Bottleneck
Drone hardware and flight execution have been reliable for years, autonomous flight paths, stable gimbals, and high-resolution sensors are a solved problem. What hasn't been solved at most operations is everything that happens after landing: reviewing thousands of frames, deciding which ones show a real defect versus a shadow or reflection, writing consistent descriptions, and assembling it all into something a client can act on without a phone call to ask what a finding actually means. That post-flight work routinely takes far longer than the flight itself, and it's the reason enterprise clients expecting predictable turnaround move to whichever provider can actually deliver it.
2
Image review
Hours to days
3
Classification & write-up
Hours to days
4
Report delivered
Days later
FOUR THINGS A REPORT ACTUALLY NEEDS
What "Automated" Should Mean, Not Just a Faster PDF
A report generated in an hour isn't useful if it's missing what the client needs to act on. These are the four components that separate a genuinely usable inspection deliverable from a folder of raw photos with a cover page.
01
Annotated Imagery
Every flagged defect is marked directly on the image it appears in, with a bounding box or highlight, not described in a separate paragraph the reader has to cross-reference back to a photo number.
02
Defect Classification
Each finding is sorted into a consistent category, corrosion, crack, delamination, hotspot, whatever taxonomy fits the asset, applied the same way on image one and image three thousand.
03
Severity Ratings
A finding without a severity rating forces the reader to guess whether it needs action this week or can wait until next cycle. Every defect gets a consistent rating a maintenance lead can triage against.
04
GPS Coordinates
Every defect is pinned to an exact location, not "somewhere on the north roof section," so a field crew can walk straight to the point of interest instead of re-surveying the whole asset.
MANUAL REVIEW VS AI-GENERATED REPORTS
What Changes When the Report Writes Itself
The comparison isn't about whether a skilled analyst can produce a good report manually, experienced analysts often do. It's about whether that quality holds consistent at scale, and whether the client gets it in hours or waits the better part of a week.
| Report Component | Manual Process | AI-Generated |
| Image review |
Analyst scrolls thousands of frames by eye |
Every frame processed automatically |
| Defect classification |
Judgment call, varies analyst to analyst |
Consistent taxonomy, every finding |
| Severity rating |
Subjective, depends on who's reviewing |
Applied uniformly across the dataset |
| Coordinate logging |
Manually transcribed from GPS tags |
Extracted and mapped automatically |
| Typical turnaround |
Days, sometimes over a week |
Hours from flight completion |
| Consistency across analysts |
Varies with fatigue and experience |
Same standard applied every time |
FROM LANDING TO DELIVERABLE
How a Flight Actually Becomes a Report
This is the pipeline that runs between the drone landing and a finished report reaching the client's inbox, and it's designed to run with minimal manual intervention at every step.
1
Imagery uploaded automatically. Flight data, including GPS tags and metadata, transfers from the drone to the processing pipeline as soon as the mission completes.
2
Every frame processed. Computer vision models scan the full image set, not a sample, flagging anomalies against the asset's known defect classes.
3
Findings classified and rated. Each flagged defect is assigned a type and severity, with a confidence score attached so ambiguous findings get routed to human review rather than silently included or dropped.
4
Report assembled automatically. Annotated images, classifications, severity ratings, and GPS coordinates are compiled into a structured document formatted for the client, not a raw data dump.
5
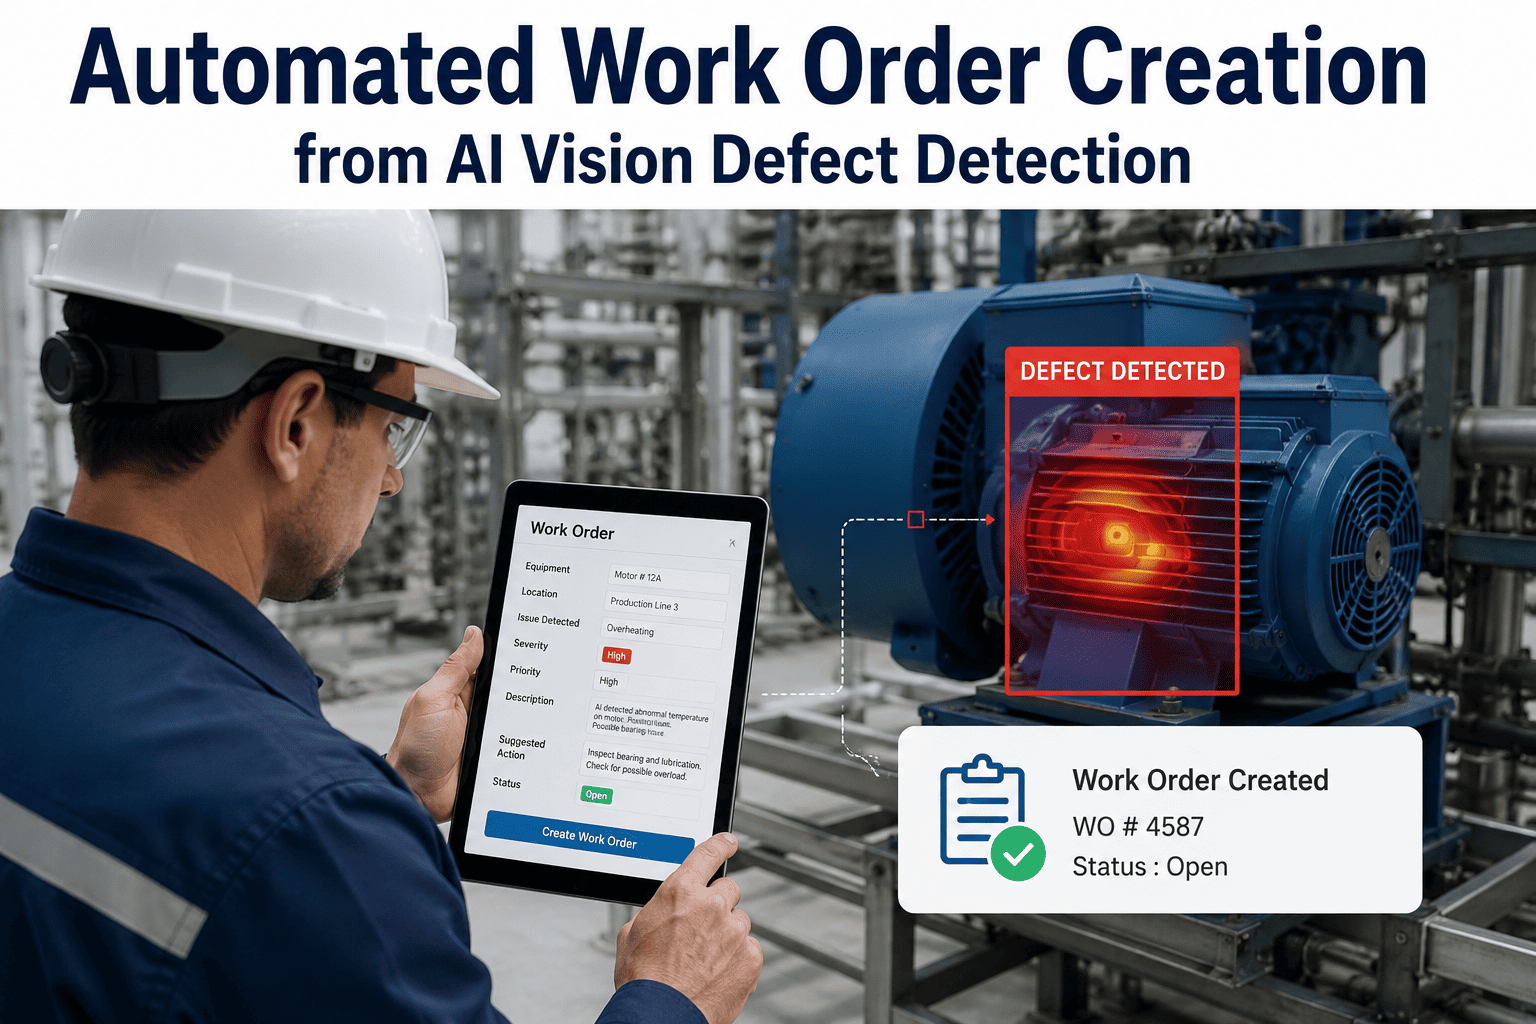
Delivered within hours. The finished report reaches the client or feeds directly into a CMMS as prioritized work orders, well inside the same day the flight happened.
WHERE THIS SHOWS UP ACROSS INDUSTRIES
The Same Bottleneck, Different Assets
Whatever the asset, the pattern repeats: the drone captures the data quickly, and the report is what actually determines how fast a client can act on it.
Solar Farms
Thermal imagery flags hot spots and diode failures across thousands of panels, with each finding mapped to an exact panel location for repair crews.
Roofing & Building Envelope
Flashing failures, membrane damage, and ponding water are annotated directly on orthomosaic imagery for insurance and facilities teams.
Utility & Transmission Infrastructure
Tower and line inspections generate georeferenced defect maps crews can navigate to directly, cutting corridor analysis time significantly.
Industrial Tanks & Structures
Roof plate corrosion, seal integrity, and structural anomalies are logged to a persistent registry that trend-compares against prior inspection cycles.
Cut Report Turnaround From Days to Hours
We'll show you what a same-day inspection deliverable looks like for your specific asset type and reporting format.
MISTAKES THAT UNDERMINE THE DELIVERABLE
Six Ways Automated Reporting Falls Short
Automating report generation isn't automatically an improvement if the underlying process has gaps. These are the recurring ways a fast report still fails the client it's meant to serve.
Speed without a confidence check
A report generated fast but full of false positives erodes trust faster than a slow, accurate one ever would.
Raw data dressed up as a report
A folder of annotated images without severity ratings or a summary still forces the client to do the triage themselves.
Inconsistent taxonomy across flights
If "moderate corrosion" means something different from one inspection cycle to the next, trend analysis across cycles becomes unreliable.
No routing for ambiguous findings
A system with no way to flag low-confidence detections for human review either buries real defects or drowns the report in false alarms.
Reports that don't connect to action
A well-formatted PDF that doesn't feed into a CMMS or work order system just becomes another document someone has to manually re-key.
No historical comparison
A report that doesn't reference the prior inspection cycle can't tell the client whether a defect is new, growing, or already being addressed.
BEFORE YOU START
Readiness Checklist for Automated Report Generation
These are the basics worth confirming before a deployment, so the first automated report is a genuine improvement rather than a fast version of an incomplete process.
Defect taxonomy and severity scale defined and agreed with the team that will act on the reports
Report format and delivery method confirmed, whether that's a client-facing PDF, a portal link, or direct CMMS integration
Confidence threshold set for routing ambiguous findings to human review before they reach the client
Historical flight data identified so new reports can reference prior inspection cycles for trend comparison
TURNKEY AI DEPLOYMENT
iFactory Turns Flight Data Into Reports Automatically
iFactory processes drone imagery as part of a turnkey deployment, from ingestion through a finished, formatted deliverable. A pre-configured NVIDIA AI server ships racked and ready, with vision software pre-loaded to your asset's specific defect taxonomy. Rack it, plug power and Ethernet, and the AI is live, turning the next flight's imagery into a finished report within hours.
Pre-configured NVIDIA edge AI hardware, racked and shipped ready to install
Defect classification and severity taxonomy configured to your specific asset type
Report templates formatted to your client or internal reporting standard
Direct integration with CMMS or work order systems for automatic escalation
Confidence-based routing for low-certainty findings to human review
Twenty-four seven remote monitoring from day one of production
DEPLOYMENT TIMELINE
Live in 6 to 12 Weeks From Contract to First Automated Report
Deployment is structured so the system is generating usable reports well before your next scheduled inspection cycle, not months down the line.
Weeks 1-4
Ship, Configure, and Baseline
Hardware ships pre-racked. Defect taxonomy and report template configured, baseline imagery collected from your existing flight archive.
Weeks 5-8
Model Training and Shadow Reporting
Model trained on your specific asset and defect classes. Runs in shadow mode, generating reports validated against your existing manual process.
Weeks 9-12
Go-Live and CMMS Integration
System takes over full report generation, feeding directly into work order systems, plus twenty-four seven remote monitoring active.
FREQUENTLY ASKED QUESTIONS
Questions Drone Programs Ask Before Automating Reports
How fast can we actually get a report after a flight?
Most flights can produce a finished, formatted report within hours of the drone landing, well inside the same working day for a typical inspection, compared with a multi-day turnaround common with manual review. The exact timing depends on image volume and processing load, but the design goal is same-day delivery rather than the days-to-a-week timeline manual analysis typically requires at scale.
Book a demo to see actual turnaround timing against your flight volume.
Does this replace our analysts or just speed them up?
It changes what analysts spend their time on rather than eliminating their role. Instead of manually scrolling through thousands of images looking for defects, the analyst reviews the findings the system has already flagged, particularly the lower-confidence ones routed for human judgment, and focuses their expertise where it actually matters. Most operations find this shifts analysts from repetitive image review toward the higher-value work of validating findings and advising clients on remediation priority.
What happens with defects the AI isn't confident about?
Every finding carries a confidence score, and anything below a defined threshold is routed for human review rather than either silently included in the report or silently dropped. This is a deliberate design choice, since a report that's fast but full of false positives or missed defects undermines the trust that makes automation worth adopting in the first place.
Contact our support team to discuss confidence thresholds for your specific defect classes.
Can reports integrate with our existing CMMS or work order system?
Yes, findings can be mapped directly to asset records and converted into prioritized work orders automatically, rather than requiring someone to manually re-key a PDF report into a separate system. This is often the difference between a report that just documents a problem and one that actually moves a repair crew, since the annotated image, defect classification, and severity rating flow straight into the work order without a manual transcription step.
How does the report handle comparison to previous inspection cycles?
Every defect gets logged to a persistent registry tied to its exact location, so the next inspection cycle can automatically compare against prior findings and flag whether a defect is new, has grown, or has already been addressed. This trend data feeds directly into maintenance planning and CapEx forecasting rather than treating each inspection as a standalone snapshot disconnected from the ones before it.
Book a demo to see cycle-over-cycle comparison on a real asset history.
Turn Your Next Flight Into a Same-Day Report
iFactory processes flight data into finished, annotated deliverables with defect classifications, severity ratings, and GPS coordinates. Book a demo and see the turnaround for yourself.