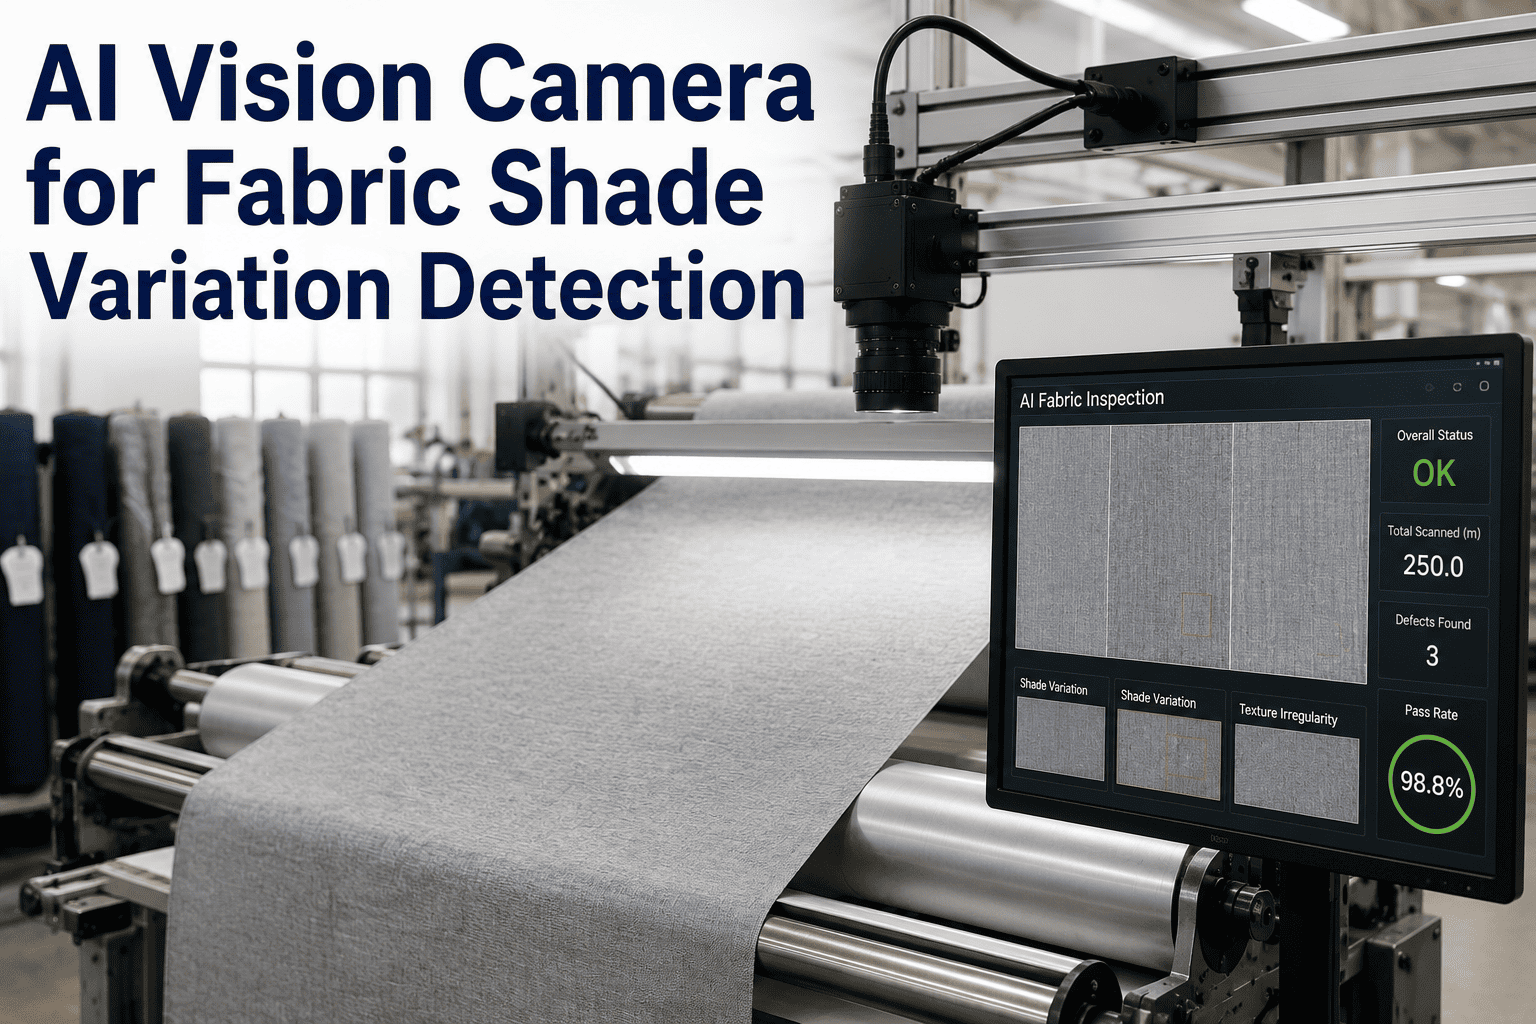
Shade variation is the single most frequent reason textile buyers reject fabric rolls — not structural defects, not contamination, but the color being just slightly off from the approved standard or inconsistent across different parts of the same roll. In most weaving and finishing mills, shade verification still depends on a trained inspector pulling a sample, taking it to a light booth, and making a visual comparison against a physical standard — a process that catches problems only after meters or even hundreds of meters of off-shade fabric have already been produced. AI vision cameras mounted at the winding or finishing line change this by measuring colorimetric values continuously as fabric passes under controlled lighting, generating a per-meter shade profile that flags deviation the moment it occurs rather than after the fact, and a demo can show exactly how that per-meter data maps to your shade sorting workflow.
Textile Quality AI
AI Vision Camera for Fabric Shade Variation Detection: Per-Meter Color Measurement at Line Speed
Replace light booth snapshots with continuous shade profiling — measuring Delta E values across every meter of fabric and sorting rolls before they leave your line.
The Financial Weight of Shipping the Wrong Shade
Shade-related rejections carry a compounding cost that goes far beyond the fabric itself. When a roll fails shade approval at the garment maker or brand's quality lab, the mill absorbs not just the material cost but freight both ways, re-dyeing or replacement production, and the scheduling disruption that pushes other orders behind. For mills running tight delivery schedules — which is most of them — a single shade rejection can cascade into delay penalties across multiple customer orders.
40-60%
of fabric rejections in apparel sourcing are attributed to shade variation, making it the number one quality complaint from brands and garment makers
8-15%
average production cost increase when off-shade fabric requires re-dyeing, including additional chemical consumption and extended processing time
200-500m
average length of off-shade fabric produced between manual inspection points before the deviation is detected and the process is stopped
Six Sources of Shade Variation on the Line
Shade variation does not have a single root cause — it is the cumulative output of multiple process variables that interact differently depending on fabric construction, dye chemistry, and machine condition. Understanding which sources are active in a specific mill is the prerequisite for any effective detection system, because the AI model needs to know what patterns of color drift to look for and where in the process they originate.
Dye Bath Concentration Drift
Gradual change in dye concentration across a batch due to exhausting dyestuff, replenishment timing errors, or inaccurate dosing, producing end-to-end shade variation that worsens as the batch progresses.
Temperature Non-Uniformity in Dyeing
Hot or cold spots within the dyeing machine create localized differences in dye fixation rate, which appear as shade bands or patches across the fabric width rather than along its length.
Fabric Tension Variation
Uneven tension across the fabric width during dyeing, stentering, or calendering alters the surface reflectance and perceived color, producing side-to-side shade variation that is especially visible in piece-dyed fabrics.
Yarn Lot Mixing
Combining yarn from different spinning lots or different dye batches in the same warp or weft introduces inherent color differences at the yarn level that become visible as streaks or bars in the woven fabric.
Steaming and Fixation Time Variation
Inconsistent steam pressure, dwell time, or temperature in continuous fixation machines causes uneven dye development, which shows up as shade differences between the center and edges of the fabric width.
Drying Rate Differences
Non-uniform airflow or temperature across the stenter or drying frame causes differential moisture removal, which affects dye migration and surface color — often the most difficult source to isolate because it interacts with several other variables.
How AI Vision Measures Shade Per Meter of Fabric
An AI vision system for shade detection is built around a controlled imaging environment: one or more line-scan cameras positioned over the fabric path, enclosed lighting that provides consistent and repeatable illumination at a defined color temperature, and a processing pipeline that converts raw pixel data into CIE L*a*b* colorimetric values for every scanned line. The system does not "see" color the way a human does — it measures spectral reflectance at defined wavelengths and maps those measurements to a standardized color space that allows objective comparison against a reference standard.
1
Illumination
Controlled LED or fluorescent lighting at a defined color temperature illuminates the fabric surface within an enclosed inspection zone, eliminating ambient light variation.
2
Line-Scan Capture
Line-scan cameras acquire continuous cross-width image data synchronized to fabric speed, building a full-width color profile for every millimeter of fabric travel.
3
Color Space Conversion
Raw RGB pixel data is converted to CIE L*a*b* values using a calibrated color transform, producing objective colorimetric measurements that correlate with human color perception.
4
Delta E Calculation
Each measurement is compared against the approved reference standard, calculating Delta E values using CMC or CIEDE2000 formulas that weight lightness, chroma, and hue differences perceptually.
5
Shade Map Output
Delta E values are plotted as a continuous shade map across the full roll length and width, with threshold alerts marking any zone that exceeds the customer-specified tolerance.
From Delta E Values to Shade Sorting Decisions
Delta E is the mathematical distance between two colors in the CIE L*a*b* color space — a single number that represents how different the measured fabric is from the approved standard. But a Delta E value alone does not tell the quality team what to do with the roll. The practical decision is shade sorting: grouping rolls into color families that are close enough to each other to be cut and sewn together in the same garment without visible shade difference. AI vision systems automate this sorting by applying the customer's specific tolerance framework to the per-meter measurement data.
Shade Group 1
Delta E 0.0 - 0.5
Virtually indistinguishable from standard. These rolls require no special handling and can be shipped as first quality against the tightest brand specifications.
Shade Group 2
Delta E 0.5 - 1.0
Perceptible difference only under close comparison in a light booth. Acceptable for most garment applications but may need segregation from Group 1 rolls for critical color matches.
Shade Group 3
Delta E 1.0 - 1.5
Noticeable difference to a trained observer. These rolls must be segregated and cut together within the same shade group — mixing with Group 1 or 2 will produce visible garment shade variation.
Shade Group 4
Delta E 1.5 - 2.0
Clearly different from standard. Requires explicit customer approval, typically accepted only for non-critical color applications or as seconds with a negotiated price adjustment.
Beyond Tolerance
Delta E Above 2.0
Outside acceptable shade range for virtually all apparel customers. These rolls are flagged for re-dyeing, downgrading, or rejection — the earlier this is detected, the lower the recovery cost.
Per-Meter Shade Profiling
See AI Vision Sort Fabric Rolls by Shade Group Automatically
A live demo shows how Delta E measurements flow from camera to shade map to roll-level sorting decisions at your line speed.
Manual Light Booth vs AI Vision at Line Speed
The light booth is not going away — it remains the final verification step that auditors and customers expect. But using it as the primary detection method means accepting a fundamental trade-off: you trade measurement frequency for perceived accuracy, inspecting a tiny fraction of the total fabric length and hoping the sample represents the whole roll. AI vision does not replace the light booth — it changes when and how often you need it by catching deviations before they accumulate into roll-level failures.
| Assessment Factor | Manual Light Booth | AI Vision System | Operational Impact |
| Sampling Coverage |
1-3 samples per roll at fixed intervals |
100% of fabric surface scanned continuously |
Eliminates blind spots between sample points |
| Side-to-Side Detection |
Limited to sample width, usually center |
Full-width measurement across entire fabric width |
Catches edge-to-center shade differences samples miss |
| Measurement Objectivity |
Observer-dependent, varies with fatigue and experience |
Calculated Delta E from colorimetric data, no subjective judgment |
Consistent results across all shifts and inspectors |
| Speed of Feedback |
Minutes to hours after fabric is produced |
Real-time, within seconds of fabric passing the camera |
Enables immediate process correction instead of post-production discovery |
| End-to-End Shade Tracking |
Only at sampled points, trend is interpolated |
Continuous Delta E plot for the entire roll length |
Reveals gradual drift patterns that point to specific process issues |
| Shade Sorting Automation |
Manual grouping based on sample comparisons |
Automatic roll assignment to shade groups by Delta E range |
Eliminates sorting errors from manual comparison and record-keeping |
Linking Shade Data Back to Process Root Cause
A shade map that only tells you where the color is wrong is useful, but a shade map that tells you why the color is wrong is transformative. When the AI vision system is integrated with the dyeing and finishing line's process data — dye bath parameters, temperature logs, fabric speed, tension values, stenter settings — the shade deviation patterns become diagnostic clues that point to specific process variables needing adjustment.
Gradual End-to-End Drift
Points To
Dye bath exhaustion, dosing calibration drift, or gradual temperature change across the batch run
Repeating Width Bands
Points To
Stenter or calender roller pressure variation, nozzle blockage in continuous dyeing, or selvedge tension difference
Sudden Step Change
Points To
Yarn lot changeover, dye batch substitution, or a process setpoint adjustment that was not properly documented
Center-Edge Asymmetry
Points To
Drying airflow non-uniformity, steaming zone temperature gradient, or fabric bowing that creates uneven exposure
Where Shade Detection Deployments Lose ROI
The technology for colorimetric measurement with AI vision is well-established — the challenges that undermine ROI are almost always in the deployment details, particularly in how the system is integrated into the physical production environment and the quality team's existing workflow. The gaps below account for the majority of underperforming installations in textile mills.
A
Uncontrolled Lighting Environment
Installing cameras without an enclosed light booth or light-shielding means ambient light — daylight shifts, overhead fluorescent cycling, nearby equipment glare — introduces measurement noise that makes Delta E values unreliable and forces frequent recalibration.
B
No Reference Standard Calibration Protocol
The system must be calibrated against the same physical reference standard the customer approved, using the same illuminant condition, or the AI measurements will not correlate with what the buyer's quality lab measures — defeating the purpose of automated detection.
C
Ignoring Fabric Construction Effects
Different weaves, knits, and surface finishes scatter light differently. A system calibrated on plain weave will produce different Delta E readings on twill or sateen unless the color transform accounts for surface texture — a step that is often skipped during initial setup.
Frequently Asked Questions
Can AI vision detect shade variation on both woven and knitted fabrics?
Yes, but the system configuration differs because woven and knitted fabrics present different surface geometries to the camera. Woven fabrics have a relatively stable, flat surface that allows straightforward line-scan imaging, while knitted fabrics have a three-dimensional loop structure that introduces surface variation that can affect color measurement if not accounted for in the calibration. The AI model needs to be trained or calibrated for the specific fabric construction types the mill produces, and mills running both woven and knitted goods typically maintain separate calibration profiles for each construction category to ensure consistent Delta E accuracy.
A demo can show how the system handles different fabric constructions.
What Delta E tolerance should we set for our AI vision system?
The tolerance is not a technical decision — it is a commercial one defined by your customer's specification. Most apparel brands specify their acceptable Delta E range using CMC or CIEDE2000 formulas, typically between 0.5 and 1.5 depending on the garment type and color criticality. The AI system should be configured to use the exact same formula and tolerance your customer specifies, not a generic threshold chosen by the mill or the system integrator. Setting the tolerance tighter than what the customer requires increases false rejection rates and reduces yield, while setting it looser guarantees shade complaints.
Support can help map your customer specifications to system configuration parameters.
How often does the AI vision system need recalibration?
Recalibration frequency depends on the stability of the imaging environment and the color accuracy requirements of your customers. In a well-controlled installation with enclosed lighting and stable camera positioning, a full recalibration using physical reference standards is typically needed weekly or whenever a new fabric construction or color range is introduced. Between full calibrations, the system should run automated drift checks using an internal reference target to verify that measurements have not shifted — similar to how a spectrophotometer in a lab is verified between formal calibrations. Mills that skip the drift check and rely only on periodic full calibration often discover measurement drift only when a customer complaint reveals it.
Book a demo to see how calibration management works in the system.
Does this replace our spectrophotometer and light booth?
No, and it should not be positioned as a replacement. The spectrophotometer remains the instrument for initial color development, lab dip approval, and formal color measurement records that customers and auditors expect. The light booth remains the final visual verification step. What AI vision replaces is the use of those tools as the primary detection method during production — a role they were never designed for, because they measure points, not continuous length. The AI system catches deviations during production so that the spectrophotometer and light booth are used for verification and record-keeping rather than discovery.
Talk to a specialist about how AI vision fits alongside your existing color measurement tools.
Can the shade data integrate with our existing quality management and ERP systems?
Integration is essential for the system to deliver operational value beyond the inspection point itself. The shade data — per-meter Delta E values, roll-level shade group assignments, and deviation alerts — needs to flow into your QMS for quality record-keeping and into your ERP or production tracking system so that shade group labels follow the roll through downstream processes like cutting and packing. Without this integration, shade data stays in a standalone system and someone has to manually transfer roll-level decisions into the production workflow, which reintroduces the delay and error risk the automated system was supposed to eliminate.
A demo can show how shade data integrates with common textile QMS and ERP platforms.
Stop Relying on Samples
Give Your Quality Team 100% Shade Coverage Instead of Spot Checks
See how iFactory connects AI vision cameras to Delta E measurement, shade sorting, and process root cause analysis in one integrated textile quality workflow.