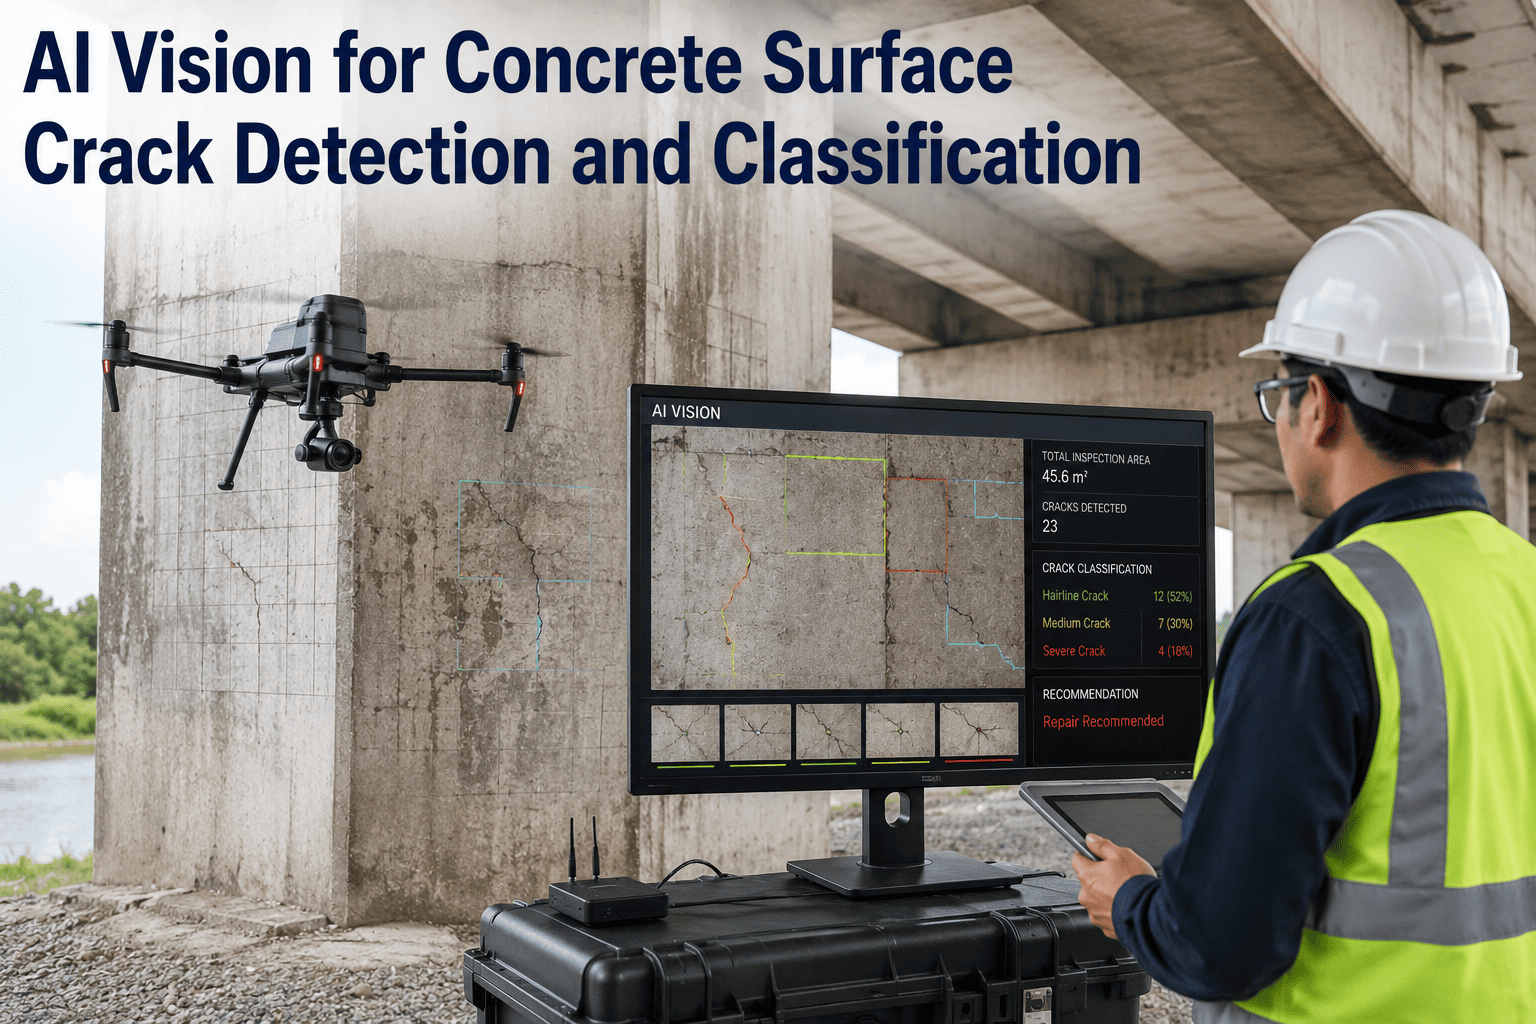
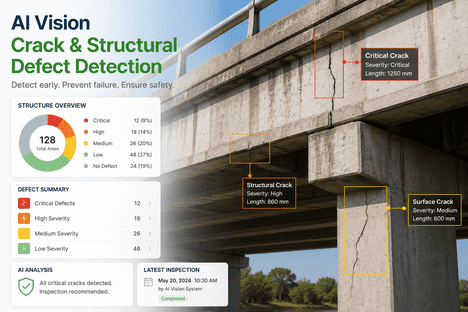
A crack on a concrete surface is a diagnostic clue, not a defect — the pattern, the width, the orientation, and the way it changes over time each carry information about what is happening inside the structure that the crack alone cannot fix. A structural engineer walking a bridge deck, a tunnel wall, or a parking garage slab is doing pattern recognition from experience, and the value of that recognition is exactly what gets lost when the inspection is a decade apart and the person doing the follow-up is not the person who saw it last time. Turning that pattern recognition into a continuous, quantified, comparable measurement is the entire point of vision-based crack analysis, and iFactory does it at the pixel level with classification, width measurement, and propagation tracking built in so every crack has an objective record.
Material Inspection · Structural Condition Assessment
Turn Every Crack Into a Measured, Classified, Trackable Data Point
AI vision segments concrete cracks at pixel level, classifies them by mechanism (structural, shrinkage, settlement, corrosion-induced, and more), measures width and length within sub-millimeter accuracy, and tracks propagation across inspection cycles so structural condition assessment stops being guesswork and starts being an evidence trail every stakeholder can rely on across the full remaining service life of the asset.
Width Severity Spectrum
Reading a Crack Starts With Reading Its Width
Crack width is the single most quoted number in every code, standard, and inspection guideline for concrete — because it maps directly to what the crack is doing to the durability, watertightness, and reinforcement protection of the structure. There is no universal threshold across every code, but there is a broadly recognized progression from cosmetic to serviceability to structural concern that vision-based width measurement quantifies with pixel-level precision instead of leaving it to caliper-and-clipboard variability.
Under 0.1 mm
Hairline
Typically cosmetic, common on any concrete surface, usually from drying shrinkage or thermal contraction.
0.1 to 0.3 mm
Fine
Serviceability concern in aggressive environments, referenced by ACI 224R for exposed and moisture-affected members.
0.3 to 0.5 mm
Moderate
Investigation threshold in most jurisdictions; corrosion protection for reinforcement is materially compromised beyond this range.
0.5 to 1.0 mm
Wide
Active investigation required; strong indicator of structural distress if paired with displacement, spalling, or pattern typology.
Above 1.0 mm
Severe
Structural concern regardless of context; immediate engineer review with load path assessment and monitoring plan required.
Width is necessary but not sufficient. A 0.2 mm crack in a random shrinkage pattern is a different concern from a 0.2 mm crack aligned with a stress trajectory across a beam — and it is that second layer of information, the pattern and orientation, that separates a competent condition assessment from a naive one. Vision classification models catch both dimensions together rather than treating width in isolation.
The width thresholds vary meaningfully across code bodies, and that variation is not a matter of one code being right and another wrong — it reflects genuine differences in the exposure conditions each was written for. ACI Committee 224 puts the maximum allowable crack width for reinforced concrete members exposed to deicing chemicals at 0.18 mm, while Eurocode 2 places the corresponding limit at 0.3 mm for similar exposure. What both agree on is the underlying principle: wider cracks let more chloride and moisture reach the reinforcement, and once that happens, the corrosion process that unfolds is on a timeline measured in years rather than decades. Quantified width measurement gives asset managers the numeric input to enforce whichever code they operate under, rather than translating verbal severity labels between inspection cycles. It also removes the drift that inevitably shows up when different inspectors, at different times, use different subjective descriptors for the same physical crack.
Crack Typology
Ten Mechanisms, Ten Patterns, Ten Different Corrective Actions
Concrete cracks are not one thing. The mechanism that produces them determines the pattern, the timing, the propagation risk, and the appropriate response — which is why classification by mechanism is a first-class output of any serious AI crack analysis rather than an optional add-on. The families below cover the vast majority of what shows up in field inspection, and each has a visual signature a properly trained model separates from the others.
Getting the mechanism right matters because the repair action differs completely between families. Shrinkage cracks accept and continue to develop until the concrete reaches equilibrium moisture, so structural intervention is rarely useful. Corrosion-induced cracks demand halting further chloride ingress before any surface repair is placed, because a cosmetic patch over an active corrosion cell simply hides the problem while it accelerates. Settlement cracks call for subgrade remediation before any resurfacing, and load-induced cracks in structural members flag capacity questions that no amount of crack filler will resolve. Classification is where the analysis moves from "we have cracks" to "we have this specific mechanism and here is what it demands."
Plastic Shrinkage
Early age, hours to days
Random, polygonal, or parallel pattern on freshly placed concrete where surface moisture evaporated faster than bleed water could replace it. Shallow, cosmetic in most cases, but the surface pattern is unmistakable.
Drying Shrinkage
Weeks to months
The most common cause of cracks in existing concrete. Longitudinal or map pattern, usually fine, forms as the concrete continues to lose moisture and contract against restraint from reinforcement or adjacent construction.
Thermal Contraction
Temperature cycles
Cracks from concrete cooling faster than restraint conditions allow, especially in mass concrete or elements exposed to significant temperature swings. Pattern is often perpendicular to the long axis of the element.
Settlement
Subgrade support failure
Vertical displacement across the crack line, orientation varying with the shape and location of the underlying void or soft zone. Distinct from shrinkage because both faces of the crack no longer sit at the same elevation.
Structural Overload
Load-induced flexure
Aligned with the tension face of a bending member, typically perpendicular to the axis of the beam or slab. Displacement follows the bending curvature, and severity correlates with applied load history.
Corrosion-Induced
Long-term durability failure
Parallel to embedded reinforcement, often with visible staining and progressing to spalling as the rebar expands. A signature indicator that chloride ingress or carbonation has already reached the reinforcement.
Alkali-Silica Reaction
Chemical, years to decades
Map-cracking pattern with characteristic gel exudation, from reactive aggregate chemistry rather than external load. Distinctive enough for a trained model to distinguish reliably from unrelated map patterns.
Freeze-Thaw
Climate exposure
Surface scaling, D-cracking near joints, and progressive delamination in structures exposed to freezing cycles without adequate air entrainment. Pattern concentrates near saturated zones and drainage paths.
Chemical Attack
Environmental degradation
Surface deterioration and irregular cracking from sulfate exposure, acid contact, or other aggressive chemistry. Vision distinguishes it from mechanical damage by the surface texture surrounding the cracks.
Spalling
Late-stage failure
Not a crack but the end state several mechanisms progress toward. Layer separation and flaking, often revealing corroded reinforcement underneath. Segmented separately so it does not distort width measurement on adjacent cracks.
From Pattern Recognition to Quantified Data
Stop Losing the Diagnostic Value in Every Crack You Inspect
iFactory turns visual inspection footage from drones, walking surveys, or fixed cameras into pixel-level segmented cracks with mechanism classification, width measurement, and change tracking against every prior inspection.
Quantified Output
What the System Produces for Every Crack It Detects
The output of a vision-based crack analysis is not just "crack detected." Each detected crack becomes a structured record with a dozen parameters attached, all measured directly from the imagery rather than reconstructed from field notes, and all comparable across time because the measurement method is consistent. This is the layer that turns inspection into an asset management input rather than a snapshot in a report.
The reason to capture this many parameters per crack, rather than just a severity label, is that different engineering questions need different subsets of the data. A durability review cares primarily about width and orientation relative to reinforcement. A load-path investigation cares about orientation relative to the member axis and any width variation along the length. A repair planning exercise cares about total length and location so materials can be estimated. Storing everything means the same inspection dataset supports whichever question comes up next, without a return trip to the field to remeasure things that were not written down the first time.
Location
Geospatial coordinates or asset-relative position, tied to a floor plan or bridge station reference
Length
Total centerline length measured by skeletonization of the segmented crack mask
Maximum Width
Widest point measured perpendicular to the crack centerline at sub-millimeter accuracy
Average Width
Mean width across the full length, useful for severity classification against code thresholds
Width Profile
Width variation along the crack, showing whether it widens toward a load path or a support
Orientation
Dominant angle relative to reinforcement direction, member axis, or global coordinates
Mechanism Classification
Predicted crack family with confidence, based on pattern, orientation, and surrounding surface condition
Severity Category
Hairline through severe based on width thresholds referenced to the applicable code
Displacement
Presence and magnitude of vertical or lateral offset across the crack, relevant for settlement diagnosis
Change Delta
Comparison against prior inspection — width growth, length propagation, or new branches
How the Vision Pipeline Works
From Camera Frame to Structural Condition Record
The vision pipeline is a sequence of specialized models rather than a single black-box classifier, and that architecture is deliberate. Each phase does one job well, its output is inspectable, and its assumptions are auditable — which matters enormously when the eventual consumer is a licensed engineer whose stamp goes on the condition report. A model that produces a severity label without showing its work is not something an engineering practice can put its name on; a pipeline that segments, measures, classifies, and change-detects with visible intermediate outputs is.
Phase 1
Image Capture
Imagery arrives from any source — handheld camera, drone survey, fixed pole camera, mobile inspection rig, or tunnel-mounted scanner. Resolution and scale calibration are captured with each frame so measurements translate directly to real-world units.
Phase 2
Detection and Localization
A first-pass detection network identifies frames containing cracks and localizes their bounding regions, filtering out surface variation, form marks, and joints that resemble cracks in isolated images but are distinguishable at region level.
Phase 3
Pixel Segmentation
A segmentation network produces a pixel-accurate mask of the crack, achieving high intersection-over-union scores against ground truth even on complex backgrounds. This is the layer that lets width and length be measured rather than estimated.
Phase 4
Skeletonization and Measurement
Thinning algorithms extract the crack centerline from the mask, letting length be measured directly and width be sampled perpendicular to the centerline at every point along the length rather than at a few caliper positions.
Phase 5
Classification and Severity
The segmented crack plus its measured parameters plus the surrounding surface context feed a classification model that predicts mechanism and severity category. Confidence scores flag borderline cases for engineer review rather than committing to a single label.
Phase 6
Change Detection
New records are registered against prior inspections of the same asset location, and width growth, length propagation, or newly detected cracks are flagged. This is the layer that converts one-off inspection into ongoing condition monitoring.
Inspection Cadence Comparison
Why Continuous Beats Periodic on Structures That Are Supposed to Last a Century
| Approach | Data Cadence | Comparability Across Cycles | Propagation Detection |
| Manual walking inspection |
Every 2 to 10 years |
Depends on inspector consistency |
Only visible on very long intervals |
| Photographic reference logs |
Every 1 to 5 years |
Improved but subjective |
Depends on shot repeatability |
| Drone-based imagery survey |
Every 6 to 24 months |
Consistent camera and altitude |
Good if flight paths repeat |
| AI vision on drone or fixed imagery |
Every 3 to 12 months |
Objective, measurement-based |
Automatic, pixel-registered |
| Continuous fixed-camera monitoring |
Daily to weekly |
Objective, same viewpoint |
Detected in near real time |
The cadence that makes sense depends on the asset. A recently constructed slab on grade probably does not warrant weekly monitoring; a fifty-year-old post-tensioned parking structure with observed corrosion staining almost certainly does. What vision-based analysis unlocks is choice — the same processing pipeline handles imagery collected on any schedule, so cadence can be set by risk rather than by whatever the historical inspection contract happened to specify. Owners of large portfolios also gain the ability to tier assets by risk, running the most critical structures on the shortest cycles and letting stable, low-consequence assets sit on longer intervals, without maintaining three separate inspection processes to make that work.
Where Quantified Crack Data Changes the Conversation
Assets Where This Matters Most
The value case for quantified crack data is strongest where the asset in question represents a large capital commitment, a long expected service life, and a serious safety consequence if condition assessment is wrong. All three conditions apply to the asset classes below, which is where vision-based crack analysis has moved fastest from proof-of-concept into routine practice. The common thread is the same across all of them: an owner responsible for decades of remaining life who needs comparable evidence about how the structure is aging, not a subjective narrative that resets every time the inspection contract changes hands.
Bridges and Overpasses
Deck slabs, girders, piers, and abutments all crack under service loads and environmental exposure. Objective width and propagation tracking is precisely what state departments of transportation need for their asset management systems.
Parking Structures
Chloride exposure from vehicle tracking creates corrosion-driven cracking that progresses to spalling if not caught. Vision tracks the corrosion-parallel crack pattern that manual inspection routinely underestimates.
Tunnels
Lining cracks in road and rail tunnels are challenging to inspect manually and hazardous to access. Vehicle-mounted or drone-based imagery combined with AI analysis is now the standard approach for tunnel condition surveys.
Dams and Hydraulic Structures
Cracks on dam faces, spillways, and lock walls have direct safety consequences. The reach and repeatability of drone imagery plus AI analysis is transforming what these inspections can cover in a single window.
High-Rise and Commercial Buildings
Facade inspections are increasingly mandated by local ordinances and are exactly the type of work drone-plus-AI analysis handles better than rope-access inspection alone. Documentation quality is a further benefit for owners.
Industrial Slabs and Foundations
Heavy equipment, forklift traffic, and load-bearing floors in manufacturing and warehouse facilities crack in patterns that are diagnostic of both load history and subgrade condition. Both matter for planning repair versus replacement.
Common Questions
Frequently Asked Questions
Does the AI vision system replace a licensed structural engineer's judgment on crack severity?
No, and it should not be positioned that way. The system produces quantified, classified, comparable measurements that engineers use to make judgment calls — it does not make the judgment calls itself. Confidence scores flag borderline classifications for engineer review, severity thresholds are configurable to reflect the code and context governing each asset, and every measurement is auditable back to the imagery it came from. The engineer's role becomes reviewing better evidence rather than gathering evidence in the first place.
Talk to support to walk through how the workflow sits alongside licensed engineering review.
How accurate is vision-based width measurement compared to a physical crack gauge?
Modern deep learning approaches routinely quantify cracks as narrow as 0.25 mm with error rates under 10 percent, and multi-task architectures combining detection with semantic segmentation report crack width measurement error under 1 percent in controlled evaluations. Field accuracy depends on imaging resolution, distance to the surface, and lighting, all of which are calibrated during capture. Practical experience is that vision measurement is more consistent than crack gauge readings because it does not depend on the inspector selecting the widest point by eye — it evaluates width across the entire crack length automatically.
Can the system distinguish real cracks from form marks, joints, stains, and other surface features that look like cracks?
Yes — this is exactly what the detection and segmentation layers are trained to do, and modern models achieve high mean intersection-over-union scores against ground truth on complex backgrounds. Joints, form marks, and staining have different geometric and textural signatures than actual cracks, and confidence scores flag cases where the model is uncertain rather than committing to a false positive. Site-specific tuning can further sharpen accuracy when the surface has unusual features common in that asset's construction era.
What imagery sources does the system accept, and does it require specialized cameras to work?
The system accepts imagery from a wide range of sources including handheld cameras, drone survey footage, mobile inspection rigs, fixed pole cameras, and vehicle-mounted or tunnel-mounted scanners. What matters is resolution appropriate to the crack widths of interest and scale calibration so measurements translate to real-world units — both of which are established during the capture phase rather than requiring specialized proprietary hardware. This lets teams use whatever imagery collection method their operation already supports, rather than being forced into a new device purchase to adopt AI-based analysis.
How does propagation tracking work if the imagery from year to year is not shot from exactly the same viewpoint?
Registration against a reference model of the asset is what enables comparison across inspection cycles even when the raw imagery viewpoints differ. Each detected crack is placed in the asset coordinate system rather than only in image pixel coordinates, so a crack at bridge station 24+50 on the north face girder is comparable across drone flights conducted years apart from slightly different flight paths. Cracks new since the last inspection, cracks that grew, and cracks unchanged are separately reported.
Book a demo to see a live propagation comparison on a sample asset.
From Visual Inspection to Structural Data Asset
Every Crack Deserves a Record. Every Record Deserves to Be Comparable.
iFactory turns concrete surface imagery into quantified crack records — classified by mechanism, measured for width and length, and tracked across every inspection cycle so structural condition assessment becomes evidence rather than opinion, and asset owners keep control of their portfolio decisions across the full remaining service life of every structure they operate.