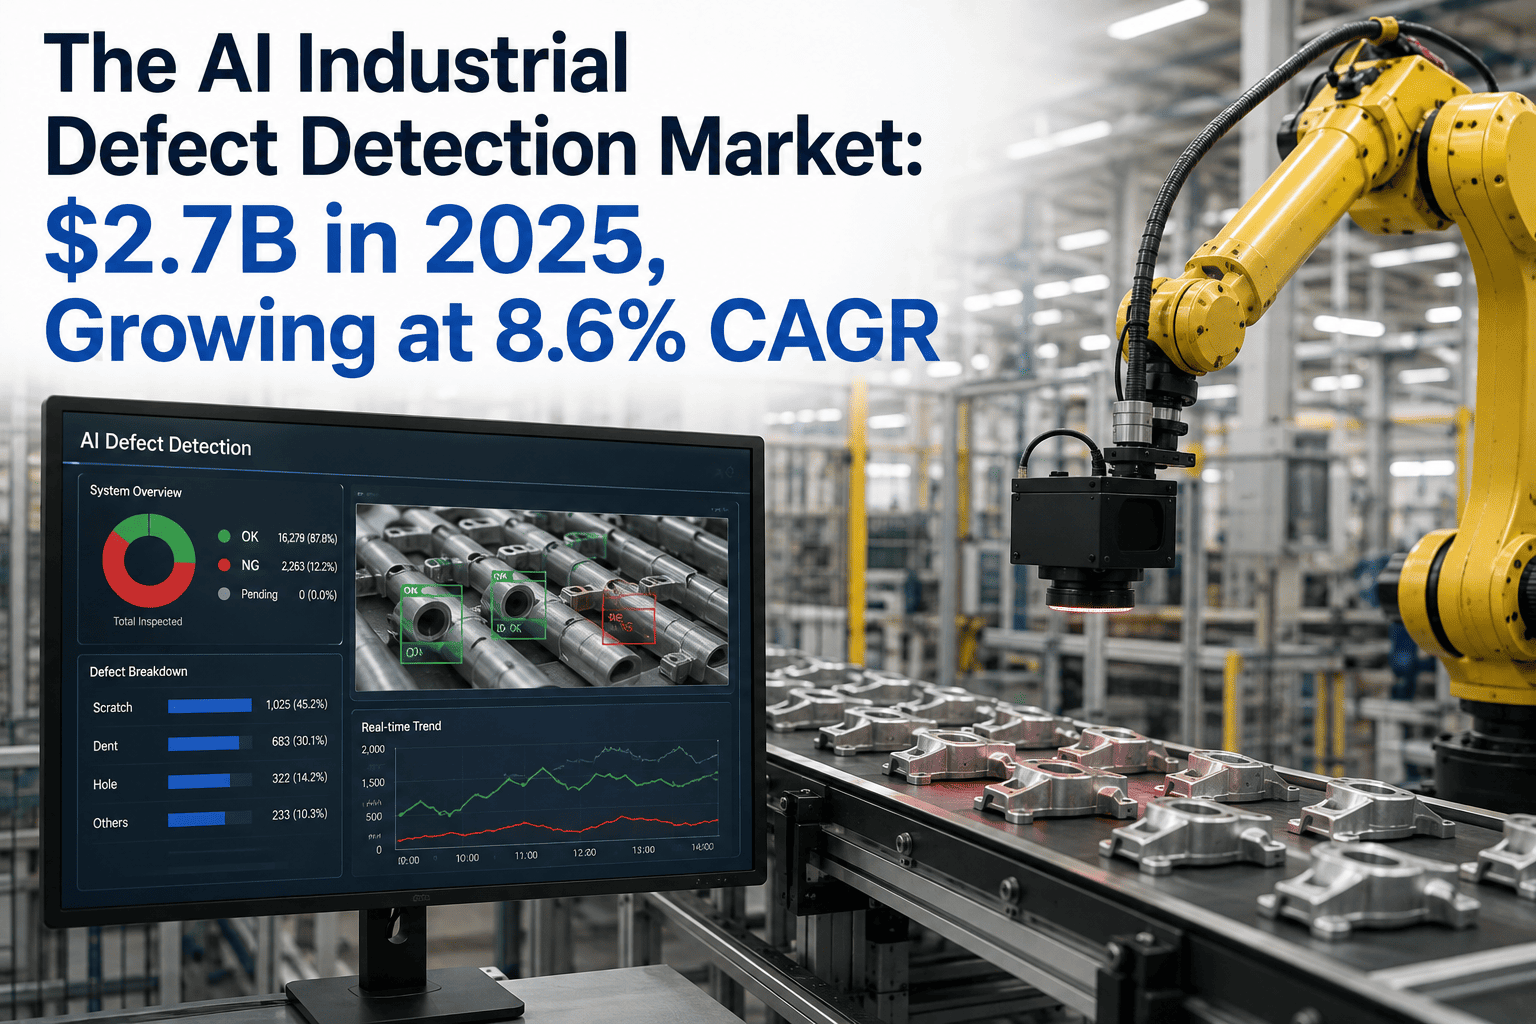
The AI vision inspection market has crossed an inflection point. What was a specialized machine-vision niche a decade ago is now a mainstream Industry 4.0 investment category — driven by zero-defect manufacturing targets, semiconductor capacity expansion, and the shift from sample-based inspection to 100% inline coverage. The global market reached roughly USD 32.66 billion in 2025 and is projected to hit USD 256.35 billion by 2035, a decade-long trajectory that redefines what quality assurance costs and delivers. This article breaks down the market size, segments, regional dynamics, vertical adoption, and the forces powering the growth — so decision-makers can benchmark where their own investments sit. To translate this market trajectory into a plant-level plan, book a strategy session with iFactory.
The AI Vision Inspection Market in 2026: $32B and Growing at 23% CAGR
Deep-learning detection dominates. Edge deployment leads. North America holds the largest regional share while Asia Pacific climbs fastest. Here is the full market map — and where your operation fits on it.
The Numbers That Define the Market Today
Four figures anchor every serious conversation about AI vision inspection: what the market was worth last year, what it will be worth a decade out, the growth rate that gets it there, and the regional block that leads it now. Multiple analyst houses converge on the same order of magnitude, giving these numbers unusual reliability.
The Ten-Year Growth Trajectory in One View
Compounding at more than 22% a year, the market roughly doubles every three-and-a-half years. The chart below shows year-by-year size implied by the consensus CAGR, from the 2025 base to the 2035 projection. The visual makes the second half of the decade the standout.
Values illustrative, computed from the consensus 22.88% CAGR applied to the 2025 base and cross-checked against the 2035 endpoint. Actual annual outcomes vary with macro conditions.
Where the Market Splits: Four Segmentation Axes
The AI vision inspection market is not one market — it is four, layered on top of each other. Understanding which segment your investment lands in is often more important than the total spend, because growth rates and margin structures differ sharply across them.
Hardware leads today; software is the fastest-growing sub-segment.
Deep learning holds the top share; edge AI is the fastest-growing category.
Quality control dominates — the highest-ROI use case across every vertical.
Edge dominates because sub-100 ms inspection latency is non-negotiable on the line.
Regional Breakdown: North America Leads, Asia Pacific Climbs Fastest
The regional split reflects two forces: legacy leadership from the North American manufacturing and semiconductor base, and rapid new capacity investment across Asia Pacific in electronics, EV batteries, and displays. Europe holds a stable middle ground; the rest of the world is emerging.
Where Does Your Plant Sit on This Curve?
iFactory benchmarks your current inspection coverage, defect capture rate, and AI readiness against sector peers — then maps a phased investment path aligned to the market trajectory.
Industry Vertical Adoption: Where the Demand Concentrates
Electronics and semiconductor manufacturing sits at the top today, driven by wafer-level and PCB inspection where defect tolerances are measured in microns. Automotive follows on the strength of EV powertrain and ADAS component inspection. Pharma is the fastest-growing vertical over the forecast period.
SEMI reported global semiconductor equipment billings reached USD 135.1 billion in 2025, up 15%. Wafer inspection, PCB defect detection, and advanced packaging drive concentrated demand.
EV powertrain, battery module assembly, and ADAS sensor calibration drive per-line inspection intensity higher than any prior generation of vehicles.
Foreign-object detection, seal integrity, label verification, and portion consistency are all under pressure from tightening safety regulations and private-label margins.
Vial and blister inspection, serialization compliance, and cold-chain traceability. Growth accelerated by GMP audit intensity and rising biosimilar production.
Vision-guided sortation, damage detection, and dimensional check on inbound and outbound flows. Rising labor cost is the primary pull for automation here.
Metals, textiles, print, plastics, glass — a long tail of applications where AI vision is displacing older rule-based machine vision at renewal cycles.
Six Forces Powering the 23% CAGR
Market growth of this magnitude is never one story. It is the alignment of six macro forces, all pushing in the same direction, each independently strong enough to drive double-digit growth on its own.
OEM contracts increasingly specify parts-per-million defect ceilings that manual inspection cannot deliver, forcing 100% AI coverage as table stakes.
Manual inspectors cost more year over year while their accuracy plateaus. AI vision improves annually on the same or lower capex base.
Models now handle high-mix, low-volume production without retraining explosions. What required data-science teams five years ago now runs configured, not coded.
Jetson-class edge GPUs deliver inference at price points that made no economic sense pre-2023. Every station now viable as an edge node.
FDA, GMP, GDPR-adjacent traceability, and EU battery-passport rules all demand per-unit inspection records — impossible without automated capture.
Every new fab, EV battery plant, and pharma line built post-2023 specifies AI vision at design phase rather than retrofit — a permanent uplift to baseline demand.
The Technology Shift: From Rule-Based Vision to Deep-Learning Inspection
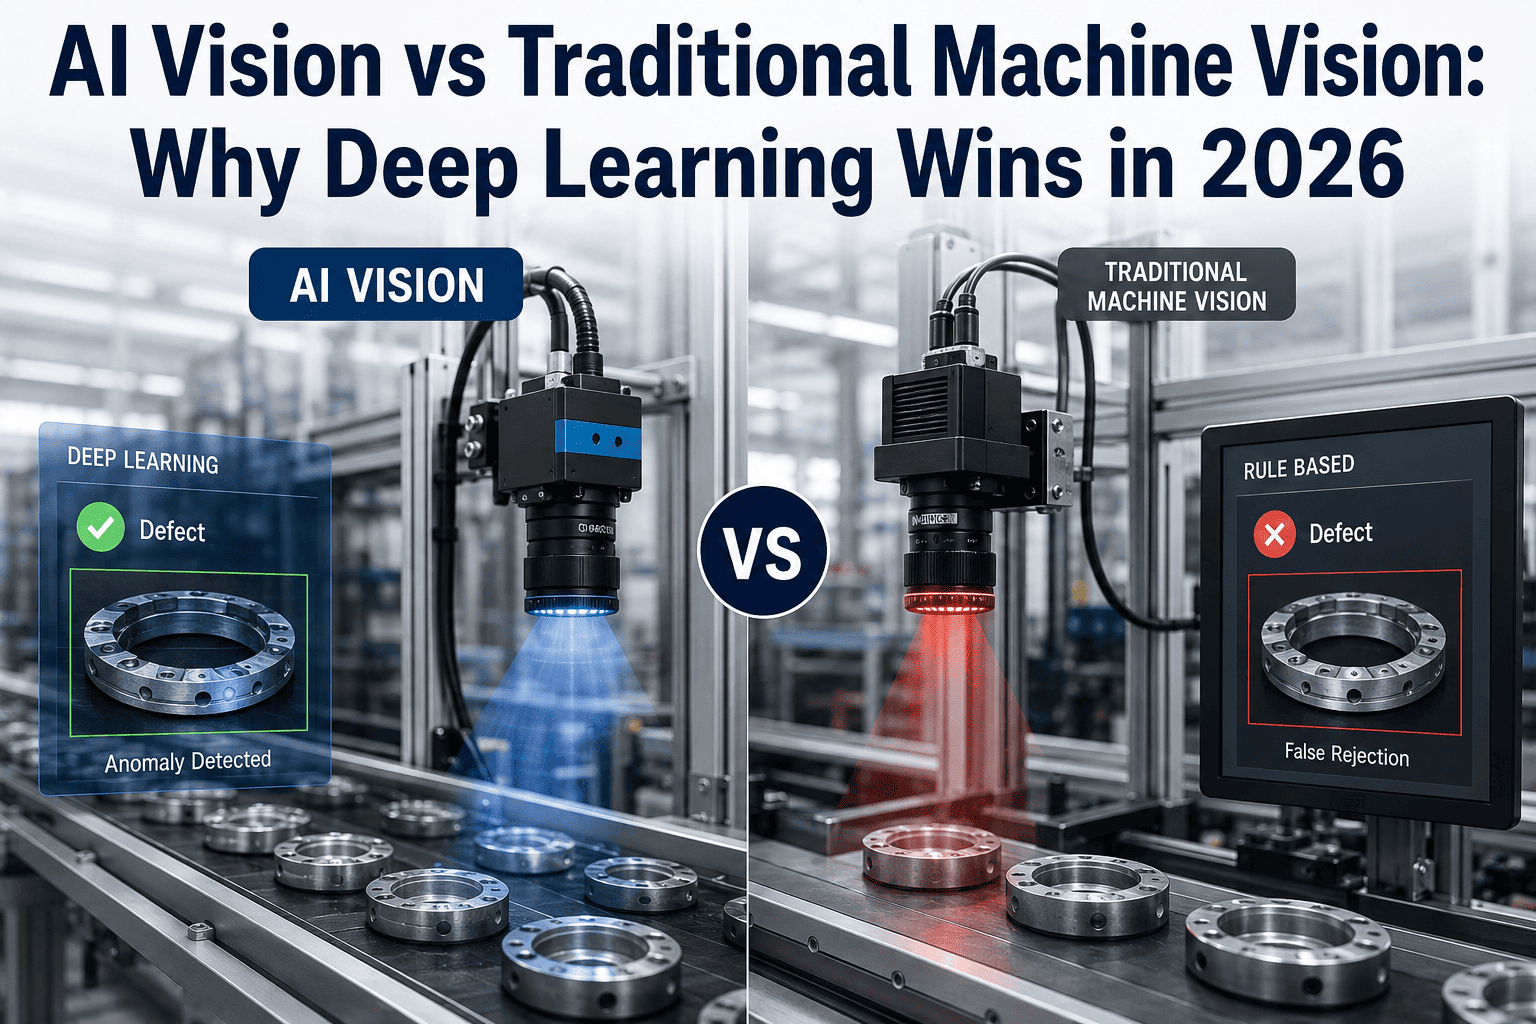
The single biggest change in the market between 2020 and 2026 is not the dollar size — it is what the systems can actually do. Rule-based machine vision, unchanged for two decades, has been overtaken by deep-learning inspection that handles variance no rule set can specify.
- Explicit rules coded per defect class
- Fails on cosmetic and organic-shape defects
- Weeks to re-tune for new SKU or lighting change
- Cannot generalize to unseen defect variants
- Common through 2015–2020 renewal cycles
- Learns defect signature from labeled examples
- Handles cosmetic, surface, and geometry defects
- Days to add a new SKU with transfer learning
- Generalizes to novel defect variants without recode
- The dominant technology in 2025 deployments
Frequently Asked Questions
Which analyst source should we trust for the market size figure?
Astute Analytica, Precedence Research, MarketsandMarkets, and The Business Research Company all publish independent estimates that cluster in the 30 to 33 billion USD range for 2025 and project 22 to 24% CAGR through 2035. Because the methodologies converge within a narrow band, any single source is defensible for board and investment memos. For plant-level decisions the total market number matters less than the segment your investment lands in, which is what a benchmark call is designed to isolate.
Why does deep learning hold only about a third of the technology share when it dominates every case study?
The reason is installed base. Two decades of rule-based and machine-learning systems remain in service on lines that have not yet reached renewal, and their maintenance and licensing still contribute to the technology revenue mix. New deployments now overwhelmingly select deep learning, which is why the deep-learning share climbs each year while the rule-based share erodes. By 2030 most analyst forecasts show deep learning approaching majority share as the older base retires.
How does edge deployment beat cloud when cloud has more compute?
Inspection latency is the constraint. A line running at 300 units per minute has under 200 milliseconds per unit for inference plus reject actuation, and network round-trip alone can consume most of that budget. Edge processors sit next to the camera, eliminate network variability, and keep sensitive image data inside the plant firewall — three reasons edge holds majority share and continues to grow. Cloud plays a role for training, model updates, and cross-plant analytics rather than real-time inspection.
Is Asia Pacific catching North America in absolute revenue, or just in growth rate?
Both, but on different timelines. Growth rate is already higher in Asia Pacific — the region is expanding meaningfully faster than North America each year. Absolute revenue crossover is projected further out, driven by the sheer scale of new fab, battery, and electronics capacity coming online in China, South Korea, Taiwan, Japan, and India. For sourcing and support decisions today, plants should assume a bipolar leadership structure by decade end, and plan integrations accordingly.
How should a manufacturer read a 23% CAGR — is that budget-planning gospel or vendor optimism?
Treat it as a directional signal, not a line-item forecast. The 22.88% CAGR reflects an average across a decade of very different years — early years driven by semiconductor and EV capacity build-outs, later years by mainstream FMCG and pharma adoption. Individual plants and sectors see growth rates well above or below the average in any given year. The signal is that under-investment now compounds against you, because the market is pricing AI vision into cost baselines that competitors will meet inside three years.
What a 23% CAGR Actually Means for Your Operation
Market growth this fast is a signal that the technology has crossed from optional to expected. The plants that start AI vision deployments in 2026 will operate at a defect-rate, throughput, and traceability baseline that the plants starting in 2029 have to catch up to. The gap will be measured in customer contracts won, chargebacks avoided, and PPAP submissions accepted on the first pass. The market is not asking whether AI vision will be standard equipment. It is asking which quarter you decide to make it yours.
Turn Market Trajectory Into a Plant-Level Plan
Book a 30-minute strategy session with iFactory. Share your current inspection footprint and top three quality pain points; leave with a phased roadmap, sector benchmarks, and a fixed-price pilot proposal aligned to your capex cycle.