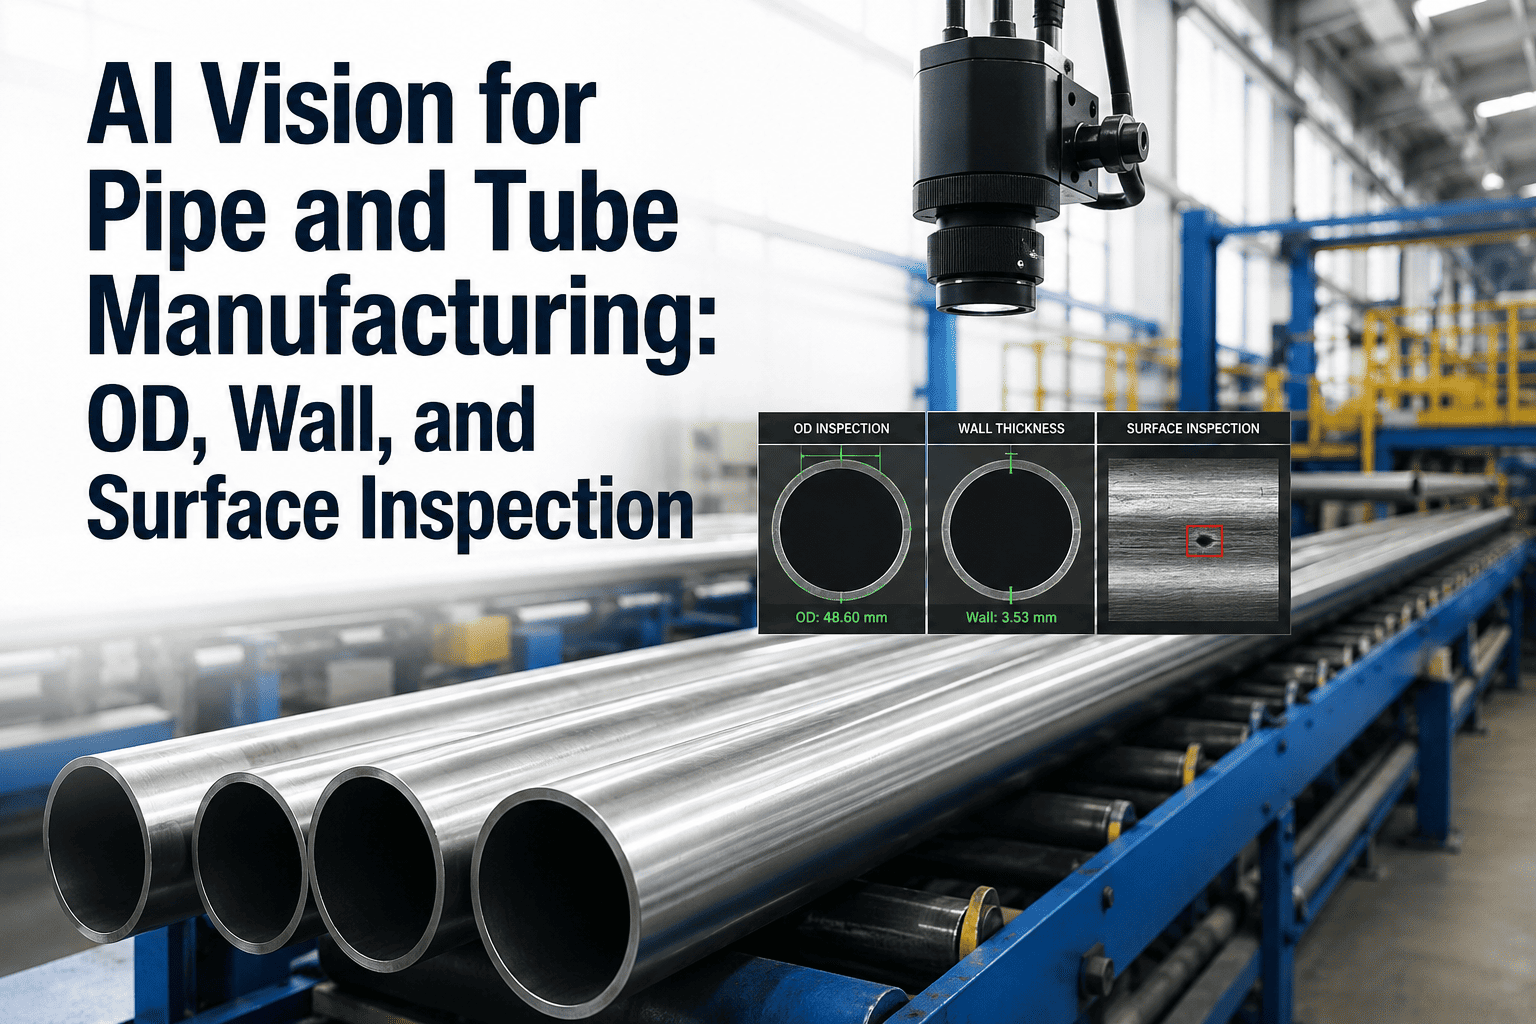
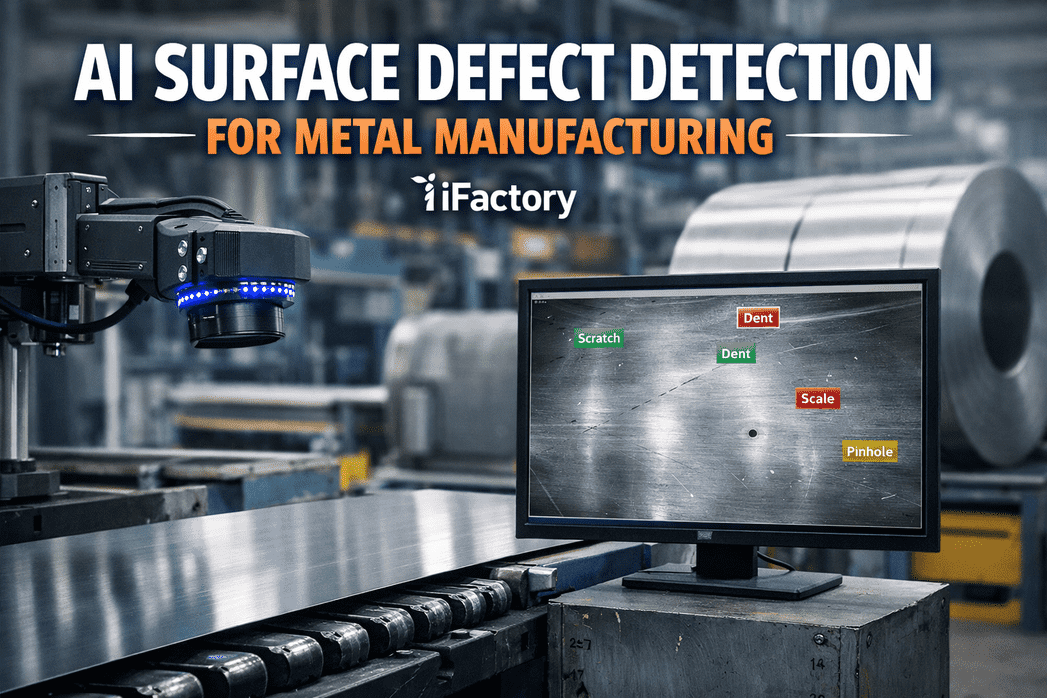
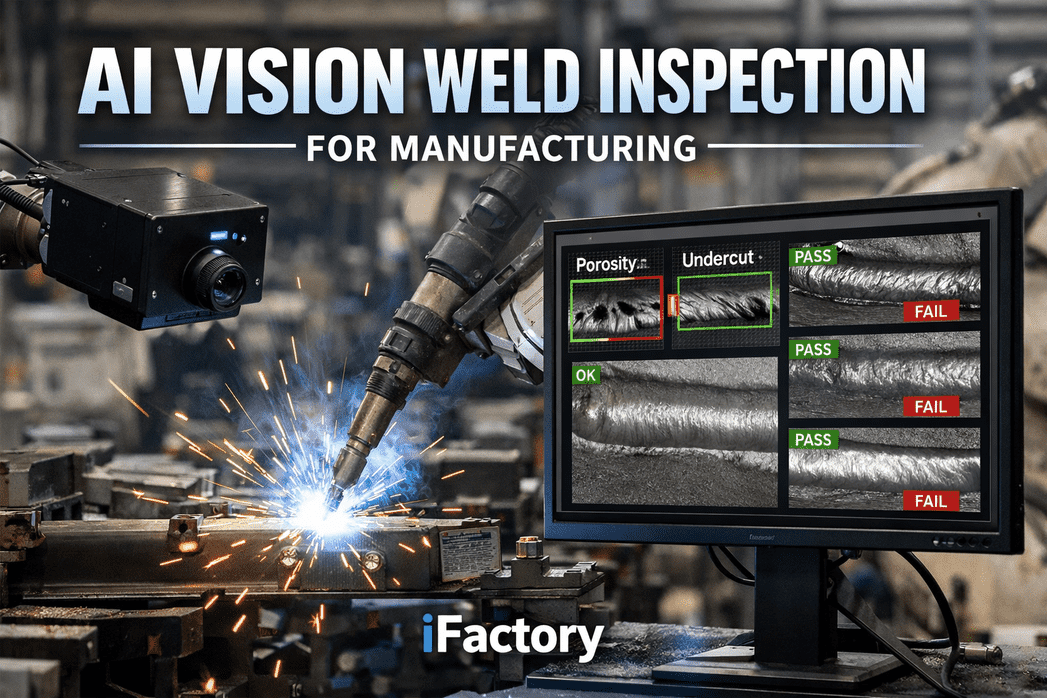
A pipe can pass its outer diameter check and its nominal wall thickness check and still fail in the field, because the number that actually matters — the thinnest point anywhere around the circumference — was never the number anyone measured. Seamless pipe can carry eccentricity right up to the tolerance limit, which means a mill running spot checks with calipers and micrometers is trusting an average when a single thin spot under pressure is what causes a failure. API 5L allows wall thickness tolerances of roughly plus or minus 12.5 percent for seamless pipe, a wide enough band that a mill without full-circumference visibility is gambling its sampling caught the worst point on every length. AI vision cameras built for pipe and tube lines measure OD, flag wall thickness risk indicators, and inspect surface condition continuously at mill speed — contact support to see what full-circumference coverage looks like on your specific line.
PROCESS-SPECIFIC · PIPE & TUBE MANUFACTURING · AI VISION
Your Spot Checks Are Trusting the Average — Your Pipe Only Needs to Fail at One Point
AI cameras measure outer diameter, flag wall thickness deviation risk, and inspect surface condition across the full circumference at mill speed — catching ovality, pitting, and seam defects that sampling inspection was built to miss.
THREE MEASUREMENTS, ONE CROSS-SECTION
OD, Wall, and Surface Are Not Three Separate Inspections — They Are One Pipe
A mill that checks outer diameter on one station, wall thickness on another, and surface condition on a third is treating a single physical object as three unrelated data points. In reality, an out-of-round pipe with excess ovality is often the same pipe developing an eccentric wall, because the same forming or sizing issue that pushes the OD out of round is frequently the root cause thinning the wall on one side while thickening it on the other. Reading these three dimensions together, on the same length of pipe, at the same point along its travel, is what turns three isolated checks into one coherent quality picture. A quality engineer looking at OD and surface data side by side can spot the correlation a fixed-station process never surfaces — a section developing mild ovality two meters before a surface pit appears is not a coincidence worth ignoring, it is a pattern worth tracing back to the forming stand or sizing pass that caused both.
This matters most on product destined for pressure service. A pipeline operator specifying API 5L PSL2 material is not just buying a diameter and a grade — they are buying a documented assurance that every length shipped met dimensional and surface tolerance across its full run, not just at the handful of points a technician happened to check. Full-coverage inspection is what makes that assurance defensible rather than aspirational.
Outer Diameter
Measured continuously around the full circumference, not sampled at a fixed number of points, catching ovality that a caliper reading at only two angles would miss entirely.
Wall Thickness Indicators
Visual and dimensional signals correlated against OD readings to flag eccentricity risk — the same failure mode that lets a pipe pass nominal wall checks while carrying a thin spot.
Surface Condition
Pits, scabs, laminations, and seam irregularities identified across the entire outer surface, not just the section a human inspector happened to be looking at.
WHAT SAMPLING ACTUALLY MISSES AT MILL SPEED
Human Inspection Was Never Built for This Line Speed
60–70%
Typical surface defect detection rate for manual inspection on fast-moving metal lines under real production conditions
±12.5%
API 5L allowable wall thickness tolerance for seamless pipe — a wide enough band that a thin spot can hide inside a passing average
2–5%
Share of typical metal production that downgrades to secondary or reject grade due to surface quality issues alone
95–99%
Detection accuracy AI vision systems achieve on the same lines, at full production speed, shift after shift
Stop Trusting a Sample to Represent the Whole Length
See full-circumference OD, wall risk, and surface coverage running against your own pipe or tube product on a live demo.
DEFECTS THE VISION MODEL IS TRAINED TO CATCH
Five Failure Modes, Read the Same Way on Every Length
Ovality and Out-of-Roundness
Deviation from true circular cross-section is measured continuously, catching out-of-round conditions that complicate downstream welding and affect fluid flow characteristics.
Seam Defects
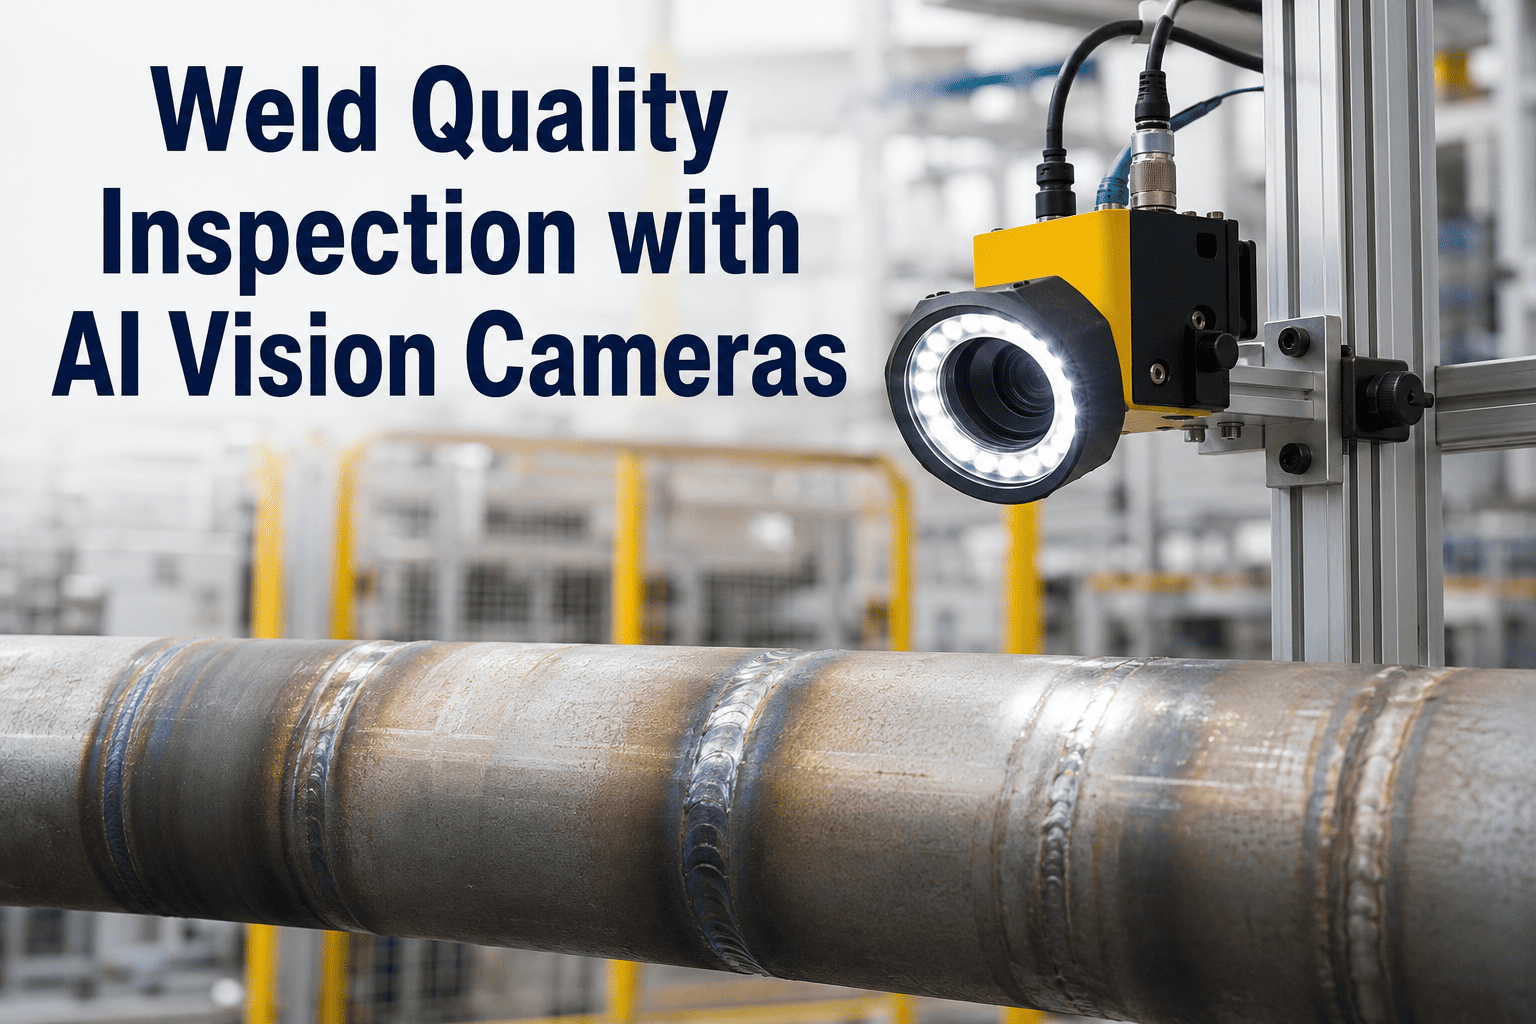
Undercuts, wrong edges, and weld reinforcement irregularities along the seam are flagged on welded pipe, where the seam is consistently the highest-risk zone on the entire length.
Pitting and Scabbing
Surface pits and scabs that act as stress concentrators are identified across the full outer surface, not just the sections a rotating visual check happened to cover.
Laminations and Arc Burns
Surface imperfections tied to raw material quality or process upset are caught early, before an entire heat's worth of pipe carries the same defect downstream.
Curvature and Straightness
Bow and camber along the pipe length are tracked continuously, flagging straightness deviations that standard dimensional checks at fixed intervals can miss between measurement points.
End Perpendicularity
Pipe end squareness is checked against tolerance at line speed, catching an out-of-square cut before it causes a downstream fit-up or welding problem.
FROM CAMERA FRAME TO MILL DECISION
What Happens Between the Pipe Passing the Camera and a Length Getting Flagged
A mill running full-length coverage generates far more inspection data per length than any spot-check process ever could — the value is entirely in what happens to that data in the seconds after capture, not just in capturing it.
1
Continuous imaging. Cameras positioned around the pipe's circumference capture OD, surface, and seam condition as the length travels through the inspection station at full mill speed.
2
Model classification. Each frame is scored against the trained defect model, classifying ovality, pitting, seam irregularities, and surface condition by type and severity in real time.
3
Disposition decision. A conforming length continues to the next process step automatically; a flagged length is marked for hold, downgrade, or closer inspection before it advances further down the line.
4
Quality record. Defect type, location along the length, severity, and heat or batch reference are logged automatically, building a traceable quality record for every meter of pipe produced.
WHAT A MISSED DEFECT ACTUALLY COSTS
The Math Behind Moving From Sampling to Full Coverage
Surface quality issues alone typically push 2 to 5 percent of production to secondary or reject status, and on a mid-size mill running millions of tonnes a year that downgrade share translates into real annual losses running into the millions — before counting the cost of a defect that escapes downgrade entirely and reaches a customer as a quality claim, an emergency sort, or a rejected shipment. Human inspectors working a fast-moving line typically catch 60 to 70 percent of surface defects on a good shift, and that detection rate degrades further after the first couple of hours as fatigue sets in. The gap between that and the 95 to 99 percent detection rate AI vision systems sustain, at full line speed, on every single length, is exactly where the missed thin spot or the undetected seam defect was hiding. Closing that gap does not just reduce downgrades — it changes what a mill can credibly promise a pipeline customer or a pressure-vessel fabricator about every length in a shipment, not just the ones a technician happened to check.
| Inspection Factor | Manual Spot Check | AI Vision Full Coverage |
|---|
| Circumference coverage | Sampled at fixed measurement points | Continuous, full circumference, every length |
| Detection rate under real conditions | 60–70%, degrading with shift fatigue | 95–99%, consistent across the full run |
| Line speed impact | Forces a tradeoff between speed and thoroughness | Runs at full mill speed with no slowdown |
| Traceability per length | Manual log entry, if recorded at all | Automatic — defect type, location, and severity logged |
| Consistency across shifts | Varies with inspector, lighting, and fatigue | Same trained model applied to every length, every shift |
FREQUENTLY ASKED QUESTIONS
What Mill Quality Teams Ask Before Deploying AI Pipe Inspection
Can this actually measure wall thickness, or only surface and OD?
Vision-based systems excel at outer diameter and surface condition directly, and they contribute a valuable third data point for wall thickness by correlating OD and ovality readings against known eccentricity risk patterns, flagging lengths that warrant closer ultrasonic verification. For a full-thickness reading at every point around the circumference, this is typically paired with your existing ultrasonic wall gauging rather than replacing it outright.
Book a demo to see how OD and surface data combine with your current wall thickness process.
Does this keep up with our actual mill line speed, or does it slow production down?
Vision inspection systems built for metal manufacturing are designed specifically to hold full coverage at production speed rather than forcing a tradeoff between throughput and thoroughness, running inference fast enough to process every length without introducing a bottleneck at the inspection station. This is the same constraint that makes manual inspection structurally incapable of matching mill speeds in the first place.
Contact support to review throughput requirements for your specific line.
How does the system tell a true seam defect apart from a normal weld reinforcement pattern?
The model is trained on your specific weld process and product mix, learning the visual signature of an acceptable weld reinforcement profile versus a true undercut, wrong edge, or reinforcement irregularity that falls outside your accepted tolerance. This distinction is exactly the kind of nuanced judgment that degrades over a long shift for a human inspector but stays consistent for a trained model run after run.
Book a session to review seam defect classification for your weld type.
Can findings integrate with our existing quality and maintenance systems?
Yes — each flagged length is logged with defect type, location, severity, and heat or batch reference structured to feed directly into the quality and maintenance systems your mill already runs, rather than sitting as a standalone dataset someone has to manually reconcile. This closes the loop between detection and the disposition decision a quality engineer actually needs to make.
Talk to support about integration with your current MES or CMMS.
What does deployment look like on an existing pipe or tube mill?
Deployment starts with mapping your product mix, tolerance standards, and known defect history, then training the vision model against sample lengths covering both conforming product and representative defect types before it goes live inline. Most mills see the system running in production within weeks, with detection accuracy improving further as it processes more real production volume.
Book a demo to scope a deployment timeline for your mill.
DON'T LET A THIN SPOT HIDE INSIDE A PASSING AVERAGE
See Full-Circumference OD, Wall Risk, and Surface Coverage on Your Own Pipe
Continuous inspection at mill speed — catching ovality, pitting, and seam defects before a length ever leaves the line carrying a problem your sampling process was built to miss.