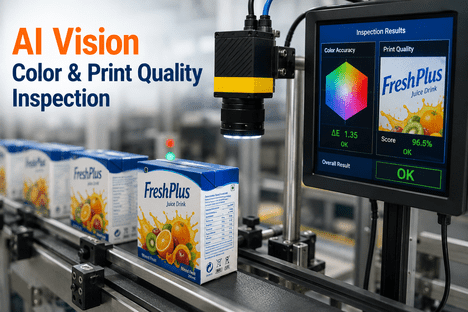
A press operator running a six-color flexo job at 400 meters per minute has less than a second to notice that cyan has crept a quarter millimeter off register — and by the time the eye catches it in a pulled sheet, several hundred meters of web have already run out of tolerance and into the waste bin. Multiply that across a shift, across cyan-magenta-yellow-black plus two spot colors, across every color density drift, dot gain shift, and slow plate wear pattern that a human operator has to track simultaneously, and the reason print quality is one of the highest-waste categories in packaging manufacturing becomes obvious. AI vision monitoring closes the gap between when a defect starts and when someone notices it — and if you want to see how it would run on your existing press footage, the fastest path is to book a demo with the iFactory team.
AI VISION FOR PRINTING PROCESS MONITORING
Catch Registration Drift, Density Shift, and Plate Wear in the Second They Start
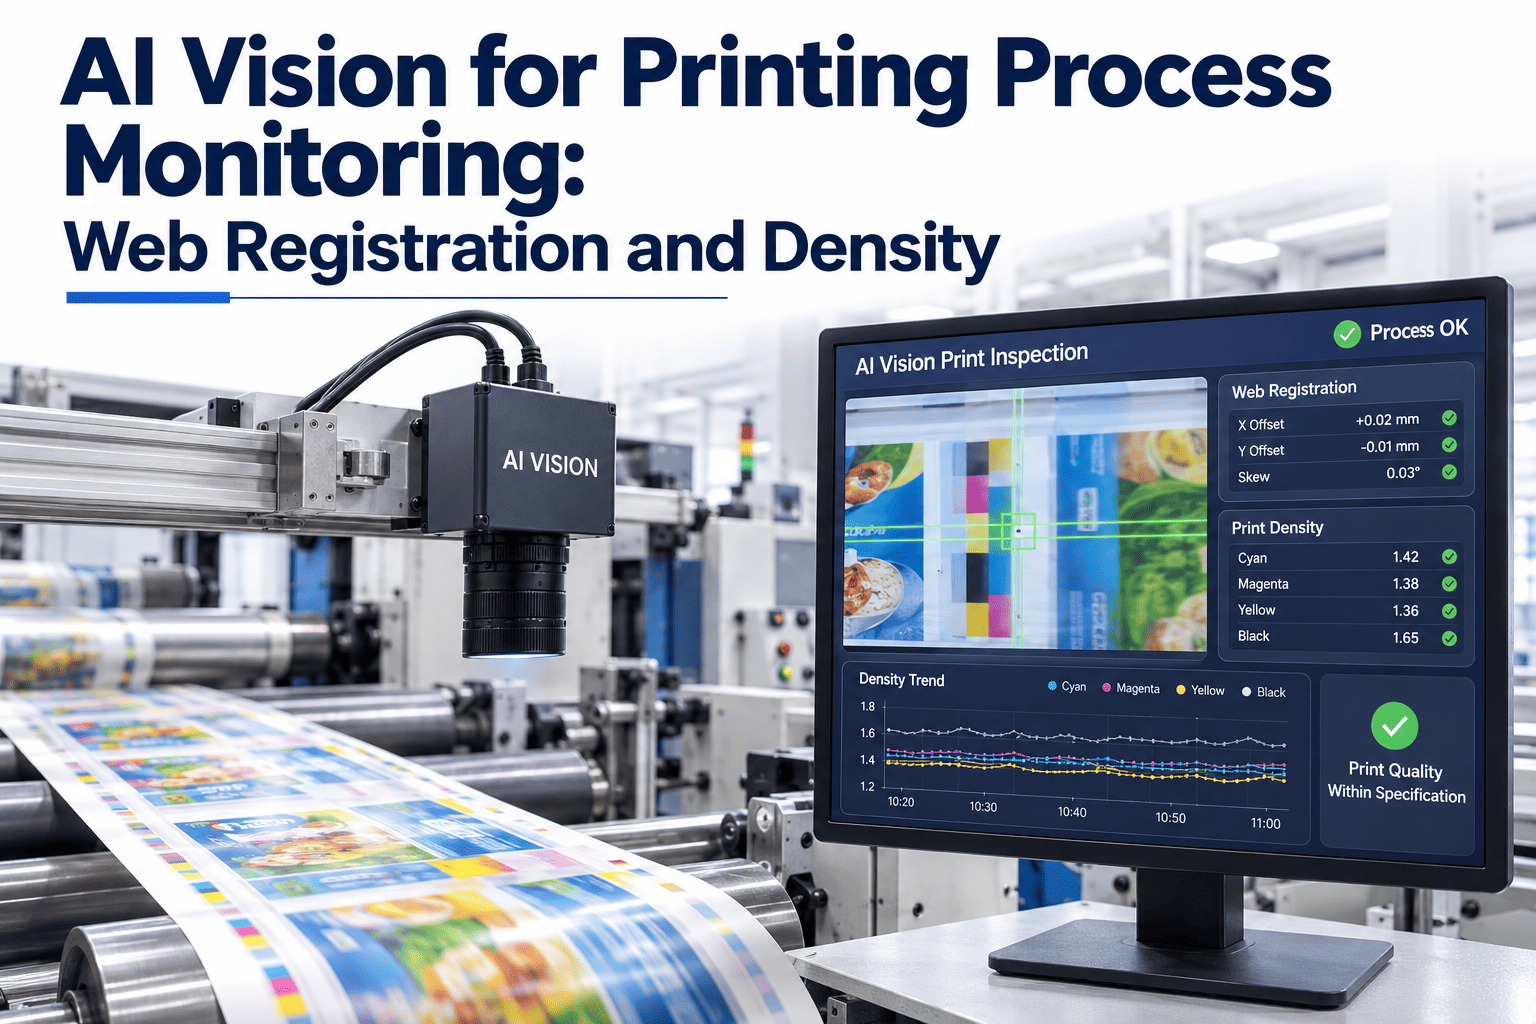
iFactory watches every meter of web on offset, flexo, and gravure presses — measuring registration to the micron, tracking Delta E per color channel, quantifying dot gain, and flagging plate wear before it reaches the reject sheet.
99%
Defect detection accuracy achievable by modern AI web inspection systems on flexo, gravure, and label presses
600 m/min
Web speeds at which AI inspection can measure every repeat in real time on packaging lines
60%+
Share of high-speed print facilities that had adopted automated inspection by 2025, up from under 50% in 2023
±2.5 µm
Register tolerance modern presses target — a precision impossible to verify by eye alone at production speed
The Core Problem
Print Quality Drifts Faster Than a Human Operator Can Track It
Every print process — sheetfed offset, web offset, narrow-web flexo, wide-web flexo, gravure — has the same underlying challenge: multiple independent variables change continuously during a run, and each one bends print quality in a different direction. An operator watching a control monitor and pulling sample sheets is trying to hold four moving targets in mind at once, on a press that produces new impressions faster than a person can read a barcode.
Register
Web tension shifts, sleeve expansion, cylinder eccentricity, and thermal growth all push individual color decks out of register with the substrate — often within microns, always before the eye can catch it at speed.
Density
Ink viscosity changes as the fountain warms, anilox cells clog, doctor blade pressure shifts, and substrate absorbency varies lot to lot — each one moving measured Delta E away from the approved brand target.
Dot Gain
Plate impression pressure, blanket condition, fountain solution chemistry, and stock porosity determine how much dots spread when transferred — and midtone dot gain drift is what makes reprints look off from the original.
Plate Wear
Flexo photopolymer plates degrade with impressions, abrasive substrates, and solvent exposure — the loss of highlight dots and edge sharpness is gradual and invisible until reject rates start climbing on long runs.
How AI Vision Sees It
Four Continuous Measurement Loops — Running on Every Meter of Web
Traditional inline inspection was rule-based: a threshold sat at some pixel-difference value, and defects either tripped it or didn't. Tighten the rule and false alarms flood the operator; loosen it and real defects escape to the customer. Deep learning models trained on real-world defect libraries dissolve that trade-off — each of the four monitoring loops below runs independently, at full press speed, on every frame of the web.
LOOP 01
Web Registration Monitoring
High-resolution line-scan cameras positioned after the final print deck capture every repeat, and a vision model measures the offset of each color channel against the master repeat — in microns, cross-web and machine-direction independently. Registration drift is quantified per color per meter of web, not sampled every few minutes by pulling a sheet.
Detects: color misregistration, sleeve slippage, web wanderResponse time: sub-second
LOOP 02
Color Density and Delta E Tracking
Spectral measurement points on the color bar and inside solid tint blocks feed continuous LAB and density values back to the model, which flags when any channel drifts past the brand-defined Delta E tolerance — commonly ΔE ≤ 2 for brand-critical patches and ΔE ≤ 3 for secondary colors. The drift is caught while it is still correctable at the ink key, not after 800 meters of off-spec web has printed.
Detects: ink starvation, viscosity drift, anilox wearResponse time: continuous
LOOP 03
Dot Gain and Tone Value Increase
Tint patches at 25%, 50%, and 75% coverage are measured against the reference tone value curve, and Murray-Davies dot area is calculated live for each CMYK separation. Any deviation from the calibrated press curve is flagged — meaning midtone dot gain trends are visible while the run is happening, not discovered when a customer complaint arrives days later.
Detects: impression pressure drift, blanket wearResponse time: per sheet or per repeat
LOOP 04
Plate Wear and Structural Deviation
A dedicated defect model compares every printed repeat against the approved PDF master, catching progressive degradation — softened plate edges, lost highlight dots, hickeys, pinholes, ink splatter, scratches — that would be dismissed as normal noise by a threshold-based system. Wear trends per plate and per anilox are logged across shifts and jobs.
Detects: photopolymer degradation, doctor blade defectsResponse time: per repeat
STOP GUESSING WHERE THE WASTE COMES FROM
Run One Real Job Through iFactory Print Monitoring
The teams that gain the most from AI print monitoring are the ones convinced their operators already catch everything — until measured data shows the drift that pull-sheet sampling was missing between checks.
Press-Type Coverage
How the Same Monitoring Stack Adapts Across Print Processes
The physical defect signatures on an offset press are not the ones you see on a gravure line, and a flexo plate wears differently than either. What stays constant is the measurement discipline: register, density, dot gain, and structural deviation from master. The table below shows how the monitoring focus shifts per process — and why one platform covers the range that a plant floor actually runs.
What the Data Loop Enables
From Detection to Closed-Loop Correction
Seeing a defect is only the first step. The value of continuous vision monitoring compounds when the measurement stream connects to the press control system — moving from "operator gets an alert" to "the press corrects itself." iFactory supports both modes, and most facilities start with monitoring and graduate to closed loop as trust in the data builds.
STAGE 1
Monitor
AI vision measures registration, density, dot gain, and structural deviation continuously across every meter of web. Data streams into a live dashboard beside the press console — no press control changes required, and no operator workflow disruption during rollout.
STAGE 2
Alert and Trend
When a measured parameter drifts past a job-specific tolerance, the operator gets a targeted alert with the exact color channel, defect type, and location on the web. Trends across shifts and jobs surface which decks, plates, or substrates repeatedly cause problems — turning tribal knowledge into structured data.
STAGE 3
Closed-Loop Correction
Measured drift feeds directly into press control — ink key adjustments for density, register motor corrections for offset, impression pressure trims for dot gain. The press holds target Delta E without operator intervention, and the operator supervises exceptions instead of chasing every drift by hand.
STAGE 4
Job-to-Job Learning
Every completed job feeds back into the model as ground truth — which corrections held, which substrates caused which drifts, which plates lasted how many impressions before wear signals appeared. The next run of the same job starts closer to target and stabilizes faster.
Waste Reduction Math
Where the Return Actually Comes From
The economic case for AI print monitoring is not built on catching catastrophic defects — those get caught eventually anyway, just later and more expensively. The return sits in the aggregate of small drifts that never quite trigger a full stop but silently push waste percentage upward across every long run.
Startup Waste
Time to reach target Delta E and register during makeready shrinks when the monitoring system reports drift live instead of the operator pulling sheets every few minutes and interpreting them by eye.
Running Waste
Slow drifts caught in the meter they start — instead of the next pull sample — mean hundreds of meters of borderline product per shift stop being borderline before it becomes reject.
Reprint Rate
Structured evidence of what shipped within tolerance reduces customer complaint reprints, and job-specific tolerance data supports pushing back on subjective quality claims with measured records.
Plate and Anilox Life
Wear trending flags plates and aniloxes that are drifting toward reject-generating condition before they cause a run to fail — pushing replacement onto the maintenance calendar instead of into the middle of a customer job.
Compliance and Documentation
A Measured Record for Every Repeat You Ship
Pharmaceutical, food, and regulated-goods packaging carries a documentation burden that manual inspection cannot practically meet — every barcode readable, every serialization code verified, every batch traceable. Continuous AI monitoring produces that record as a byproduct of the run itself, not as an additional workflow.
Barcode and 2D Code Verification
Every 1D barcode, GS1 DataMatrix, and QR code on the web is graded live against ISO standards, and codes below the required grade trigger sheet rejection with a record of which repeat failed and why.
Serialization and Batch Traceability
Serialization codes are OCR-verified against the batch database in real time, supporting track-and-trace mandates including DSCSA-style pharmaceutical requirements without a separate camera pass.
Color Tolerance Audit Trail
Delta E measurements per color channel are logged per job, giving brand owners and auditors a numerical record of what was actually shipped rather than an operator sign-off that the run "looked good."
Defect Event Log
Every flagged defect — type, location, severity, corrective action taken — is timestamped and retained, giving quality and continuous improvement teams a data set instead of a folder of incident reports.
Deployment Reality
What Bringing This Online on Your Press Actually Looks Like
Most facilities evaluating AI print monitoring have already lived through one or two disappointing "smart camera" installations from vendors that promised more than they delivered. The deployment path below reflects what a realistic rollout looks like — including the fact that trust in the data has to be earned before closed-loop control makes sense.
Week 1–2
Assessment and Baseline
Camera positioning, lighting, and web-viewing geometry evaluated on your specific press. Existing waste percentages, reject reasons, and reprint rates captured as a baseline so improvement is measured against real numbers, not estimates.
Week 3–5
Install and Model Calibration
Cameras and computing hardware installed during a scheduled maintenance window. Models tuned to your substrates, ink sets, and typical job mix — pharma packaging behaves differently than shrink sleeves, and the model learns which is which.
Week 6–8
Monitor-Only Operation
System runs in monitor mode with operator visibility. Alerts and trends compared against operator judgment on real jobs, building confidence in the measurement stream before any press control is handed to the system.
Week 9–12
Closed-Loop Enablement
Selected control loops — typically density first, register second — connected to press automation. Operator retains override authority and supervises exceptions while routine drift correction happens continuously in the background.
Voice From the Floor
Field Perspective
R
Rakesh M.
Production Manager, Flexible Packaging Converter
We knew our long runs were losing time to color drift — we just could not prove where it started. Once monitoring showed us the ΔE trace hour by hour, we realized cyan was walking every time the pressroom HVAC cycled. It was a fifteen-minute fix on the ink temperature control. The waste number moved that same week — and that is one press, one shift, one variable we finally had data on.
Manual vs Vision-Monitored Runs
The Practical Difference on a Real Shift
The comparison below is what an experienced operator recognizes immediately — the difference is not that the operator suddenly becomes less skilled, it is that the measurement stream stops relying on eyes and pulled sheets under time pressure.
Manual Inspection Only
Register checked by pulling sheets every 10–15 minutes
Delta E judged visually against a proof under press-side lighting
Dot gain drift discovered when customer flags a reprint
Plate wear noticed when reject rate climbs
Documentation: operator signature on job traveler
Root cause of waste: often unclear after the fact
AI Vision Monitoring
Register measured every repeat, cross-web and machine direction
Delta E measured continuously per channel against target
TVI curves tracked live at 25%, 50%, 75% per CMYK
Plate wear trended per impression count
Documentation: measured record of every repeat shipped
Root cause of waste: traceable to timestamp and variable
Frequently Asked
AI Print Monitoring — Questions Press Teams Actually Ask
Do we need to replace our existing press control system to run AI vision monitoring?
No. The monitoring layer sits on top of your existing press — cameras, lighting, and computing hardware are added to the web-viewing area, and the platform reads what is already there rather than replacing the control system. In monitor-only mode there is no interface to the press automation at all, and the system delivers value entirely through operator-facing alerts and trend data. Closed-loop control is added later, once your team is comfortable with the measurement stream, and it typically interfaces with the existing press control through standard automation protocols rather than a rip-and-replace project.
How does the system handle short-run jobs where there is no history to learn from?
Short-run jobs are exactly where measured monitoring pays off most, because there is no time to catch drift by pulling sheets — by the time the operator notices something, the run is often already finished. The vision model works from the approved PDF master and the standard color tolerance targets you set per brand or per SKU, so a job with no prior run history still gets full registration, density, dot gain, and structural deviation measurement from the first repeat. As jobs repeat over time, the system learns your specific press behavior on each SKU and starts up closer to target on each subsequent run, but the first-run coverage does not depend on that history.
What happens with metallic inks, holographic substrates, and other tricky materials that fool traditional inspection?
Metallic and holographic substrates are the classic failure mode for rule-based inspection systems — the reflective surface throws off pixel-comparison thresholds and generates so many false alarms that operators end up disabling the inspection for those jobs. Deep learning models handle these substrates differently, because they are trained on real-world examples of what genuine defects look like on those materials rather than triggering on any deviation from a reference frame. The result is that difficult substrates get the same monitoring coverage as a matte white label stock, and the specific defect categories that actually matter on those materials — pinholing, poor metallic coverage, holographic pattern registration — get flagged reliably.
Can this really keep up at 600 meters per minute, or does it start missing repeats at high speed?
Modern line-scan cameras paired with GPU-accelerated inference can inspect 100% of the web at speeds up to 600 meters per minute on most flexo and gravure applications, which covers the operating range of the vast majority of production presses in the field. What actually matters is the combination of camera resolution, illumination consistency, and model throughput, and these are matched during deployment to your specific web width and speed — a narrow-web label press and a wide-web packaging line get different hardware configurations even though the software layer is the same. If your press runs at the upper end of that range, we can walk through the sizing during a scheduled
demo so you see the specification math for your actual line, not a generic case study.
What kind of integration do we need for the data to reach our MES, ERP, or customer quality portal?
The monitoring platform exposes measured data — Delta E per channel per job, defect events, waste attribution, per-impression records — through standard APIs and file-based exports that MES, ERP, and customer quality systems can consume. Common integrations include automatic job completion reports pushed into the MES, quality certificates generated at the end of each run for customer portals, and defect event streams that feed continuous improvement dashboards. Specific integration mapping depends on which systems you run, and the implementation team walks through that during scoping — for detailed questions on your particular stack, the fastest path is to raise them through
support so someone with integration experience can respond directly.
REGISTRATION · DENSITY · DOT GAIN · PLATE WEAR
Every Meter of Web, Measured Against Your Approved Master
iFactory turns print quality from an operator judgment call into a measured stream — so drift gets caught in the second it starts, waste stops accumulating between pull-sheet checks, and every repeat you ship comes with a record.