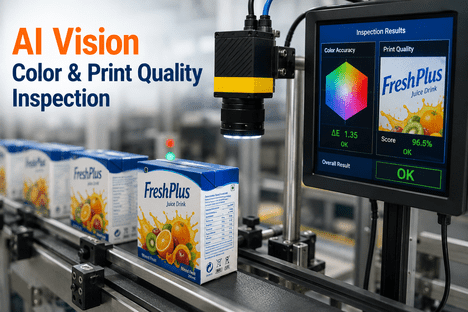
A misregistered floral print does not announce itself with an alarm — it announces itself weeks later, when a buyer opens a container, spots the ghost outline where cyan slipped 0.4 mm off magenta across an entire lot, and files the claim that erases the margin on that order. Textile printing is unforgiving that way: registration drift, pattern repeat misalignment, and Delta-E color deviation are visible to the naked eye in the finished garment, but nearly invisible on a running printing line moving at 60 to 90 meters per minute under changing humidity, fabric tension, and screen wear. AI vision closes that gap by watching every centimeter of fabric as it leaves the print head, comparing it against the intended pattern geometry and target color values in real time, and flagging drift before the next hundred meters of print become downgrade stock. Textile mills evaluating vision-based print inspection can Book a Demo to see how iFactory monitors registration, color, and pattern repeat across every printing line in one platform.
AI VISION · TEXTILE PRINTING · PATTERN REGISTRATION
AI Vision for Textile Printing and Pattern Registration Quality
How high-resolution line-scan cameras and deep learning models monitor digital and rotary screen printing lines at full production speed — catching registration drift, color deviation, and pattern repeat errors before they turn into downgraded rolls and buyer claims.
95-99%
Detection accuracy at full line speed
<0.5
Delta-E color measurement sensitivity
40-60%
Reduction in print seconds and downgrade
Why Print Registration Is the Hardest Quality Problem on the Mill Floor
A greige fabric defect — a broken pick, a slub, a hole — is a structural fault the loom either creates or does not. It is discrete, binary, and once documented, easy to grade. A print defect is different in kind. Registration drift is continuous: cyan can be perfectly aligned at meter 40 and 0.3 mm off at meter 180, with every meter in between drifting incrementally as squeegee pressure evolves, screen wear accumulates, and fabric tension responds to humidity changes in the drying chamber. Color deviation behaves the same way — a magenta that measures Delta-E 1.2 against target at the start of a shift can drift to Delta-E 3.5 by hour six as ink viscosity changes and screen mesh loads. Both defects are invisible to a spot-check human inspector because they only reveal themselves when you can see hundreds of meters at once, side by side, against the reference pattern.
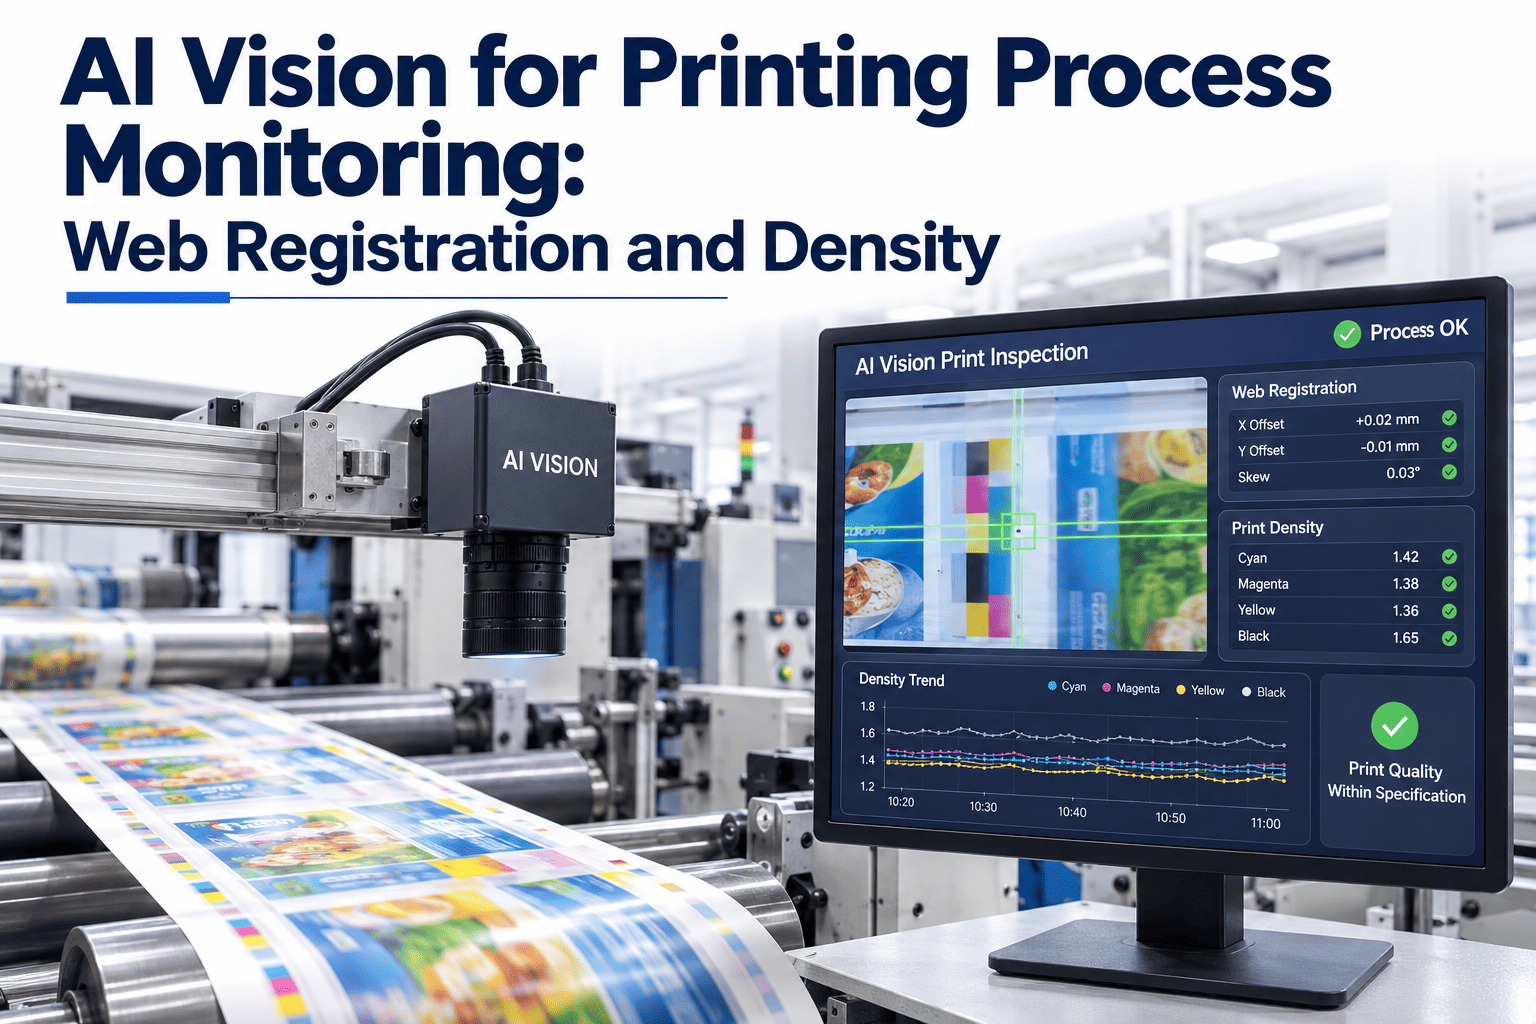
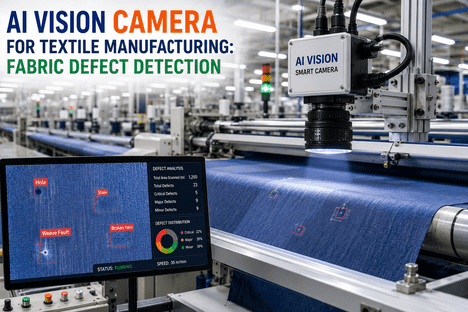
This is the exact problem AI vision was built to solve. A 4K or 8K line-scan camera mounted after the final print head captures every centimeter of fabric passing under it. A trained model compares the captured image against the intended pattern template — either loaded from the design file or auto-generated from the first defect-free repeat of the current run — and measures three things simultaneously: the geometric offset between color layers (registration), the color values across defined patches (Delta-E), and the periodicity and integrity of the pattern repeat itself. When any of the three drift outside tolerance, the system flags the deviation, marks the position on the roll, and either alerts the operator or triggers a closed-loop correction to the press control.
The Three Print Defect Categories AI Vision Actually Solves
Textile print defects break into three distinct categories, each requiring a different measurement approach, camera specification, and detection model. Understanding which category a defect belongs to determines the entire inspection strategy — and the mistake most first-time vision deployments make is treating all three as a single "print quality" problem solved by a single generic camera setup. The taxonomy below maps what AI vision actually inspects on a textile printing line, what each measurement requires from the hardware, and where the deployment payback tends to concentrate.
CATEGORY A
Registration & Alignment Defects
What it looks likeColor layers shifted relative to each other — cyan outline visible outside magenta fill, ghost edges on multi-color patterns, drift accumulating across roll length
Root causesScreen wear, squeegee pressure change, fabric tension variation, drying shrinkage, rotary cylinder synchronization drift
Measurement methodGeometric offset between reference marks and pattern features — measured in millimeters or fractions thereof, per color separation
Camera requirement8K line-scan recommended for fine registration measurement below 0.2 mm; 4K acceptable for coarser patterns
CATEGORY B
Color Consistency & Delta-E Deviation
What it looks likeShade banding across roll width, gradual color drift across roll length, side-to-side variation, batch-to-batch inconsistency vs approved standard
Root causesInk viscosity change, print head nozzle degradation, drying temperature variation, screen mesh loading, ink batch variation
Measurement methodDelta-E calculation in CIELAB color space against calibrated target values — CIEDE2000 or CMC(2:1) formulas standard for textile applications
Camera requirementColor-calibrated cameras with controlled lighting, capable of measuring Delta-E differences below 0.5 reliably
CATEGORY C
Pattern Repeat & Print Integrity
What it looks likeRepeat distance drift, missing pattern elements, smearing, streaks, nozzle misfires on digital lines, screen wear artifacts on rotary lines
Root causesCylinder circumference variation, digital head nozzle failure, ink starvation, screen damage, fabric feed speed variation
Measurement methodTemplate matching against reference repeat with tolerance on periodicity, feature integrity, and localized pixel deviation
Camera requirement4K minimum line-scan with sufficient depth of field for fabric surface variation and controlled diffuse lighting
PRINT INSPECTION · REGISTRATION MONITORING · COLOR CONTROL
Stop Discovering Print Defects at the Final Inspection Table
iFactory watches every printed meter as it leaves the print head — registration offset, Delta-E deviation, pattern repeat integrity — and pushes the deviation to the operator before the next hundred meters become downgrade stock.
The Delta-E Tolerance Band: What Numbers Actually Mean on Fabric
Delta-E is the single most misunderstood measurement in textile print quality. A buyer specification calling for "Delta-E under 2" means different things depending on which Delta-E formula the measurement uses, whether the reference is CIELAB, CIE94, CIEDE2000, or the textile-specific CMC(2:1), and what lighting condition the measurement was taken under. AI vision systems for textile printing standardize on CIEDE2000 or CMC(2:1) because they best correlate with human perception of textile color differences, and they are the formulas most modern buyer specifications reference. The band chart below maps Delta-E ranges to what an operator actually sees on the fabric and what action the ranges should trigger.
Δ E ≤ 1
Imperceptible. Color difference is below the human perception threshold under standard viewing. Reference-quality print output — the target for luxury fashion, premium home textile, and brand-critical color positioning. No action required.
Δ E 1-2
Perceptible on close inspection only. Standard for most professional textile printing and typical buyer acceptance threshold for mid-to-premium apparel and home textile. Log the deviation, monitor trend, no immediate line action.
Δ E 2-3
Perceptible under normal viewing. Acceptable ceiling for volume apparel and home textile applications. Trigger operator review — this range indicates ink or process drift that will worsen if not addressed within the current shift.
Δ E 3-5
Clearly visible. Acceptable only for non-color-critical output such as some technical textile and industrial applications. For fashion and home textile, this range triggers a hard hold and process adjustment before the line continues at production speed.
Δ E > 5
Obvious color deviation. Fail. The output is off-target color and will be rejected by any color-conscious buyer. Line stops, ink and process are corrected, and the produced length is marked for downgrade or re-print evaluation.
The value of continuous AI vision monitoring is not in catching the Delta-E 5 failures — those are visible to any human walking past. It is in catching the Delta-E 1.8 drift trending toward 2.5 in the next hour, before it crosses into buyer-rejection territory. That trend-line detection is the gap between manual spot-check inspection and continuous automated inspection, and it is where most of the return on the vision system investment concentrates.
The Registration Tolerance Meter: Digital vs Rotary Screen Printing
Digital textile printing and rotary screen printing produce fundamentally different registration defect profiles because the underlying print mechanisms are different. Digital printing lays color from independent print heads that must synchronize their firing to sub-millimeter accuracy against a moving fabric surface. Rotary screen printing uses mechanically linked cylinders that share drive systems but each carry a physical screen subject to wear, damage, and thermal expansion. The tolerance bands and typical failure modes below are calibrated to each printing method — plants running both technologies typically need distinct inspection profiles for each line rather than a single unified specification.
DIGITAL INKJET TEXTILE PRINTING
Registration drift is head-to-head synchronization drift
≤ 0.15 mm
Reference quality — head synchronization holding, no visible ghosting on multi-color patterns
0.15 - 0.3 mm
Acceptable for volume apparel, monitor trend — indicates early head drift or fabric feed variation
0.3 - 0.5 mm
Visible on fine patterns — hold review, likely head timing or calibration issue requiring attention
> 0.5 mm
Fail — visible ghosting on all patterns, line stop and head recalibration required before continuing
ROTARY SCREEN TEXTILE PRINTING
Registration drift is cylinder wear and tension drift
≤ 0.2 mm
Reference quality — screens fresh, tension consistent, no visible pattern shift across roll length
0.2 - 0.4 mm
Acceptable — normal early-life screen wear, monitor for accelerating drift indicating tension issue
0.4 - 0.7 mm
Screen wear approaching change threshold — schedule screen replacement at next planned changeover
> 0.7 mm
Fail — screen wear or damage confirmed, immediate screen change or cylinder inspection required
The Inspection Technology Stack: What Actually Sits on the Line
A production-grade textile print inspection deployment is a stack of five layers, each doing work the others cannot substitute for. The temptation on first deployment is to invest heavily in the camera and skimp on the other four layers — the result is a system that captures beautiful images and fails to reliably classify defects, or classifies them and fails to route the alert anywhere useful. The five layers below map what each does, why it matters, and where the deployment cost tends to concentrate.
L5
Reporting & Buyer Evidence Layer
Automated defect map per roll, grading record, exportable evidence pack for buyer claim resolution. This is what turns "the vision system saw something" into "here is the position, image, and severity of the deviation on roll number 4738" — and what changes the buyer conversation from denial to evidence.
L4
Decision & Alert Layer
Tolerance rules per defect category, alert routing to operator HMI, escalation to shift supervisor on repeated deviation, closed-loop signal to press control for automated correction where the press supports it. Without this layer, detections pile up in a log nobody reads.
L3
Detection & Classification Layer
Deep learning model trained on labeled defect examples from the mill's own production history, template comparison for pattern integrity, Delta-E calculation against calibrated targets. The model is only as good as the training data — investment in labeled defect examples pays back more than any hardware upgrade.
L2
Image Capture & Lighting Layer
4K to 8K line-scan cameras positioned after the final print head with controlled diffuse LED lighting, color-calibrated for Delta-E measurement, mounted for consistent geometry against the moving web. Lighting is the single most under-invested component on first deployments.
L1
Reference & Template Layer
Pattern reference loaded from design file or auto-generated from the first defect-free repeat of the current run, target color values calibrated against approved standards, tolerance envelopes defined per buyer specification. Without a reliable reference, no detection is possible at any camera resolution.
What the Numbers Look Like: Waste, Speed, and Return on Investment
The economic case for AI vision on textile printing lines is built on four numbers: print seconds reduction, downgrade rate reduction, buyer claim reduction, and labor redeployment. The ranges below are drawn from documented deployments across rotary and digital textile printing operations, and the honest answer is that the numbers depend heavily on where the mill starts. A mill running 10 percent print seconds with heavy manual inspection sees larger absolute improvement than a mill already at 4 percent with automated grading in place — but both see improvement, and the payback interval for both typically falls inside the eight-to-fourteen month window.
40-60%
Print Seconds Reduction
Print seconds — the portion of produced length graded below first quality — typically drops from 8-10 percent range down to 3-4 percent on lines running mixed pattern portfolios with AI vision monitoring registration and color drift continuously rather than at spot-check intervals.
8-14 mo
Return on Investment Interval
Typical payback interval for a single-line deployment covering registration, color, and pattern repeat inspection. Multi-line deployments and mills carrying high downgrade rates or frequent buyer claims see the interval compress toward the shorter end of the range.
3-5x
Detection Accuracy Improvement
Documented detection accuracy improvements over manual inspection range from 25 percent for simple structural defects up to 3-5x for subtle registration and color drift defects that manual inspectors reliably miss when moving quickly across long roll lengths at production speed.
100%
Web Inspection Coverage
Passive inspection systems using line-scan camera arrangements cover 100 percent of the printed web at full line speed — every centimeter of every roll, every shift, without the attention decay that limits human inspection accuracy across long shifts and repetitive patterns.
The most consistent finding across published deployments is that the return concentrates in three places: reduced downgrade stock heading to secondary channels at lower margin, reduced buyer claim resolution cost when the inspection evidence pack removes ambiguity from the claim conversation, and redeployed inspection labor moving from repetitive visual scanning to higher-value quality engineering and root-cause work. Mills that measure only the first of the three tend to undersell the deployment internally; mills that measure all three build the case for extending inspection to additional lines and finishing operations.
The Deployment Path: What the First Ninety Days Actually Look Like
Textile print vision deployments follow a fairly consistent arc when they succeed and a fairly consistent arc when they fail. The failure arc looks like: hardware installed in week one, model training deferred until "we have time," first three months producing false-positive alerts nobody trusts, system quietly deprioritized by month six. The success arc treats the ninety-day window as a structured deployment with defined milestones, defect library seeding done up front, and operator involvement built into the calibration cycle. The path below reflects what production deployments actually run.
Baseline & Defect Library Build
Camera installation, lighting calibration, initial defect library seeded from historical rejects and buyer claims, tolerance envelopes drafted per buyer specification, operator familiarization on the HMI and alert workflow. Deliverable at end of phase: system captures every meter, defect library covers 80 percent of historical defect types, tolerance drafts under review.
Model Training & False-Positive Reduction
Model trained against labeled defect examples, tolerance envelopes calibrated against operator judgment on live production, false-positive rate driven down to workable threshold, alert routing tuned so the operator receives actionable notifications rather than noise. Deliverable at end of phase: false-positive rate under 5 percent on primary defect categories, operator trust in the alert stream established.
Reporting Integration & Buyer Evidence
Defect map export configured for buyer evidence packs, grading record integrated with mill's quality management system, KPI dashboard exposed to shift supervisors and quality leadership, first month of continuous monitored production data available for review. Deliverable at end of phase: buyer evidence pack format validated on a real claim, downgrade trend data available for the previous 30 days.
Frequently Asked Questions
How does AI vision handle the constant pattern changes typical on textile printing lines?
Modern AI textile print inspection systems support template auto-generation from the first defect-free repeat of each new pattern loaded on the line. When a new design is introduced, the system captures the first clean repeat and uses it as the reference template for all subsequent comparison across that run. This eliminates the manual template creation burden that made earlier fixed-configuration vision systems impractical for mills running high design variety. Mills evaluating this capability can
Book a Demo to see auto-template generation on live production patterns.
What camera specification is actually required for reliable registration and color measurement?
Minimum 4K line-scan cameras are the baseline for textile print inspection, with 8K preferred where fine registration measurement below 0.2 mm matters or where fine detail patterns are common. Color-calibrated cameras with controlled diffuse LED lighting are essential for reliable Delta-E measurement below 0.5. The camera is important but the lighting layer is where most first-time deployments under-invest — inconsistent illumination geometry defeats even the best sensor and creates false-positive alerts that erode operator trust in the system over the first weeks of deployment.
Which Delta-E formula should we use for textile print color measurement — CIE76, CIE94, CIEDE2000, or CMC?
For textile print applications, CIEDE2000 or CMC(2:1) are the two formulas that correlate best with human perception of textile color differences and are the formulas most modern buyer specifications reference. CIE76 is the original formula and remains useful for rough tolerance work but under-represents perceptual differences in dark and saturated colors common in textile printing. Textile industry practice has largely converged on CMC(2:1) — designed specifically for textile applications — with CIEDE2000 gaining share as newer specifications adopt it. Mills should match the formula to what their major buyers specify, since the same nominal Delta-E value can differ significantly between formulas.
Can AI vision differentiate between rotary screen and digital inkjet print defect profiles automatically?
Yes — the underlying detection model is trained on defect examples from the specific printing technology it will inspect, so a model trained on rotary screen defects will not directly transfer to digital inkjet output and vice versa. This is a feature rather than a limitation: the two technologies produce fundamentally different defect profiles (screen wear versus nozzle misfire, cylinder synchronization versus head timing) and require distinct training data to detect reliably. Mills running both technologies deploy separate inspection profiles per line, sharing the same underlying platform but with technology-specific defect libraries and tolerance envelopes.
How does the inspection system connect to buyer claim resolution and quality reporting?
Every detected deviation logs with defect type, severity, precise roll-length position, and captured image, generating an automated defect map and grading record per roll. When a buyer claim is raised weeks after shipment, the mill retrieves the inspection record for the specific roll and lot, exports an evidence pack showing what the system observed during production, and uses the evidence to resolve the claim on facts rather than negotiation. Mills implementing this workflow can contact
iFactory Support for integration guidance on evidence pack formats and quality system connectivity.
TEXTILE PRINTING · AI VISION · REGISTRATION AND COLOR CONTROL
Turn Every Printed Meter Into Continuously Monitored, Evidence-Backed Production
iFactory monitors registration offset, Delta-E color deviation, and pattern repeat integrity on every centimeter of fabric leaving the print head — flagging drift in real time, generating buyer-ready evidence per roll, and reducing print seconds and downgrade stock across the printing operation.