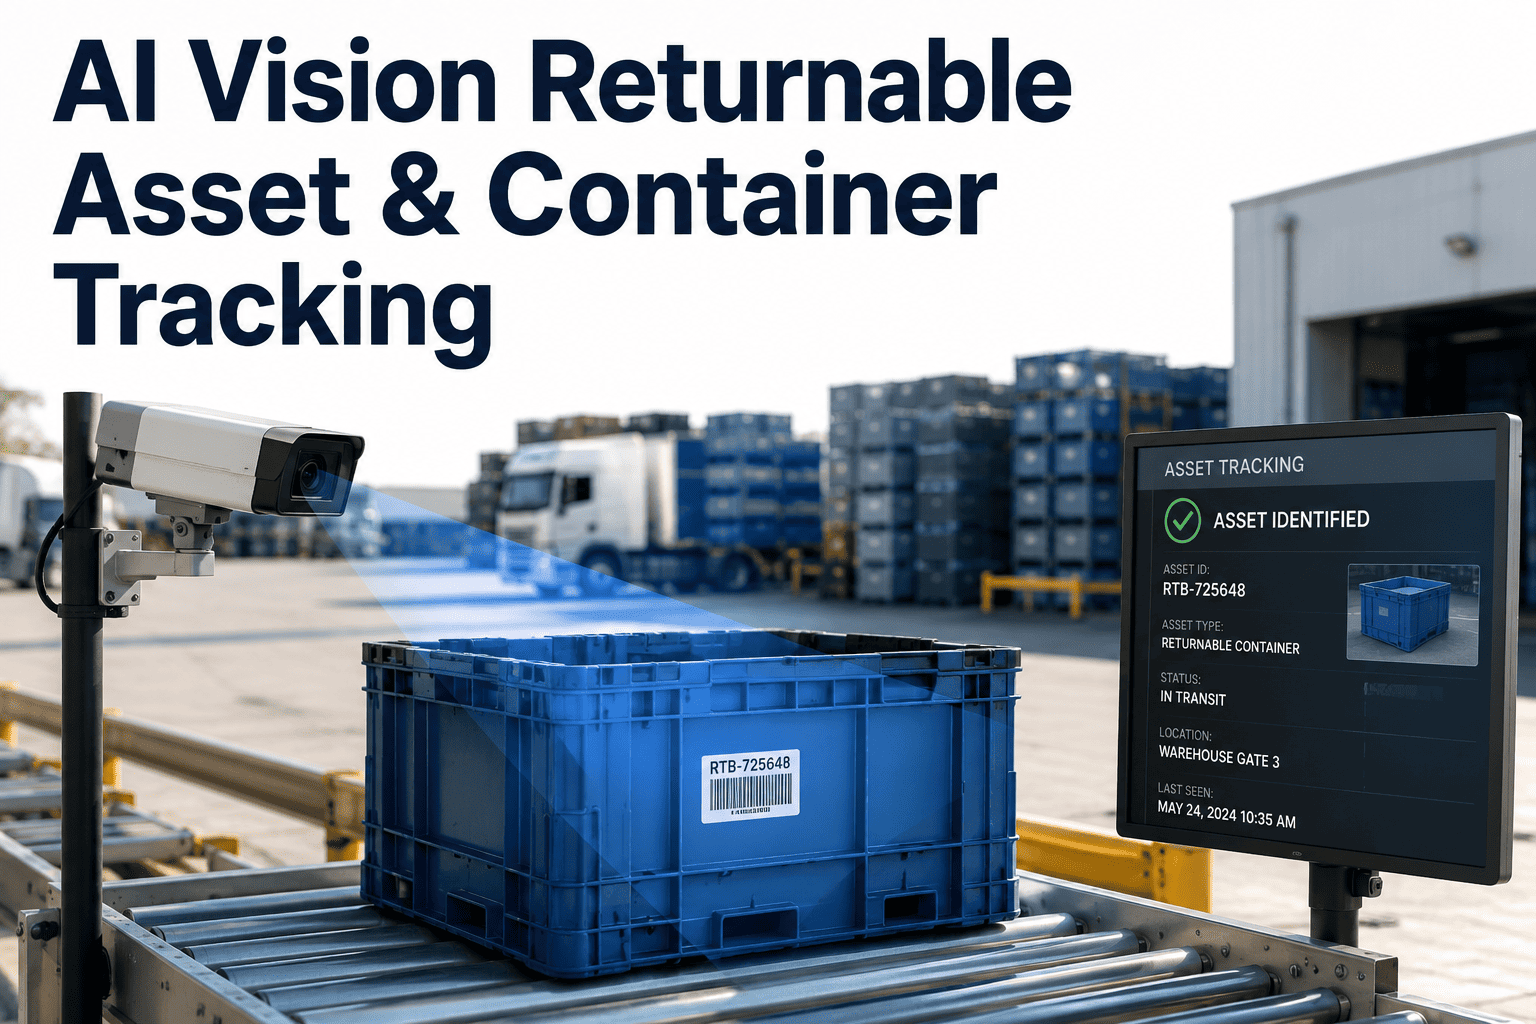
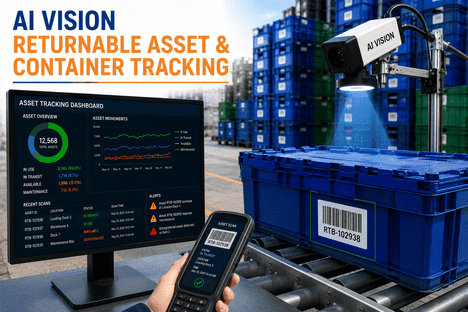
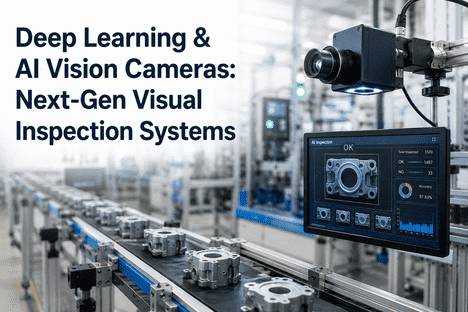
Returnable containers, totes, kegs, and IBCs are among the most expensive invisible assets on any logistics balance sheet because they move constantly between facilities, trading partners, and wash stations without a reliable real-time count at any of those handoff points. Most operations know how many assets they purchased but have no accurate picture of how many they actually have, where those assets are sitting right now, or how many are quietly disappearing from the fleet each quarter through loss, theft, or misrouting. The replacement cost alone is enough to justify a tracking program, but the larger and less visible cost is the over-purchasing that happens when operations teams cannot trust their fleet count and buy extra units just to ensure they have enough available assets to cover peak demand. AI vision tracking changes this by placing cameras at the key handoff points where assets change custody and counting every container automatically as it passes through, building a real-time ledger of asset location that manual barcode scans and paper logs can never achieve at scale. You can book a demo to see how AI vision counts and identifies your specific asset types at dock doors and staging areas.
RETURNABLE ASSET TRACKING · CONTAINER VISIBILITY · FLEET UTILIZATION · VISION AI
You Bought Thousands of Returnable Containers — Here Is How Many You Actually Have
iFactory's AI vision counts and classifies every tote, keg, and IBC as it passes through dock doors, wash stations, and fill points, giving you a real-time fleet count instead of an annual guess.
Typical Fleet Reality Check
At Customer or Partner Sites
THE SHRINKAGE PROBLEM
Returnable Fleet Shrinkage Is a Silent Leak That Compounds Every Quarter
Unlike raw material waste, which shows up on production reports, returnable container loss is diffuse and distributed across dozens of handoff points, making it nearly impossible to quantify without automated tracking at each custody transfer. The loss does not happen in a single dramatic event but through hundreds of small failures in manual counting, misdirected shipments, customer retention, and unrecorded damage disposals that individually seem insignificant but collectively drain the fleet over time.
Total Fleet in Circulation: 10,000 units
Units Passing Through Handoff Points This Quarter: 8,200
Units With Complete Custody Documentation: 7,400
Units Reconciled at Period End: 6,800
1,200 Units
Unaccounted Gap This Quarter — Equivalent to 12% of Fleet Lost Annually Without Detection
38%
Miscounted at Dock Doors
Manual counts during loading and unloading miss units stacked inside other containers or hidden behind freight, creating discrepancies that only surface during periodic physical audits weeks later when the trail is cold.
24%
Retained by Customer Sites
Downstream customers use returnable containers for internal storage or waste handling and do not return them on the scheduled backhaul, a problem that compounds when there is no per-unit tracking to identify which customer is accumulating assets.
18%
Damaged and Unrecorded Disposal
Containers damaged in transit or at customer sites are disposed of locally without being reported back to the fleet owner, so the asset is removed from circulation but never written off the ledger, inflating the recorded fleet size.
20%
Misrouted or Wrong Destination
Containers sent to the wrong customer or wrong facility sit untracked until someone notices a shortage at the intended destination, by which point the container may have been mixed into a different asset pool entirely.
ASSET REPLACEMENT COST
What Shrinking Fleets Actually Cost When You Replace What You Cannot Find
The replacement cost calculation is straightforward but rarely performed because most operations do not have an accurate baseline to measure against. The table below shows typical replacement costs by asset type and the annual replacement spend for a fleet that loses ten to fifteen percent of its units per year, which is the industry average for operations relying on manual tracking methods.
$438,900
Combined annual replacement spend across these six asset types for a single mid-size operation — before accounting for expedited purchase premiums, rush shipping, and the operational disruption of running short during peak seasons.
WHERE AI VISION TRACKS
Five Custody Transfer Points Where AI Vision Cameras Count Every Asset
Automated tracking does not require cameras everywhere an asset travels. It requires cameras at the points where custody changes hands, because those are the exact moments when counting errors, misrouting, and unrecorded movements introduce discrepancies into the fleet ledger. Placing AI vision at these five points creates a complete chain of custody from fill through delivery and return.
01
Fill and Pack-Out Stations
Cameras count and classify each container as it is filled and staged for shipment, creating the outbound record that every downstream count will be reconciled against. This eliminates the reliance on production batch records that track product volume but not individual container identity.
What the camera seesEmpty containers arriving, filled containers leaving the station
AI model taskClassify asset type, count units, record timestamp and direction
Data capturedAsset type, quantity, fill station ID, time out
02
Outbound Dock Doors
Cameras mounted above dock doors count every container as it leaves the facility on a trailer, comparing the visual count against the bill of lading and flagging discrepancies before the trailer is sealed and dispatched. This is the last point where a miscount can be corrected without involving the customer.
What the camera seesContainers moving from staging area into the trailer
AI model taskCount units by type, match against BOL, flag over or short
Data capturedTrailer ID, asset count by type, match or exception flag
03
Customer Receiving Docks
Cameras at customer sites or partner facilities count containers as they are unloaded, creating an independent receiving record that resolves disputes about whether a shortage occurred in transit or at the dock. For operations without cameras at customer sites, the outbound count from the shipper serves as the reference point, but customer-site cameras eliminate the he-said-she-said dynamic entirely.
What the camera seesContainers being unloaded from the trailer at the receiving facility
AI model taskCount received units, classify type, compare to shipper record
Data capturedReceiving site ID, count received, delta from shipper count
04
Inbound Return Dock Doors
When empty containers return on backhaul or dedicated return shipments, cameras count them as they arrive and classify their condition, separating clean returns from damaged units that need to go to repair or disposal rather than back into the clean fleet pool.
What the camera seesEmpty containers arriving on return trailers or backhaul vehicles
AI model taskCount returns, classify condition, route clean vs damaged
Data capturedReturn quantity, condition classification, source customer
05
Wash and Reconditioning Lines
Cameras at wash stations count containers entering and exiting the wash cycle, which serves two purposes. First, it confirms that the number of clean containers available for the next fill cycle matches what was sent to wash. Second, it flags containers that enter wash but do not exit, which indicates units removed for damage or maintenance that were not properly documented.
What the camera seesDirty containers entering wash, clean containers exiting to staging
AI model taskCount in and out, flag delta, classify by type for restocking
Data capturedWash in count, wash out count, delta, clean inventory added
See Your Actual Fleet Count Compared to What Your Ledger Says You Have
iFactory's AI vision audits your returnable containers at every handoff point and shows you exactly where the gaps are. Book a demo and bring your fleet data.
DETECTION BY ASSET TYPE
AI Vision Detection Performance Across Common Returnable Asset Categories
Detection accuracy varies by asset type because of differences in shape consistency, surface markings, stacking behavior, and the degree to which assets of different types look similar to each other in a mixed load. The performance data below reflects real-world accuracy across deployed systems after initial calibration, not lab conditions.
Detection StrengthLarge size, consistent rectangular shape, distinct from other asset types
ChallengeSimilar appearance when stacked, requiring side-view camera for individual count
Best Camera AngleOverhead for single-layer, side profile for stacked configurations
Stainless Steel Kegs
98.7%
Detection StrengthHighly consistent cylindrical shape, metallic surface reflects light distinctly
ChallengeTight nesting in pallets makes individual boundary detection harder in dense loads
Best Camera AngleOverhead with controlled lighting to reduce specular reflection
Detection StrengthDistinct shape with reinforced rims and footings that create clear edges
ChallengeColor fading and surface contamination in food-grade wash cycles
Best Camera AngleAngled side view captures rim profile even when nested or stacked
RPCs and Plastic Totes
97.4%
Detection StrengthHigh volume per shipment creates large training dataset quickly
ChallengeNested totes look like a single unit from above, similar sizes across brands
Best Camera AngleSide profile with depth perception to count nested stacks accurately
Wooden and Metal Pallets
96.8%
Detection StrengthFlat profile makes overhead counting straightforward when separated
ChallengeWooden pallets vary in condition, broken boards change the visual profile
Best Camera AngleOverhead with edge detection to separate stacked pallets
Insulated Containers
98.1%
Detection StrengthUnique shape and size compared to other returnable asset types
ChallengeTape, labels, and external packaging obscure the container profile
Best Camera AngleMultiple angles to capture shape even when partially covered
MANUAL VS AI COUNTING
Manual Dock Counts vs AI Vision Counts — Where the Discrepancies Live
The accuracy gap between manual and AI counting is not constant. It widens under exactly the conditions that matter most: high-speed loading, mixed asset types on the same trailer, and late-shift operations where attention and staffing are both reduced. The comparison below shows where manual counts fail and why AI vision maintains accuracy across those same conditions.
Manual Counting
Single asset type, daytime, moderate speed
95% accuracy
Mixed asset types on same trailer
86% accuracy
High-speed loading under 60 seconds per dock
82% accuracy
Night shift or reduced staffing
78% accuracy
Stacked or nested containers
74% accuracy
AI Vision Counting
Single asset type, daytime, moderate speed
99.2% accuracy
Mixed asset types on same trailer
98.4% accuracy
High-speed loading under 60 seconds per dock
97.1% accuracy
Night shift or reduced staffing
98.0% accuracy
Stacked or nested containers
96.5% accuracy
The widest gap between manual and AI accuracy appears precisely in the conditions that drive the most shrinkage: fast turnarounds, mixed loads, and off-peak hours. These are the scenarios where the majority of uncounted containers disappear from the ledger.
FLEET UTILIZATION IMPACT
What Happens to Fleet Utilization When You Actually Know Where Your Assets Are
Fleet utilization is the metric that justifies the tracking investment beyond shrinkage reduction alone. Operations that cannot locate their assets reliably maintain buffer stock that sits idle most of the time, while simultaneously running short during peaks because the buffer was not large enough to cover the untracked losses. AI visibility transforms utilization by eliminating both the hidden shortage and the excess buffer.
Before AI Tracking
Assets Sitting Idle at Any Time
Unaccounted or Lost Assets
Without tracking, operations order 15-20% more assets than needed to cover uncertainty, but still experience stockouts because they cannot locate the surplus when demand spikes.
After AI Tracking
Assets Sitting Idle at Any Time
Unaccounted or Lost Assets
With real-time location data, operations right-size their fleet by eliminating surplus purchases and redeploying idle assets from low-demand locations to cover peaks elsewhere.
DEPLOYMENT APPROACH
Phased Deployment From Single Dock Door to Full Fleet Visibility
Full fleet visibility does not require deploying cameras at every checkpoint simultaneously. A phased approach lets the operation validate accuracy on a single high-traffic dock door before extending to additional points, which builds internal confidence in the data and surfaces integration requirements incrementally.
Phase 1: Weeks 1-3
Single Checkpoint Pilot
Cameras are installed at the highest-volume outbound dock door, and the AI model is calibrated to the asset types moving through that door. The system runs in shadow mode alongside manual counts for two weeks to validate accuracy before going live, giving the dock team time to see the results and build trust in the data.
1 to 2 cameras at one dock door
Edge processing unit installed locally
Shadow mode validation for 2 weeks
Accuracy benchmark report generated
Phase 2: Weeks 3-6
Outbound and Inbound Coverage
Cameras are added to additional outbound and inbound dock doors to create a complete picture of containers leaving and returning to the facility. The system begins reconciling outbound counts with inbound return counts, producing the first automated net-fleet-change report that replaces the manual periodic audit.
3 to 6 cameras across multiple docks
Outbound-inbound reconciliation active
Automated exception alerts deployed
Dashboard access for logistics and finance
Phase 3: Weeks 6-10
Internal Process Points Added
Cameras are installed at fill stations, wash lines, and staging areas to track containers through internal processes. This closes the gaps between dock doors and production, so a container that leaves fill but never reaches the dock is flagged immediately rather than discovered during the next physical audit.
4 to 8 additional internal cameras
Fill-to-dock reconciliation active
Wash in-out delta tracking live
Condition classification at wash enabled
Phase 4: Ongoing
Partner Sites and Fleet Optimization
For operations where customer or partner sites participate, cameras are deployed at key receiving and return points outside the home facility. With full visibility across the network, the system shifts from loss detection to fleet optimization, recommending asset redistribution, identifying consistently late-returning customers, and right-sizing fleet purchases.
External site cameras as agreed
Cross-facility asset location map
Customer return performance ranking
Fleet right-sizing recommendations
MEASURED RESULTS
Outcomes Reported After Deploying AI Vision Returnable Asset Tracking
The figures below reflect tracked results across logistics and manufacturing operations that deployed AI vision cameras at dock doors and internal process points for returnable container tracking, measured over six or more months against each operation's pre-deployment baseline.
72%
Reduction in Annual Fleet Shrinkage
Operations that previously lost ten to fifteen percent of their fleet annually reduced that rate to two to four percent after AI tracking made every handoff count visible and accountable.
38%
Reduction in Replacement Purchases
With accurate fleet counts, operations stopped buying surplus containers to cover untracked losses and instead purchased only to support genuine fleet expansion or planned end-of-life replacement.
25%
Improvement in Fleet Utilization Rate
Real-time visibility allowed operations to locate and redeploy idle assets from low-demand locations to cover peaks, reducing the need for buffer stock that spent most of the year sitting empty.
85%
Reduction in Customer Disputes Over Asset Counts
Automated count records with timestamped images eliminated the he-said-she-said dynamic at receiving docks, replacing argument with evidence that both parties could review and accept.
FREQUENTLY ASKED QUESTIONS
Questions Logistics and Fleet Management Teams Ask About AI Asset Tracking
How does AI vision tracking differ from RFID or barcode scanning for returnable containers?
RFID and barcode scanning require every container to have a readable tag or label that is physically scanned at each checkpoint, which means damaged labels, missing tags, and containers from partner fleets that use different tagging standards all create blind spots. AI vision does not require any tag or label on the container at all because it identifies the asset by its physical shape and appearance, which means it works on untagged containers, containers with damaged labels, and mixed fleets from multiple owners without any standardization effort. The tradeoff is that vision cannot assign a unique serial number to visually identical containers, but for fleet-level counting and custody tracking that is rarely necessary since the goal is knowing how many units of each type passed a point, not which specific unit it was.
Book a demo to see how vision handles your mixed fleet.
Can the system distinguish between different sizes of the same asset type, like 275-gallon and 330-gallon IBCs?
Yes, the AI model is trained to classify assets at the granularity level required by the operation, which can include distinguishing between size variants of the same container family. For IBCs, the height and cage frame differences between common sizes are visually distinct enough for the model to classify reliably. For plastic totes where size differences are smaller, the model uses multiple visual features including rim profile, base dimensions, and stacking interlock patterns to differentiate. During the calibration phase, the model is trained on examples of each size variant that moves through the facility, and the classification granularity is set to match what the logistics team needs for accurate fleet management.
Contact support to discuss your specific size classification requirements.
What happens when containers are heavily soiled, frost-covered, or wrapped in shrink film?
The AI model is trained on images from actual operating conditions, not clean catalog photos, so it learns to recognize asset shapes through the surface contamination, frost, and packaging materials that are normal in logistics environments. Shrink-wrapped pallets of totes are handled by recognizing the overall pallet profile and estimating the unit count from the pallet dimensions and known stacking patterns for that asset type. For extreme cases where the visual profile is completely obscured, the system flags the passage as unclassified rather than guessing, which prevents false counts from being added to the ledger. Operations can then decide whether to manually count that specific load or accept the flagged gap for investigation.
Book a demo to see how the model handles your typical loading conditions.
How does the system integrate with our existing TMS or WMS for asset tracking?
The iFactory platform exports count and classification data through standard API interfaces that connect to common warehouse management and transportation management systems. Each count event includes the timestamp, checkpoint location, asset type classification, count quantity, and direction of travel, which maps directly to the receipt and shipment transaction records that TMS and WMS systems use for inventory reconciliation. The integration does not replace the TMS or WMS asset tracking module but feeds it verified visual count data instead of the manual entry or barcode scan data that currently populates those fields, improving the accuracy of the records without changing the downstream system workflows.
Contact support to discuss integration with your specific systems.
Do we need cameras at every dock door to get useful data, or can we start with a subset?
Most operations start with cameras at two to three highest-volume dock doors and get immediate value from the improved accuracy at those points alone, even before the system is extended to full coverage. The priority docks are typically the ones handling the highest-value assets like IBCs and stainless kegs, or the doors with the fastest turnaround times where manual counts are most error-prone. Once the pilot docks validate the accuracy and the logistics team begins using the data for reconciliation, the business case for extending to additional doors becomes much clearer because the shrinkage reduction and dispute resolution value can be quantified from real results rather than projections.
Book a demo to plan your phased rollout.
Your Fleet Ledger Says You Have 10,000 Containers — AI Vision Tells You How Many You Actually Have
Stop guessing and start counting. iFactory's AI vision tracks every returnable container at every handoff point so you know exactly where your fleet is and how many you are really losing. Book a demo.