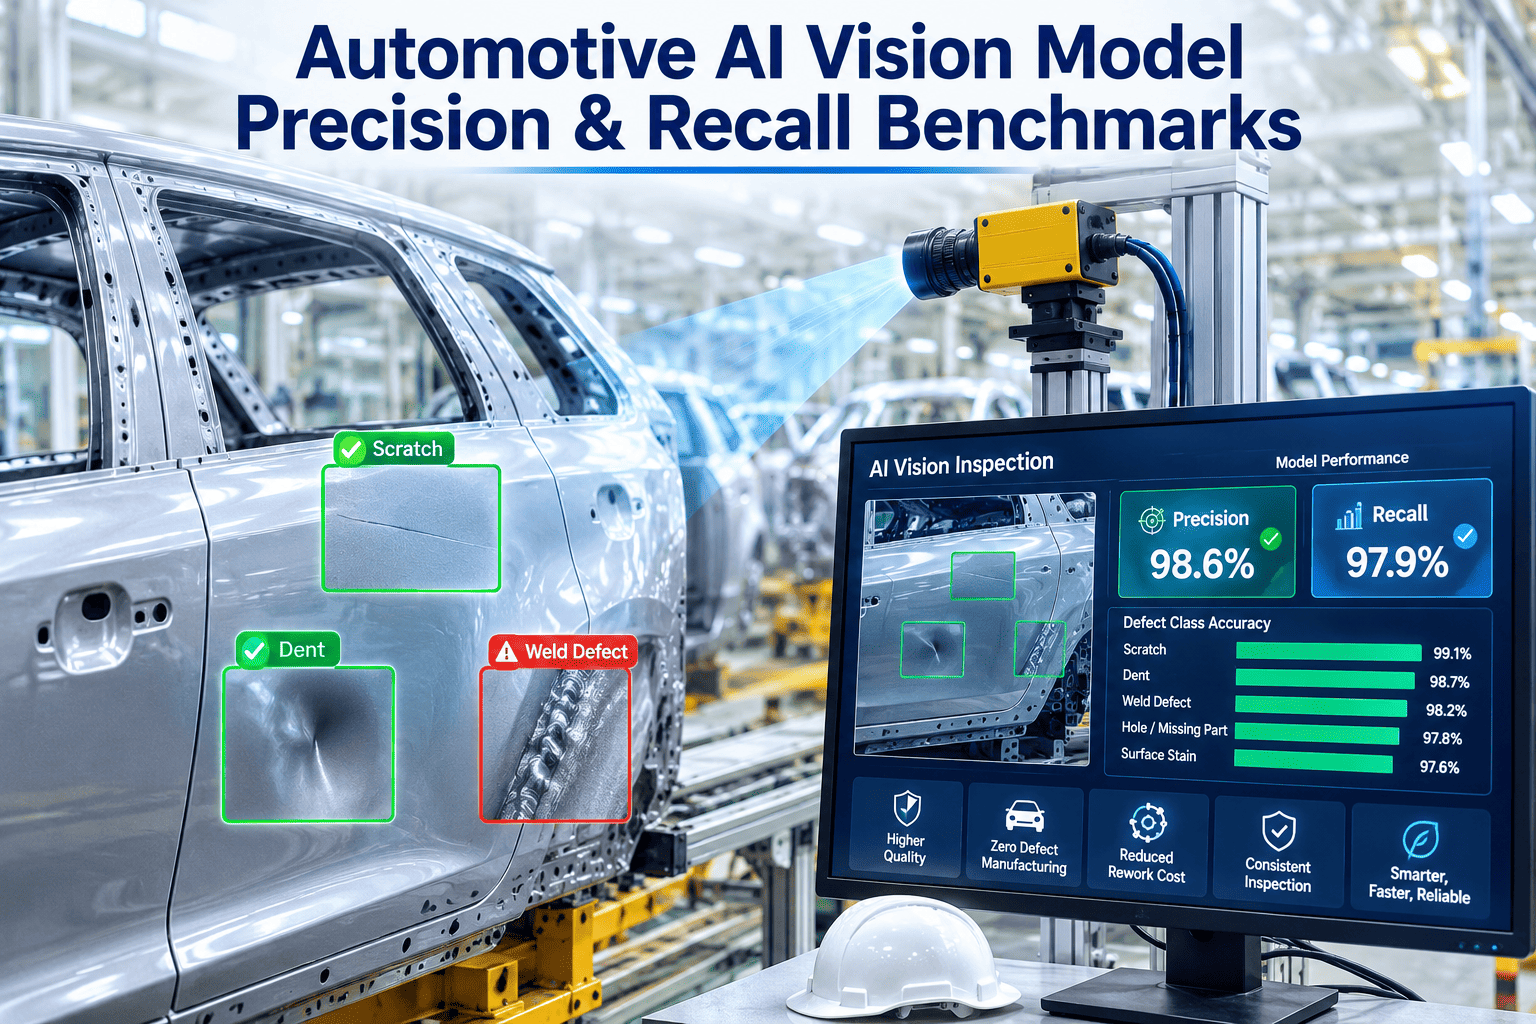
Every automotive plant running AI vision inspection eventually has the same uncomfortable conversation. A vendor pitches 99 percent accuracy in a conference room, but when the system goes live on the line, the quality engineers start counting false positives that trigger unnecessary manual rechecks, and false negatives that let defective parts reach the customer. The gap between presentation accuracy and production accuracy is not a deception — it is a difference in how the metrics are calculated, what samples they are calculated against, and whether the test dataset resembles anything that actually runs through your plant. For a Spoke-level engineer responsible for validating AI models before deployment, the only benchmarks that matter are the ones measured on real plant data, with transparent precision, recall, and F1 scores broken out by defect class, not buried in an aggregate number. iFactory publishes its full benchmark data across weld, paint, stamping, assembly, and final visual models so you can evaluate model fitness before committing to a pilot.
Why Precision-Recall Framing Exposes What Accuracy Hides
Overall accuracy is a dangerous metric in automotive vision inspection because defect rates are typically low — often below 2 percent of total throughput. A model that simply guesses "no defect" on every part achieves 98 percent accuracy while catching zero actual defects. Precision and recall eliminate this illusion by forcing the model to demonstrate that it can find real defects (recall) without flooding the line with false alarms (precision). F1 score provides a single-number summary that balances both, but any Spoke engineer worth their salt knows that the F1 number alone is still insufficient — you need the precision and recall components separately because the cost of a false positive and the cost of a false negative are dramatically different in automotive manufacturing.
A false positive on a weld inspection station means a good part gets flagged for manual recheck, adding 30 to 90 seconds of labor per false alarm. At a station processing 400 parts per hour, a 5 percent false-positive rate generates 20 unnecessary rechecks per hour — roughly 10 hours of wasted labor per shift. A false negative on that same station means a defective weld ships to the customer, which in automotive can mean a warranty claim, a field action, or a safety recall. The precision-recall frame forces the model to prove it can operate within the false-positive budget that operations will tolerate while still catching defects at a rate that quality and legal can defend.
Each false alarm pulls a quality technician off their scheduled tasks to visually inspect and disposition a part that was already good. The labor cost compounds across shifts and across stations. At 20 false alarms per hour across three shifts, a single station can consume 60 hours of technician labor per day on rechecks that should never have been triggered.
A missed weld defect, paint inclusion, or stamping crack that passes inspection and enters the vehicle assembly stream can propagate through multiple downstream stations before discovery — or worse, reach the end customer. The cost ranges from a single-vehicle warranty repair to a multi-million-dollar recall affecting tens of thousands of vehicles. No precision-recall tradeoff justifies a false-negative rate that does not align with the plant's escape rate targets.
Weld Inspection Benchmarks — 84,000 Sample Dataset
The weld inspection model was validated on a dataset of 84,271 labeled weld images collected from resistance spot weld stations at two US automotive body-in-white plants. The dataset spans three vehicle platforms, four thickness combinations (0.6/0.6mm, 0.7/0.8mm, 1.0/1.2mm, 1.5/1.5mm), and seven defect classes including expulsion, undersized nugget, surface crack, stick weld, miss, edge weld, and indentation. Every image was labeled by a certified welding inspector and reviewed by a second independent inspector, with disagreements resolved by a senior metallurgist before inclusion in the validation set.
| Weld Defect Class | Samples | Precision | Recall | F1 | Primary FP Driver |
|---|---|---|---|---|---|
| Expulsion | 18,420 | 97.2% | 96.8% | 97.0% | Surface spatter from adjacent welds |
| Undersized Nugget | 14,830 | 93.4% | 91.2% | 92.3% | Nugget size at tolerance boundary |
| Surface Crack | 11,205 | 98.1% | 95.4% | 96.7% | Surface scratches from handling |
| Stick Weld | 9,870 | 95.6% | 93.1% | 94.3% | Normal electrode mark variation |
| Miss | 8,140 | 99.1% | 98.8% | 98.9% | Shadow variation at weld location |
| Edge Weld | 12,560 | 94.8% | 92.6% | 93.7% | Panel edge geometry variation |
| Indentation | 9,246 | 93.7% | 90.8% | 92.2% | Normal panel surface contour |
Paint Surface Benchmarks — 41,000 Sample Dataset
The paint surface model was validated on 41,385 labeled images from clearcoat and basecoat inspection stations at a US automotive paint shop. The dataset covers five body styles, four color families (solid black, metallic silver, pearl white, tri-coat red), and eight defect classes including dirt inclusion, orange peel, runs and sags, fish eyes, solvent pop, scratch, mottle, and bare spot. Paint surface inspection is visually harder than weld inspection because many defect classes have diffuse boundaries and their appearance shifts dramatically with color family and lighting angle, which is why the per-class variance in this benchmark is wider.
| Paint Defect Class | Samples | Precision | Recall | F1 | Primary FP Driver |
|---|---|---|---|---|---|
| Dirt Inclusion | 8,920 | 94.1% | 96.2% | 95.1% | Fiber particles on surface |
| Orange Peel | 6,340 | 88.3% | 91.7% | 89.9% | Normal texture variation by color |
| Runs and Sags | 5,210 | 96.8% | 97.1% | 96.9% | Normal vertical surface variation |
| Fish Eyes | 4,580 | 91.2% | 93.4% | 92.3% | Surface tension variation in metallics |
| Solvent Pop | 3,890 | 93.5% | 94.8% | 94.1% | Pinhole from primer outgassing |
| Scratch | 5,670 | 90.8% | 95.3% | 93.0% | Polishing marks and cloth trails |
| Mottle | 3,420 | 86.7% | 89.1% | 87.9% | Normal metallic flake variation |
| Bare Spot | 3,355 | 98.4% | 97.8% | 98.1% | Shadow at panel edges and seams |
Stamping, Assembly, and Final Visual Benchmarks
Beyond weld and paint, AI vision in automotive extends to stamping defect detection, assembly verification, and final vehicle visual inspection. These three domains have different defect distributions and different cost structures for misclassification, which produces distinct precision-recall profiles. Stamping models deal with high-contrast defects on bare metal, which makes detection easier but classification harder because crack, split, wrinkle, and edge wave share overlapping visual features. Assembly models are primarily geometric — checking fastener presence, bracket orientation, seal placement — where the challenge is not finding the feature but confirming its position within tight tolerances. Final visual models face the broadest defect space of all, encompassing everything from panel gap inconsistency to interior trim misalignment to missing components.
How the Validation Dataset Was Built — No Synthetic Shortcuts
The credibility of any benchmark rests entirely on the dataset it was measured against. Datasets built from synthetic defect generation, from public image repositories, or from a single plant running a single product will produce numbers that do not transfer to your production environment. The iFactory automotive benchmarks were built using a specific methodology designed to maximize real-world transferability, and the steps below describe that process so you can evaluate whether the dataset characteristics match your plant's conditions closely enough for the benchmark numbers to be meaningful.
Samples collected from two body-in-white plants and one paint shop across different US states, different OEM platforms, and different shift patterns. This ensures the dataset includes natural variation in lighting degradation, camera drift, operator handling differences, and material batch variation that a single-plant dataset would miss.
Every sample was labeled independently by two domain experts — certified welding inspectors for weld data, experienced paint inspectors for paint data, and stamping quality engineers for stamping data. Samples where the two experts disagreed were sent to a third senior reviewer for adjudication. Only samples with a final agreed-upon label entered the validation set.
The dataset was split into training, validation, and test sets using time-based stratification rather than random sampling. Training data comes from earlier production periods, and test data comes from later production periods. This prevents data leakage and ensures the benchmark measures the model's ability to generalize to future production, not its ability to memorize known samples.
The test set maintains the natural defect rate of production — roughly 1.5 to 2.5 percent defective — rather than the artificially balanced 50/50 split used in many published benchmarks. This means the precision and recall numbers reflect performance under realistic operating conditions where the model sees mostly good parts and must remain alert to rare defects.
Benchmark-to-Production Gap — What Changes When the Model Leaves the Lab
No benchmark survives contact with production unchanged. When a model validated on a curated test set is deployed on a live line, three things happen simultaneously: the lighting drifts as fixtures age, the defect distribution shifts as material suppliers change, and the model encounters defect variants that were not represented in the original dataset. Plants that treat the benchmark F1 number as a guaranteed production F1 are setting themselves up for disappointment. Plants that treat the benchmark as a starting point and build a continuous monitoring process around it are the ones where AI vision becomes a permanent part of the quality infrastructure.
LED fixtures lose 5 to 10 percent of their output in the first 2,000 hours and continue degrading slowly thereafter. Reflector surfaces accumulate dust and overspray in paint environments. The combined effect shifts the pixel intensity distribution that the model's input layer expects, which disproportionately affects defect classes that rely on subtle contrast differences — orange peel, mottle, and undersized nugget are the most sensitive. On-prem deployment packages include automated lighting stability monitoring that alerts when drift exceeds the calibrated threshold before F1 degradation becomes measurable.
Steel coil suppliers change surface finish characteristics between batches, paint suppliers adjust formulation slightly between lots, and electrode cap manufacturers introduce subtle geometry variations. Each of these changes the visual appearance of both good parts and defective parts in ways that the training data did not capture. The impact is largest when a supplier change happens without notification — the model continues running with no awareness that the input distribution has shifted. iFactory's platform includes drift detection that monitors the feature distribution of incoming images and flags when the current production run falls outside the trained distribution envelope.
No validation dataset covers every defect variant that will ever appear on a production line. New tooling wear patterns, new operator handling habits, and new process parameter combinations create defect appearances that the model has never seen. The model will typically classify these as the nearest known class with low confidence rather than missing them entirely, which is why the recall impact is usually smaller than the precision impact — the defect gets caught but classified imprecisely, sometimes triggering a false positive on the wrong class. The low-confidence routing mechanism ensures these unseen variants reach the human review queue rather than being silently misclassified.
A model that benchmarks at 95.3 percent F1 in the lab but runs on a cloud API with 200 milliseconds of inference latency will underperform a model that benchmarks at 93.0 percent F1 but runs on-premises with 15 milliseconds of latency, because the on-prem model can inspect every part at full line speed while the cloud model requires frame skipping or batching that introduces sampling gaps. In automotive body-in-white, those gaps translate directly to missed defects on specific welds or panel locations. On-prem deployment also eliminates the data sovereignty concern that prevents many automotive plants from sending production images to external cloud servers. iFactory's platform deploys entirely within the plant's network, with model inference running on edge hardware co-located with the cameras. The benchmark numbers published above were measured on that same on-prem hardware configuration, not on cloud GPUs that will not be available in production.