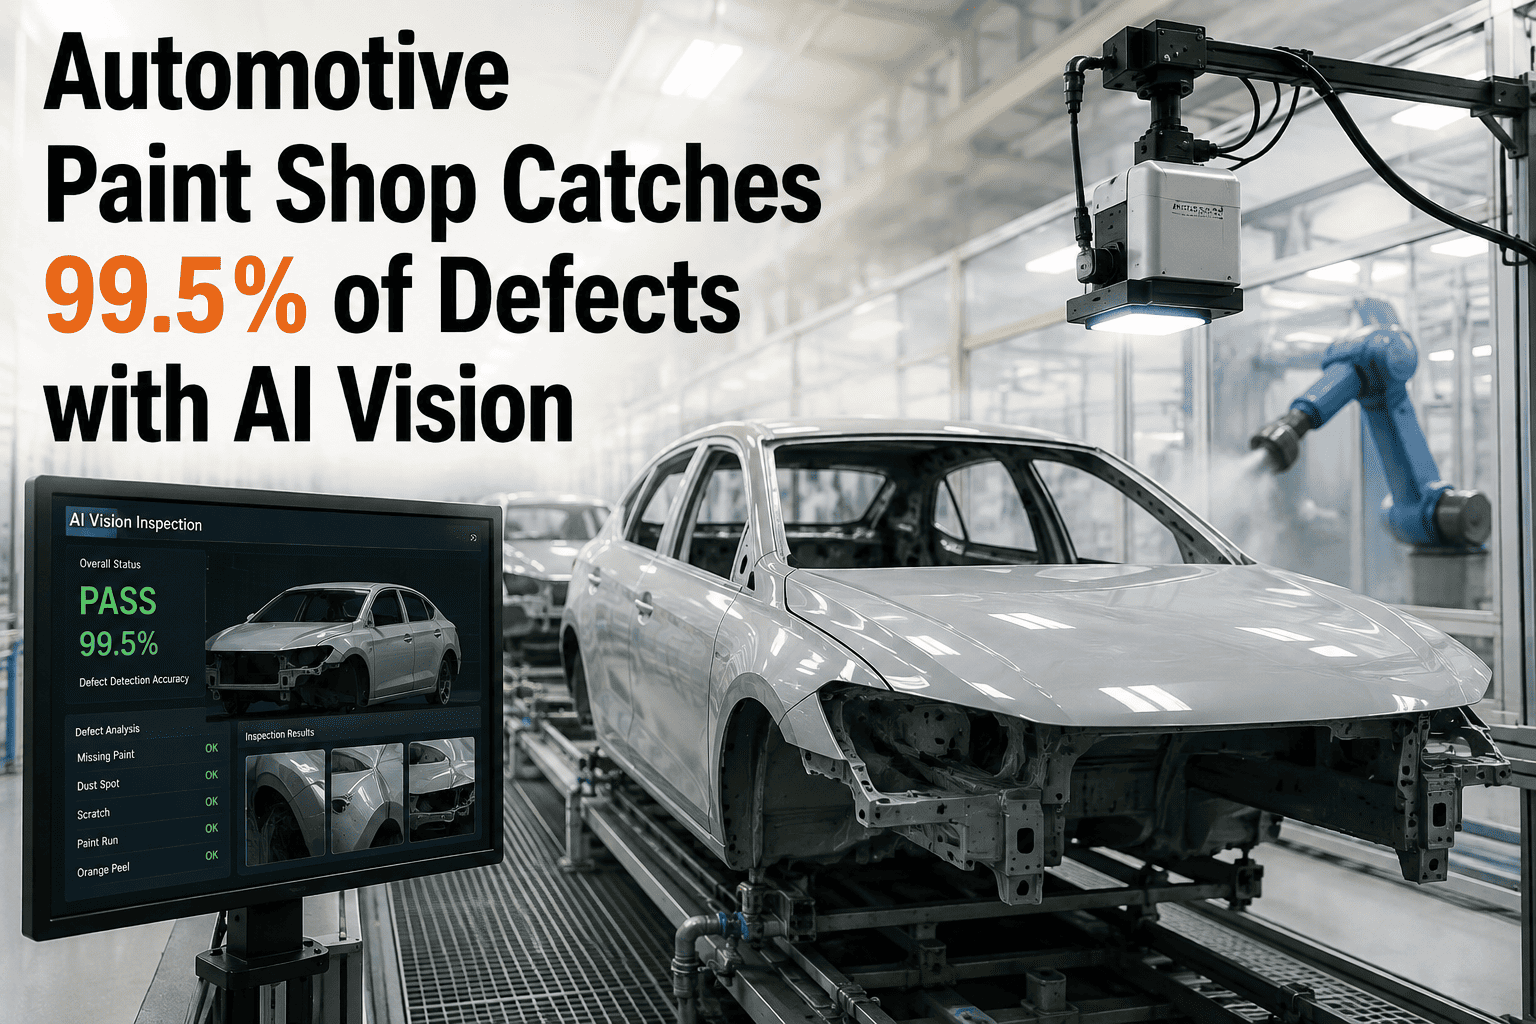
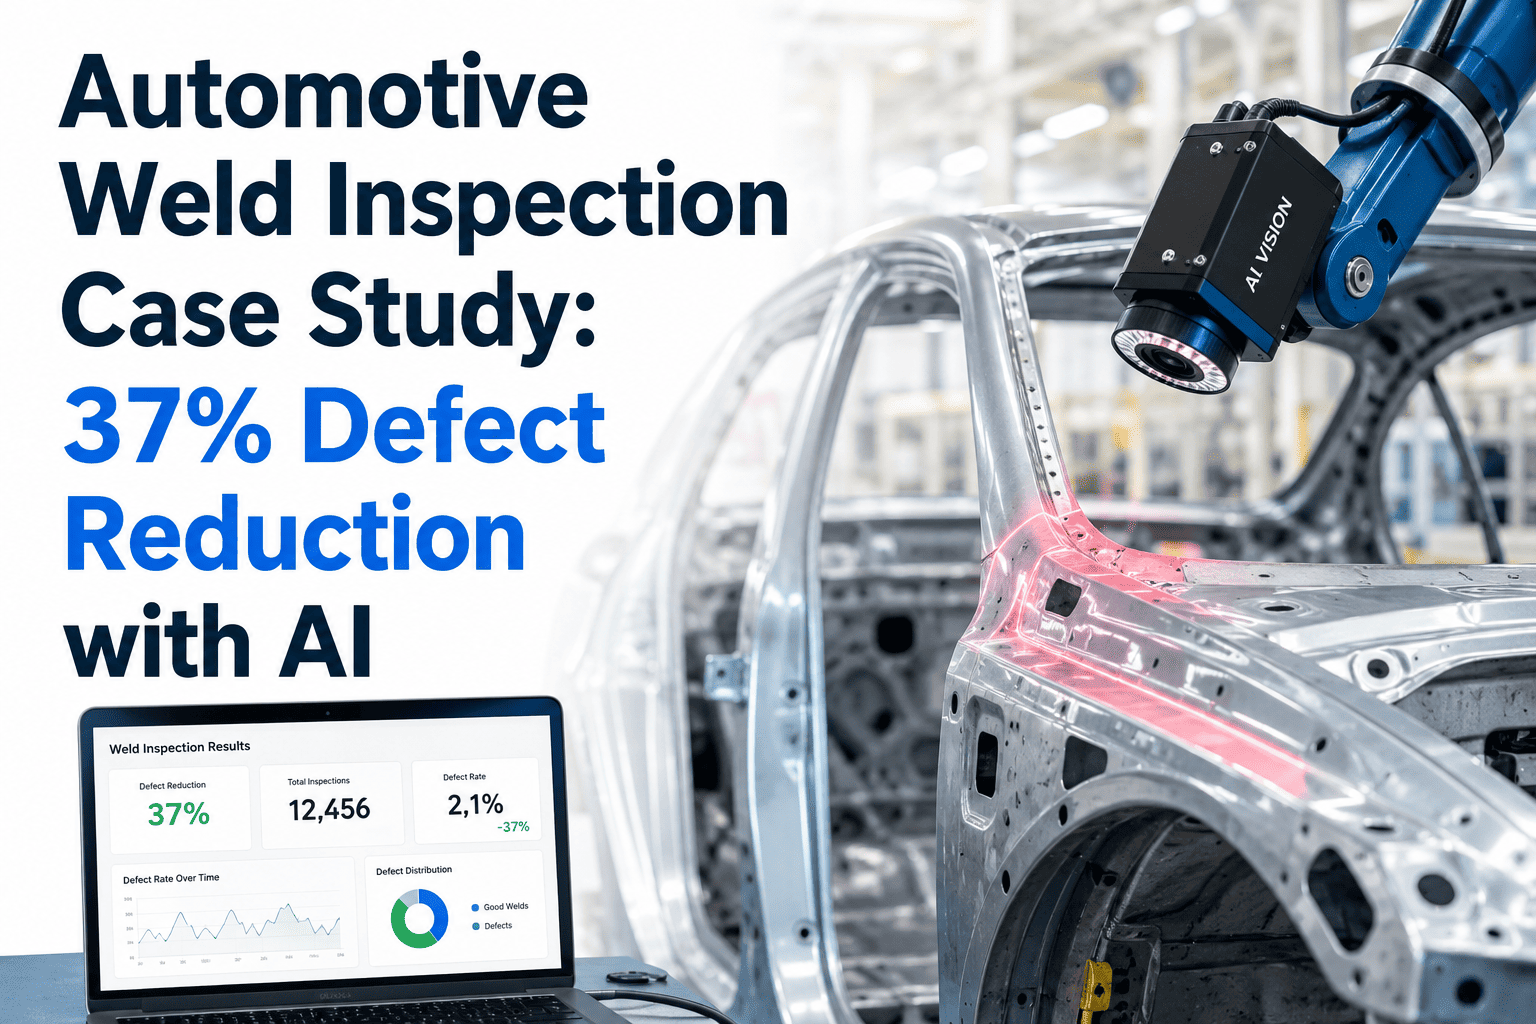
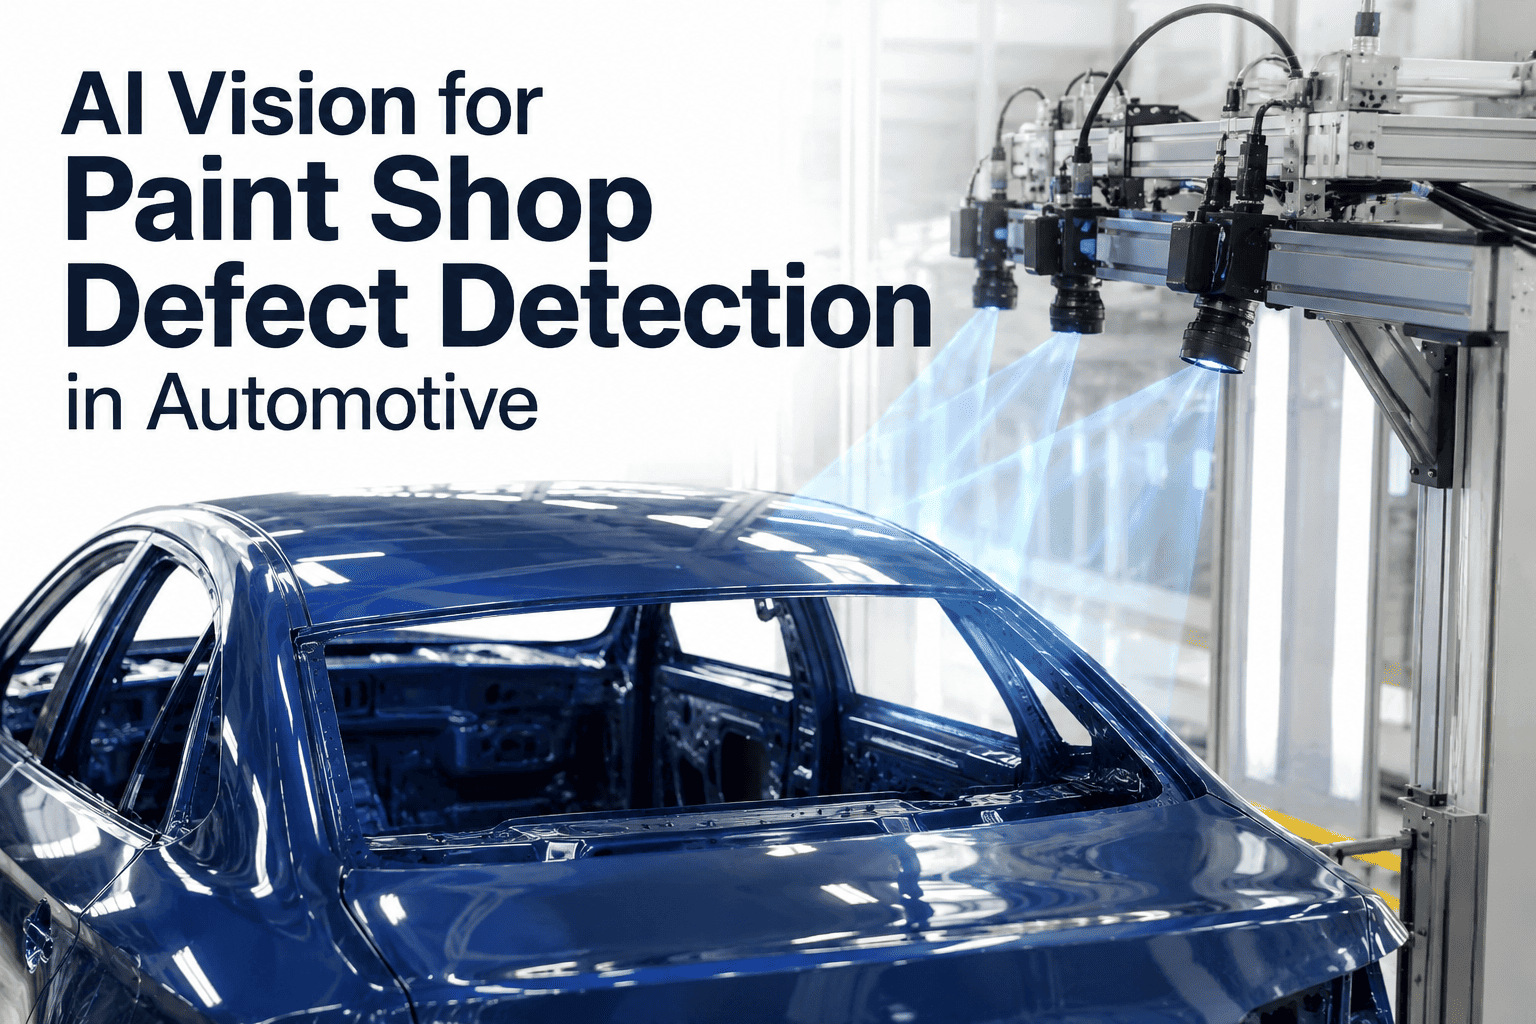
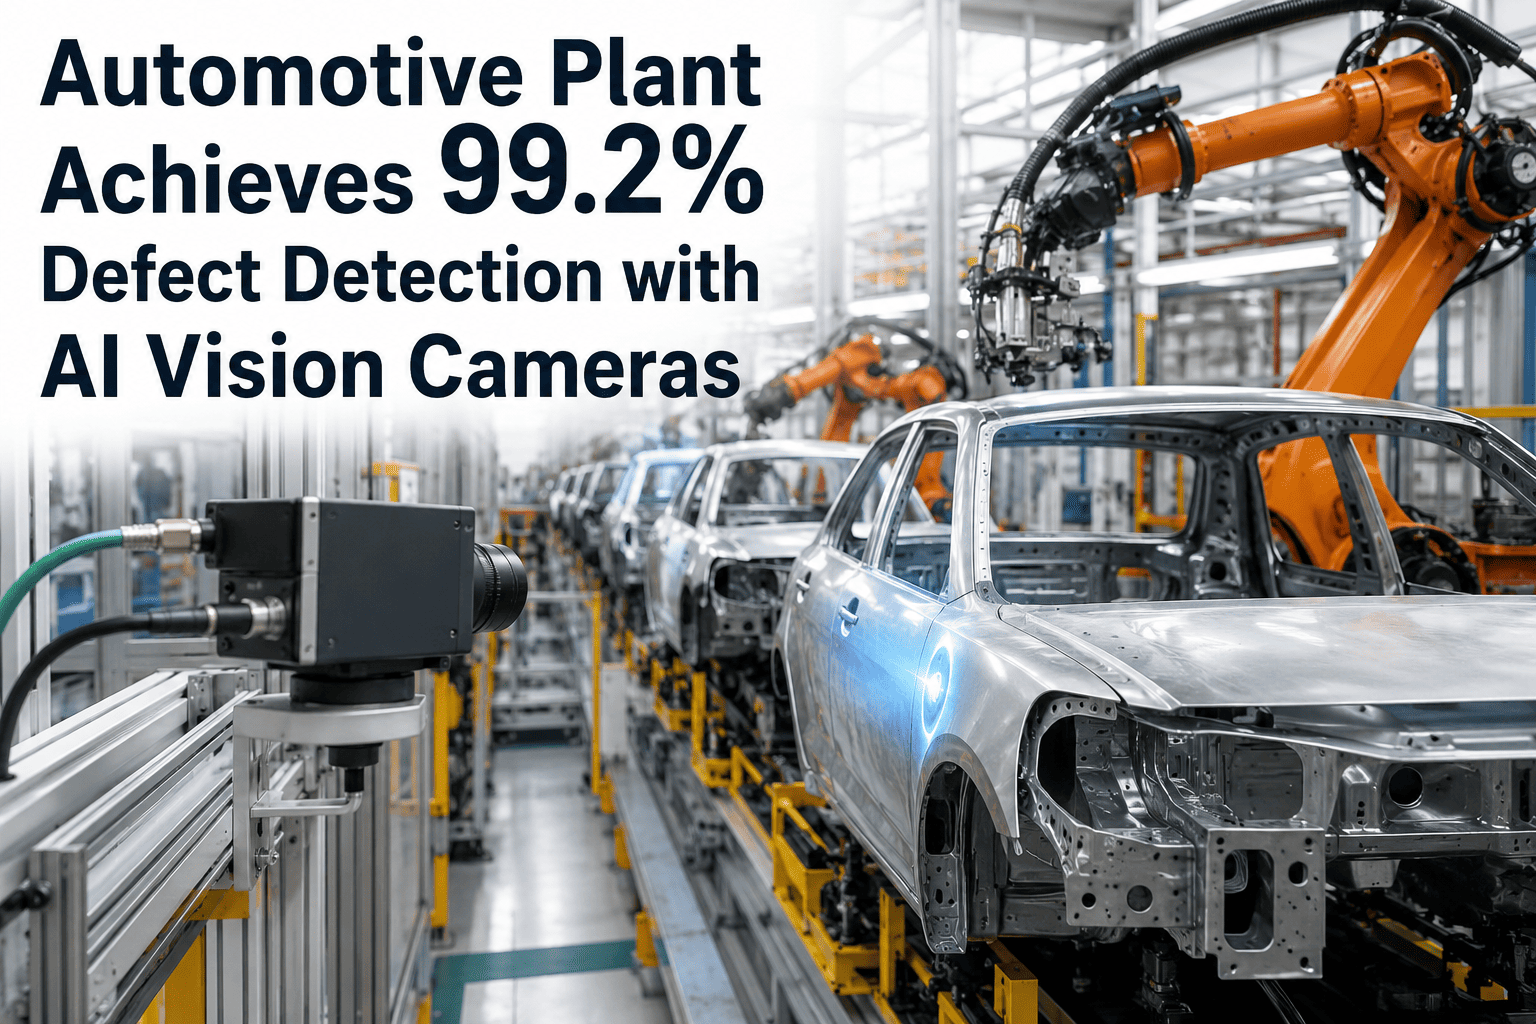
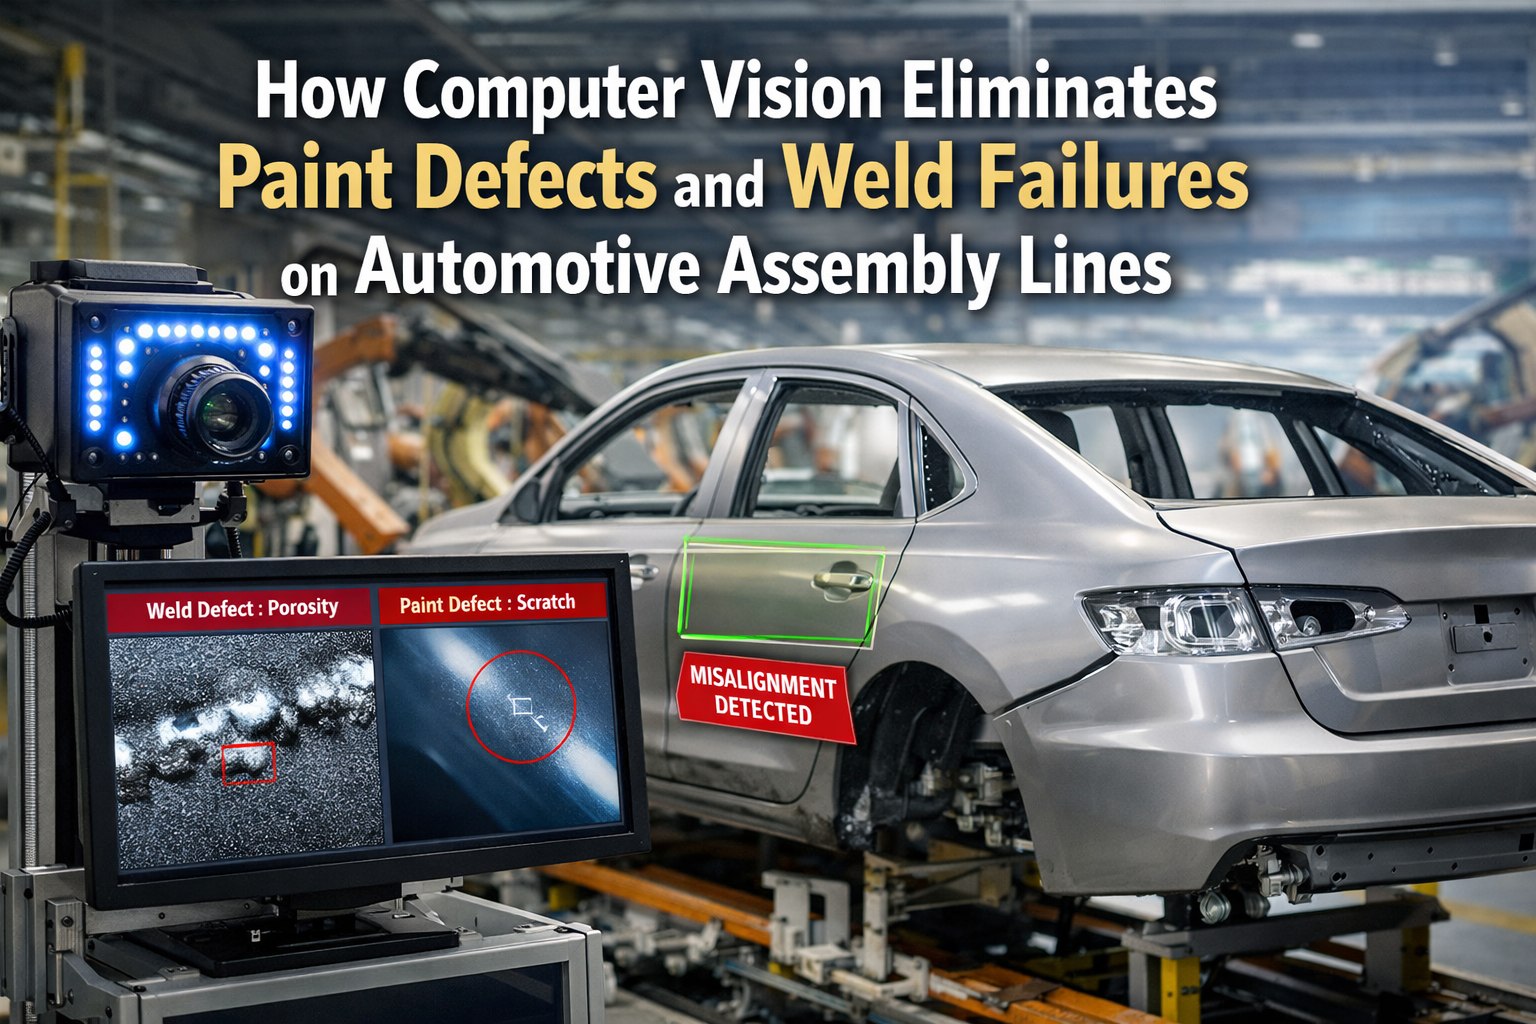
A high-volume automotive paint shop lives on a knife-edge — one contaminated air handler, one shift's worth of fatigue, one badly maintained booth filter, and the defect escape rate walks past every quality gate and lands in warranty claims six months later. This is the story of a premium OEM paint shop that was living exactly that reality, catching roughly 78% of surface defects across three inspection tunnels on their best day, and watching paint-related warranty claims climb faster than the plant leadership could explain to corporate. What happened over the next six months — after AI vision cameras went live across all three tunnels — is a case study in what changes when every panel gets the same inspection at hour eight that it got at hour one. If your paint shop is running similar numbers, the fastest way to see the model against your own defect library is to book a demo.
CASE STUDY · AUTOMOTIVE PAINT SHOP
78% Detection Became 99.5% — And Warranty Claims Dropped 42% in Six Months
Three paint inspection tunnels. One AI vision deployment. A measured, month-by-month record of what changed for a premium OEM's quality organization.
Client Profile
Premium OEM
Volume passenger vehicle assembly plant
Production Volume
~850 bodies/shift
Three-shift operation, six days a week
Deployment Scope
3 Tunnels
E-coat, base/clear, and final finish inspection
Time to Full Result
6 Months
Phased rollout, tunnel-by-tunnel
A Paint Shop Doing Everything Right, Losing to Human Physiology
The plant was not badly run. Booth pressure was controlled to spec, filter changeouts were on schedule, primer and topcoat viscosity checks were logged every hour, and the inspection tunnel lighting had been rebuilt to industry-standard color temperature two years earlier. The problem was not the shop — the problem was that eight-hour shifts of continuous visual inspection produce a defect detection curve that no amount of process discipline can flatten.
Human Inspection Accuracy — Same Inspector, Same Defect Types, Across One Shift
The economics behind those percentage points were compounding. Around 5 to 15 percent of vehicles in a typical paint shop already require some level of rework, and every defect missed at the booth exit costs an order of magnitude more when it surfaces at final assembly, and another order of magnitude when it surfaces at the customer. Warranty claims tied to paint quality had been climbing quarter over quarter, and internal audits were flagging paint defect escape as the single largest contributor.
Five Constraints That Made This Not a Simple Camera Problem
The plant had already looked at inspection upgrades twice before — and both evaluations had stalled. Any solution that was going to survive the third round needed to clear five specific constraints that had killed the previous attempts.
C-01
Line Speed Cannot Slow Down
Paint shop takt time was fixed by the assembly line downstream. Any inspection system that could not keep up at the current 60–75 second cycle was disqualified before evaluation — the plant could not trade throughput for detection.
C-02
Data Cannot Leave the Firewall
Paint formulations, color matching tolerances, and defect taxonomies were trade-secret IP. Any cloud-bound imagery was a non-starter — the system had to run entirely on-premise, with inference happening at the edge inside the firewall.
C-03
Zero Production Disruption
The line runs three shifts, six days a week. Installation, calibration, and validation had to happen in scheduled maintenance windows without touching a single scheduled production hour — the plant could not accept a "we're down for two weeks" rollout.
C-04
False Rejects Kill Adoption
Manual inspection was already generating 15–22% false reject rates on marginal defects. Any AI system that pushed that number higher would be turned off by operators inside a week — the model needed a lower false-positive rate than the humans it was augmenting.
C-05
Existing Camera Infrastructure Should Stay
The tunnels had recently-installed machine vision cameras from a previous quality initiative. Ripping and replacing that hardware was politically dead — the vision layer needed to work with what was already mounted, adding sensors only where genuine coverage gaps existed.
What Actually Got Deployed Across the Three Tunnels
The rollout was architected as a shadow-mode-first, tunnel-by-tunnel deployment — the model ran alongside the existing inspection workflow for weeks before any pass/fail authority was handed to it. That approach let the model learn the plant's specific paint chemistry, panel geometry, and lighting artifacts before it was allowed to influence a single production decision.
TUNNEL 01
E-Coat Inspection
Post-electrocoat surface inspection catches contamination and coverage anomalies before primer application, when defects are cheapest to correct. The model was trained on runs, sags, holidays, and dirt inclusions specific to the plant's e-coat chemistry — with the healthy-baseline reference built from 30 days of clean-panel imagery.
RunsSagsHolidaysDirt Inclusion
TUNNEL 02
Base Coat / Clear Coat
Post-topcoat inspection is where the highest-consequence defects appear — orange peel, craters, fisheyes, contamination inclusions, and color-shift anomalies. Multi-angle imaging under multiple light temperatures was added to expose defects that vanish under fixed booth lighting, and the model classifies each finding by defect type and severity in under 300 milliseconds.
Orange PeelCratersFisheyesColor Shift
TUNNEL 03
Final Finish Inspection
Pre-assembly final finish inspection catches everything the first two tunnels let through, plus any handling damage between paint and body drop. The model was trained to distinguish cosmetic defects requiring rework from acceptable surface texture variations within OEM appearance specifications — the fine line where false rejects used to accumulate.
Micro-ScratchesHandling DamageNibsPolish Marks
SEE THE MODEL RUN ON YOUR DEFECT LIBRARY
The Demo Uses Your Real Images — Not a Sanitized Reel
Bring your last two months of paint reject photos, and see the classifier work through them live. Most quality teams learn more from one honest demo than from a stack of case studies.
Six Months of Deployment — What Happened, Month by Month
The rollout followed a phased sequence designed to prove the model on the lowest-risk tunnel first, then expand once the plant's quality organization had watched real detection data for enough time to trust it. Here is what actually landed in each month.
MONTH 1
Shadow Mode on Tunnel 01
E-coat tunnel goes live in shadow mode. Model runs alongside human inspectors with no pass/fail authority. Detections are logged, compared against inspector decisions, and every disagreement is triaged by the quality engineering team to refine the model's threshold on plant-specific edge cases.
Model precision on flagged defects reached 94% by end of month
MONTH 2
Tunnel 01 Live · Tunnel 02 Shadow
E-coat tunnel handed pass/fail authority on a defined defect subset. Base/clear tunnel enters shadow mode, with multi-angle imaging hardware installed during the weekend maintenance window. First measurable warranty-adjacent metric moves: minor defect escape from Tunnel 01 drops sharply.
Tunnel 01 catch rate climbs from 76% to 98.2%
MONTH 3
Tunnel 02 Live · Tunnel 03 Shadow
Base/clear coat tunnel handed authority. The high-value defect categories — orange peel, craters, fisheyes — start getting caught continuously, not just when the day-shift inspector happens to be alert. Final finish tunnel enters shadow mode with existing cameras reused where resolution and frame rate cleared minimum thresholds.
Tunnel 02 catch rate hits 99.1% on trained defect classes
MONTH 4
All Three Tunnels Live
Final finish tunnel handed authority. All three tunnels now running in production mode with human inspectors shifting from primary detection to secondary confirmation on borderline flags. Downstream body drop begins to see cleaner units, and the assembly line rework rate for paint-related issues starts trending down.
Plant-wide paint defect escape rate drops 71% versus baseline
MONTH 5
Model Refinement and False-Reject Optimization
Focus shifts from detection rate to false-reject rate. The model is refined against a curated library of "acceptable variation" imagery — orange peel within OEM spec, minor color-batch variation within tolerance — so it stops routing marginal-but-acceptable bodies to rework. False reject rate falls below manual baseline for the first time.
False reject rate settles at 2.3%, versus 15–22% under manual inspection
MONTH 6
Steady State and First Warranty Impact
The first cohort of vehicles inspected under full AI-vision authority reaches the six-month post-sale mark. Paint-related warranty claim rate for those cohorts is measured against the equivalent cohort from twelve months earlier — the number the plant leadership had been waiting to see.
Paint-related warranty claims down 42% versus prior-year cohort
Before vs After — the Numbers the Plant Reported
The metrics below are the ones the quality organization used to close out the deployment project internally. They are deliberately the same categories the plant had been tracking before AI vision went in — because a case study only means something if it moves the numbers the client was already measuring.
BEFORE — MANUAL INSPECTION
78%
Defect Detection Rate
Sampled
23% of bodies received full inspection at critical gates
Baseline
Paint-related warranty claim rate
Manual
Defect logging and CAPA generation
AFTER — AI VISION AUTHORITY
99.5%
Defect Detection Rate
100%
Of bodies inspected at all three tunnels, every shift
−42%
Paint-related warranty claims versus prior year
Auto
Defect record, image, and CAPA draft generated per body
What Improved That Wasn't in the Original Business Case
The measured detection and warranty numbers were the reason the project was funded. The four wins below were not in the original business case — they emerged as second-order effects once the plant had a continuous, structured, image-attached defect record for every single body running through paint.
A
Root-Cause Analysis Got Actually Data-Driven
When a spike in fisheyes appeared over a two-hour window, the quality team could pull every affected body's image, cross-reference paint batch and booth conditions in that window, and identify a contaminated fresh-air intake filter within a shift — instead of the multi-day investigation it used to take.
B
Rework Cell Routing Became Precise
Because every defect was classified by type and severity at detection, bodies could be routed directly to the correct rework cell — denib, polish, sand-and-clear, or full respray — with the defect image and panel coordinates pre-loaded into the work instruction. Rework cell utilization climbed and rework cycle time dropped.
C
Drift Detection Became Predictive
Trending minor defects turned out to predict major defects. When the model started flagging a rising rate of marginal orange peel on a specific color code, the paint engineers had a two-shift heads-up before the same color line started producing rework-grade bodies — a preventable event caught before it happened.
D
Audit Documentation Wrote Itself
Every body now leaves paint with a timestamped, image-attached inspection record archived to VIN. Internal audits and customer quality audits that used to consume days of quality-engineer time now pull the requested records in minutes, and the completeness of the record makes the audit itself faster.
Field Perspective
A
Anil V.
Head of Quality Engineering, Passenger Vehicle Assembly Plant
We had been asking our inspectors to do something the human eye is genuinely not built for — catch a 0.3mm nib on a curved panel under fluorescent light on hour seven of a shift. The AI vision system does not replace the inspectors; it takes the impossible part of their job off their plate so they can focus on judgment calls the model is not qualified to make. The 42% warranty drop was the number leadership needed. The change in how our inspectors work day to day is what made the team believe in it.
Common Questions
Paint Shop AI Vision — Questions Quality Teams Ask Before Signing Off
Would we get similar results, or was this specific to this plant's setup?
The specific percentages will vary with your paint chemistry, your line speed, your baseline manual detection rate, and your defect mix — no honest vendor will promise a specific number without seeing your data. What is portable across paint shops is the underlying pattern: manual inspection accuracy degrades measurably across a shift, AI vision maintains a constant detection threshold, and the delta between those two shows up as reduced defect escape and lower warranty claim rates over six to twelve months. The most useful thing you can do to size the expected impact for your specific plant is to walk through your current rejection data and warranty numbers during a demo, so the discussion is grounded in your actual baseline rather than industry averages.
How long before we see measurable results in our own paint shop?
Shadow-mode detection metrics typically become meaningful within two to three weeks as the model sees enough of the plant's defect variety to reach usable accuracy, with full trained-class accuracy usually landing by week six. The metrics that leadership actually cares about — warranty claim rate, downstream rework rate, first-time-through paint yield — take three to six months to move visibly, because they are lagging indicators tied to how long vehicles sit in the field before defects become claims. The internal case for the deployment is usually built on the leading indicators, and the warranty numbers arrive later to confirm what the detection data already showed.
What happens on the shop floor if the AI vision system flags a defect incorrectly?
Every flagged defect goes through a defined workflow rather than an automatic reject — the flagged body is diverted to a review station where a quality engineer confirms the classification, and disagreements between the model and the engineer are logged into a retraining queue. This is exactly how the false-reject rate at this deployment fell from the manual baseline of 15–22% down to 2.3% over months 4 and 5: every disagreement was turned into a training example, and the model learned the plant's specific definition of "acceptable variation" versus "genuine defect." The workflow means an incorrectly flagged body costs a short review, not a wasted rework — and the operators trust the system faster because they can see it being corrected in real time.
Do we have to give up our existing camera hardware, or does this work with what we already own?
Existing machine vision cameras can typically be reused when their resolution and frame rate meet the minimum thresholds the model needs to detect the defect categories you care about, so the upgrade is often primarily a software and lighting change rather than a full hardware replacement. Where camera coverage has genuine gaps — usually specific defect angles that fixed booth lighting fails to expose — additional cameras or multi-angle imaging rigs are added only at those specific stations rather than across the whole tunnel. This is one of the constraints that made this deployment work, and it is the same approach recommended for any paint shop with recent-generation machine vision infrastructure. For a candid assessment of what your existing hardware can carry, a scheduled
demo is the fastest path.
Does this run on-premise, or does our paint data have to go to the cloud?
On-premise deployment is the default and, for automotive paint shops, effectively mandatory — paint formulations, color matching tolerances, and defect taxonomies are trade-secret IP, and cloud-bound imagery is a leak vector the OEM quality organization cannot accept. Inference runs at the edge, inside the plant firewall, with sub-100 millisecond decision latency that matches production takt time even at high line speeds. Model updates and refinements are pushed as signed packages the plant applies during scheduled maintenance windows, and no production imagery ever leaves the site. For details on the specific deployment architecture and how it integrates with your existing MES or quality systems, the implementation team can walk through it through
support.
78% → 99.5% · WARRANTY CLAIMS DOWN 42% · 6 MONTHS
Your Paint Shop Is Not the Problem. The Human Fatigue Curve Is.
iFactory brings the same detection threshold to every body at hour eight that your best inspector brings at hour one — and turns every finding into an image-attached record your quality team, your rework cells, and your audits all pull from the same source.