At 11:47 PM on a Tuesday in November, a packaging line at a mid-size food processor completed its first cereal-bar changeover of the shift. Line 3 began running a mixed-nut variant that required a specific allergen declaration — CONTAINS: PEANUTS, TREE NUTS, MILK. The operator had loaded a label roll from the previous product run, which was missing the MILK allergen. Fifteen thousand units were staged for shipment to seven distribution centres at 2:14 AM. The AI packaging inspection camera caught the mismatch on the first unit off the labeller. The line stopped in 4 seconds. The estimated cost of the recall that did not happen: $800,000 — more than the entire annual cost of the AI vision system, recovered in a single detection event. Every packaging line in this plant now runs the same architecture — book a demo to see it working on your line.
CASE STUDY · FOOD · PACKAGING INSPECTION
Food Processor Prevents $800K Recall with AI Packaging Inspection
One night. One label roll left over from the previous product run. Fifteen thousand mixed-nut cereal bars missing the MILK allergen declaration. AI vision caught it on the first unit — before a single case shipped. The system paid for itself in a single detection event.
15,000
Units caught
before shipment
$800K
Estimated recall cost
prevented that night
4 sec
From detection to
line stop
1 event
Single catch =
full system ROI
The Night It Almost Went Wrong
This is a real timeline of a single overnight shift at the processor. Times are from the plant’s MES log. The narrative demonstrates why label verification cannot be a downstream sampling task — the window between error and shipment on high-speed packaging lines is measured in hours, not days. Manual audits sample 1 unit in 200. AI vision inspects every one.
11:32 PM
Product Changeover Begins
Line 3 completes cinnamon-oat bar run. Cleaning cycle initiated. Next scheduled product: mixed-nut cereal bar with peanut, tree-nut, and milk allergens.
11:45 PM
Operator Loads Wrong Label Roll
Roll from previous product staged next to labeller. Operator loads it under changeover pressure. Label declares peanuts and tree nuts — but not milk.
11:47 PM
AI Vision Catches Mismatch on Unit #1
OCR reads label allergen line. Compares against production order allergen profile. MILK missing. Severity: CRITICAL. Line-stop signal fires to PLC in 4 seconds.
11:48 PM
Line 3 Stopped, Supervisor Alerted
SMS and MES alert routes to shift supervisor. Reject gate isolates the single mislabelled unit. Quality manager pulled from adjacent line for review.
12:32 AM
Correct Label Roll Loaded, Line Restarted
45-minute changeover recovery. Correct roll loaded, verified by AI against production order. Line runs at target speed within 8 minutes of restart.
2:14 AM
Original Shipment Window — No Mislabelled Units on Trucks
The 15,000 units originally staged with the wrong label were never produced. Without AI vision, they would have shipped to 7 regional distribution centres at this timestamp.
What the Recall Would Have Cost
An $800,000 recall does not look like one line item. It looks like eight of them, stacked. This is the counterfactual: what the processor would have paid if the mislabelled units had shipped and a consumer complaint had triggered an FDA Class I recall for undeclared milk allergen — a scenario that plays out in U.S. food plants dozens of times per year.
RETRIEVAL & LOGISTICS
$180K
Recall notifications to 7 DCs, retailer pickup coordination, reverse logistics, temperature-controlled return transport.
DESTRUCTION & DISPOSAL
$95K
Certified destruction of 15,000 units plus additional inventory in trade. Third-party disposal witnessed by FDA.
REGULATORY RESPONSE
$120K
FDA reportable food registry filing, root cause investigation, CAPA documentation, legal review, on-site inspection preparation.
RETAILER & DC PENALTIES
$140K
Chargebacks from 3 major retailers, DC handling fees, restocking penalties, expedited replacement shipment costs.
LEGAL RESERVES
$85K
Outside counsel, potential claim reserves for consumer notifications, allergen-injury exposure evaluation.
LOST PRODUCTION
$110K
3-day line hold pending root cause resolution. Missed contractual delivery windows. Labour costs during hold.
BRAND IMPACT
$70K
Consumer communications, PR response, retailer confidence recovery. Underestimated for direct-cost model.
TOTAL COST AVOIDED IN ONE DETECTION EVENT
$800,000
Anatomy of the Detection
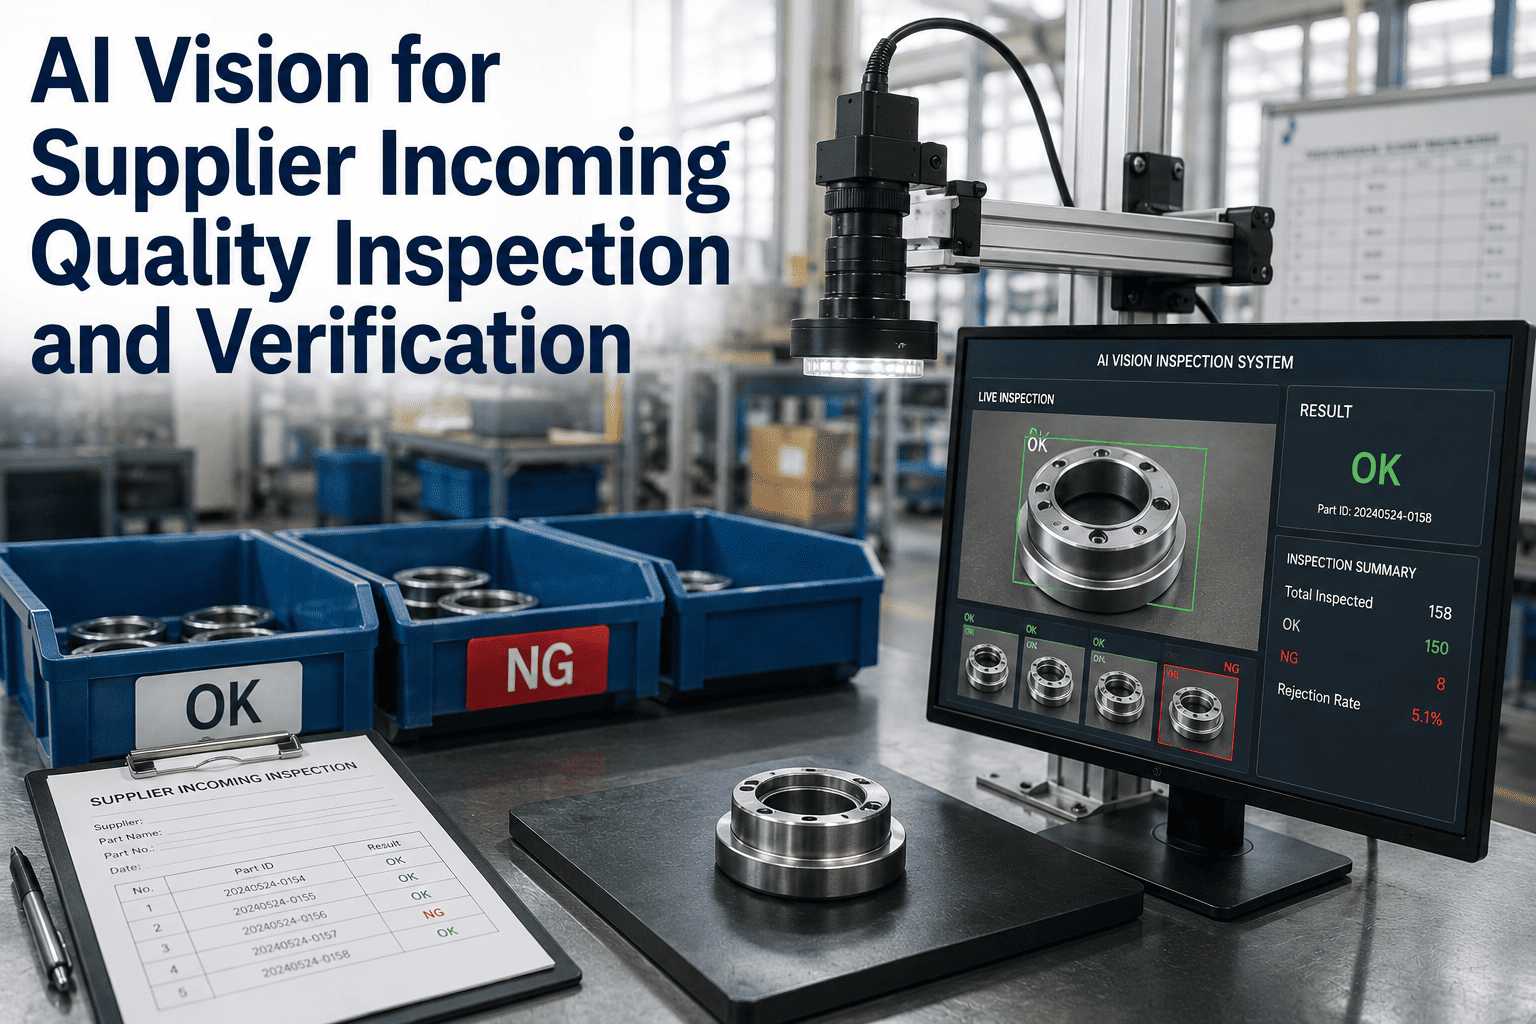
The catch was not luck. It was three deep-learning models running in sequence on every unit, in under 45 milliseconds. Here is exactly how the system read the label, compared it against the production order, and fired the line-stop signal before Unit #2 could be labelled.
STEP 1
Label Region & Text Extraction
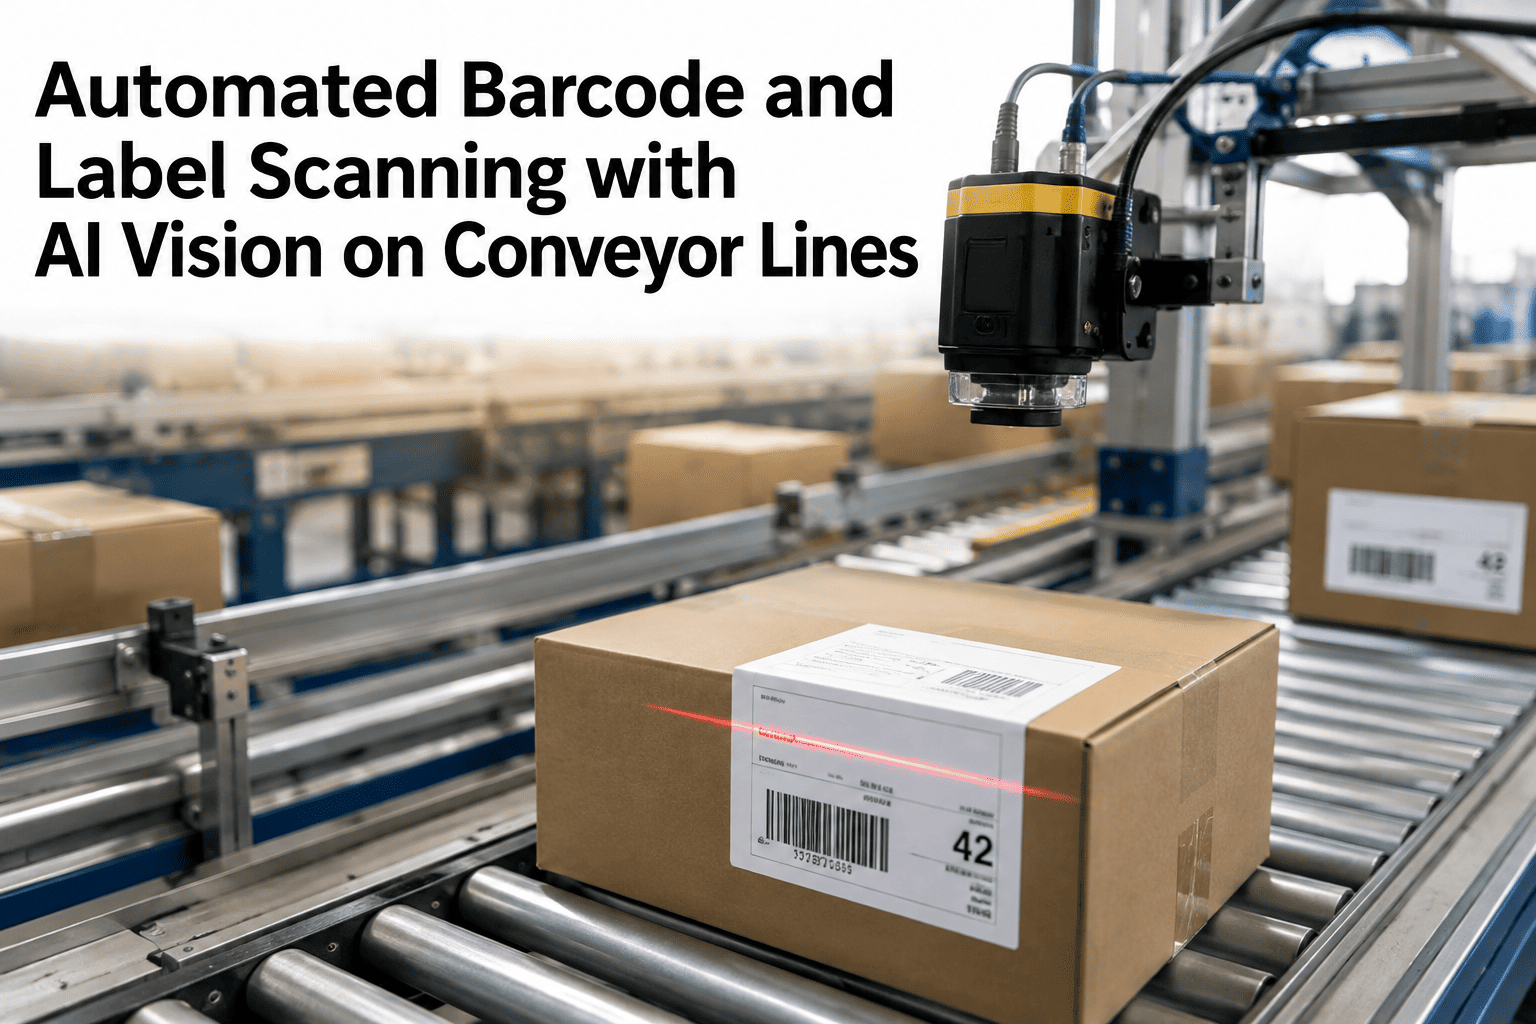
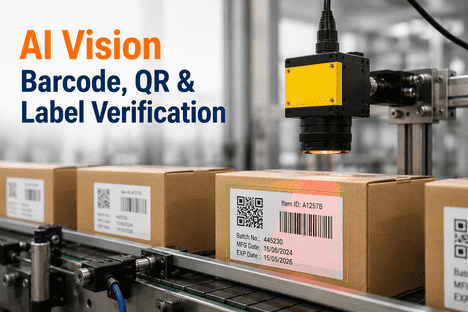
A high-resolution camera captures the front and back label at line speed (400 units/min). A segmentation model isolates the allergen declaration region, ingredient panel, nutrition facts, and barcode area. OCR extracts every character.
Latency18ms
Char accuracy99.7%
STEP 2
Production Order Match
The extracted allergen list is compared against the active production order pulled from MES. Order specifies: peanuts, tree nuts, milk. Label reads: peanuts, tree nuts. MILK is missing. Severity classifier flags as CRITICAL allergen mismatch.
Latency12ms
SeverityCRITICAL
STEP 3
PLC Line-Stop Signal
For CRITICAL severity, the system writes a line-stop tag to the PLC via OPC-UA. Reject gate isolates the failing unit. SMS + MES alert routes to shift supervisor with unit image, extracted text, and production order attached as evidence.
Latency15ms
Total elapsed45ms
Total elapsed from label appearing in camera field to line-stop signal committed at PLC: 45 milliseconds. The physical line takes an additional 3.9 seconds to decelerate to a stop, during which the labeller processes 26 more units — all of which land in the reject bin, not the shipment stack. This is the entire event.
See This Working on Your Packaging Line in 5 Days.
Send 200+ label images from your line, or ship product samples. iFactory engineers return an expected detection map for your SKU mix, allergen profile, and label templates — before you commit to a pilot.
12 Months Later: The Bigger Picture
The November catch was the biggest single event, but not the only one. Across 12 months of production, the AI packaging inspection system caught 4,127 defects that would have escaped manual sampling. Most were minor and self-corrected; some were significant. Here is the year’s data, broken down by defect category and estimated cost avoided.
4,127
Defect catches, 12 months
$2.6M
Total estimated cost avoided
17
Allergen & wrong-SKU near-misses
Five Verification Checks on Every Unit
The packaging inspection stack runs five simultaneous verification models on every unit, not just one. This is the difference between a smart camera at the labeller and a full packaging inspection platform — and it is why the system catches defects across the entire packaging chain, not only labels.
01
Label Content Verification
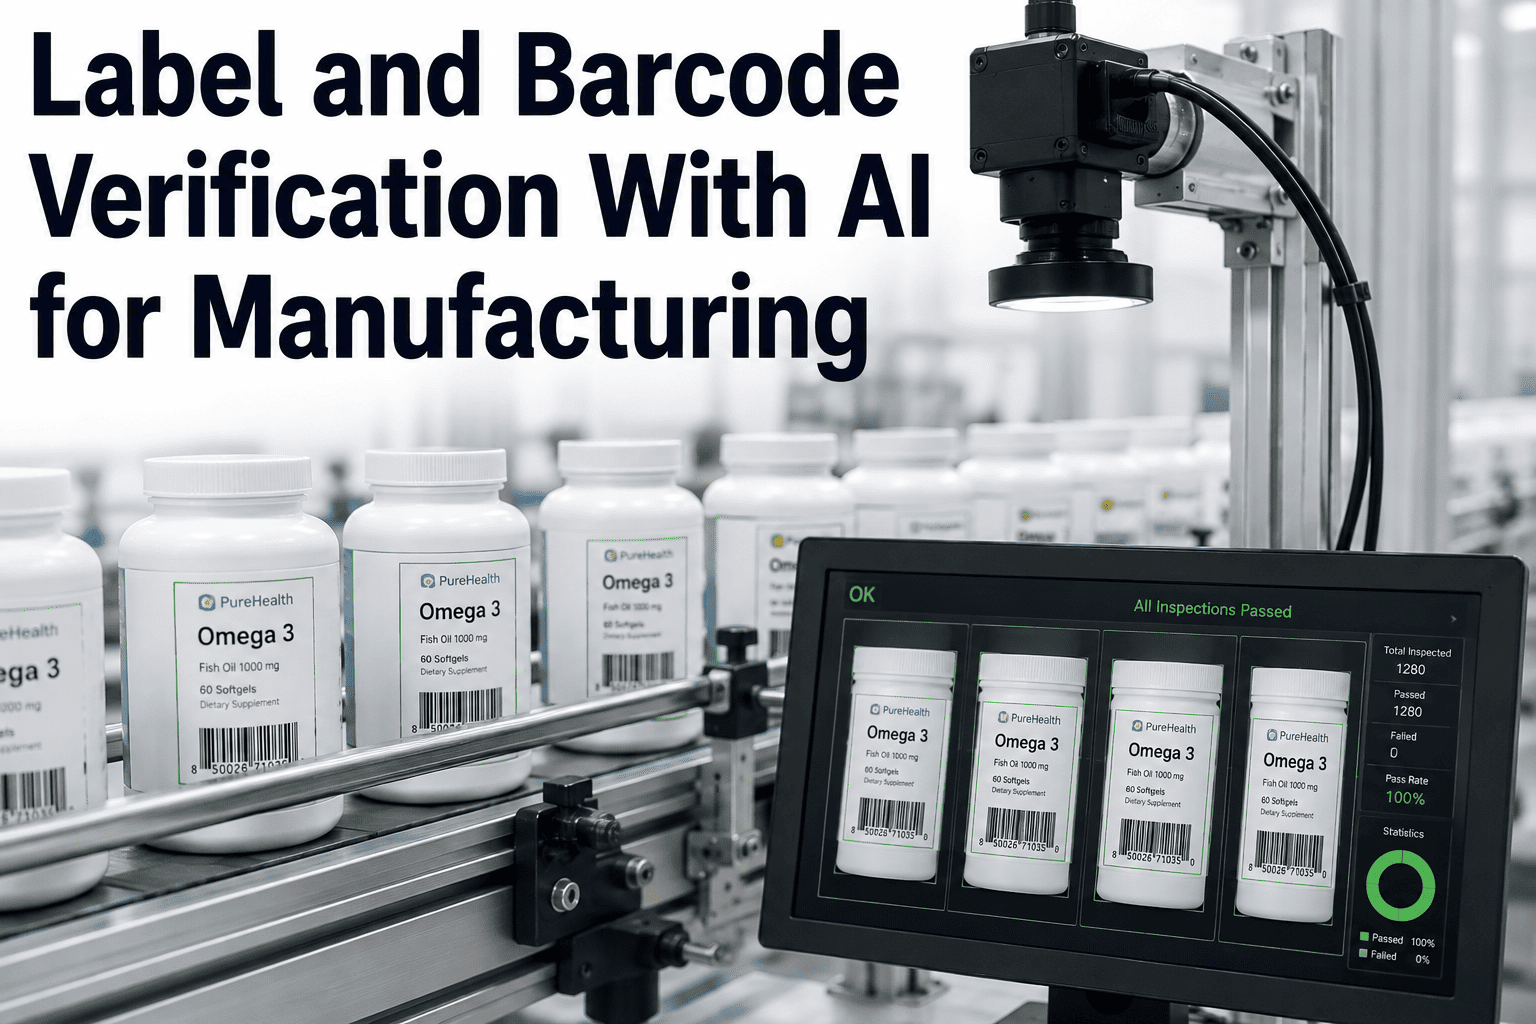
OCR reads every character. Compares product name, ingredients, allergens, nutrition facts, net weight, and lot code against the active production order pulled from MES.
Wrong SKU · Wrong artwork version · Missing allergens · Ingredient mismatch
02
Barcode & Date Code Grading
GS1 barcode grade check (must be C or better). Date code OCR verifies best-by against production date + shelf-life offset. Flags smearing, ghost printing, and off-position codes.
Unscannable barcodes · Wrong dates · Ghost print · Off-position codes
03
Label Placement & Integrity
Segmentation model checks skew angle, wrinkles, peeling edges, air bubbles, and coverage. Rejects units where label defects would render the unit unshippable or fail retailer receiving inspection.
Skew > 5° · Wrinkles · Peeling edges · Air bubbles
04
Seal & Closure Verification
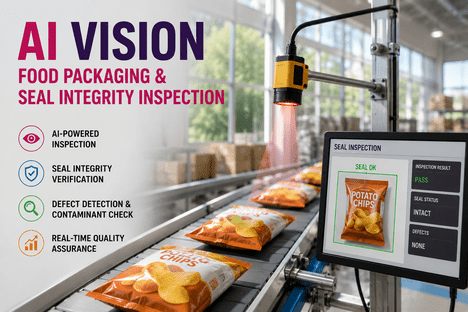
Thermal imaging model reads heat-seal integrity. Detects incomplete seals, unsealed edges, tamper-band presence, and shrink-wrap defects. Critical for MAP and modified-atmosphere packaging.
Incomplete seals · Missing tamper bands · Unsealed edges · Broken wraps
05
Fill Level & Foreign Body
X-ray and vision fusion checks fill level against target weight and detects foreign objects (metal, glass, dense plastic). Flags under-fill, over-fill, and any contamination that survived upstream metal detection.
Under-fill · Over-fill · Foreign objects · Missed metal detection
Compliance, Audit Trail, and Traceability
Every unit inspected. Every inspection image archived. Every decision timestamped and linked to the production order, lot code, operator ID, and shift log. When an FDA auditor asks what a specific unit looked like at 11:47 PM on that Tuesday in November, the plant can produce the image, the OCR reading, and the pass/fail decision in under 30 seconds.
FSMA 204
Traceability Records
Every inspection event links to lot code, ingredient batch, shift, and operator. Records retained for the FDA-required window. Exports on demand for recall traceback.
HACCP
Critical Control Point
Label verification is documented as a CCP in the plant’s HACCP plan. AI inspection records satisfy monitoring, verification, and record-keeping requirements without paper logs.
SQF / BRC
Audit-Ready Evidence
Full image archive for every unit shipped, searchable by SKU, date, shift, or lot. Auditors can validate any historical unit’s label content without a physical sample.
GFSI
Continuous Monitoring
100% inspection replaces sampling-based verification. Reduces audit finding risk during unannounced third-party inspections. No gaps between audit windows.
Frequently Asked Questions
The questions this processor’s quality director and plant manager asked before deploying AI packaging inspection — the same ones most food manufacturers evaluate when the recall exposure conversation reaches the C-suite.
Does the system work with existing packaging machinery, or does the plant need new labellers and sealers?
The system integrates with existing packaging machinery via standard vision-station mounting after the labeller, sealer, or coder. No replacement of production equipment is required. iFactory adds cameras, lighting, and a small on-prem inference server; PLC integration uses the labeller’s existing OPC-UA or discrete I/O. This mid-size processor kept its existing labellers on all six lines and retrofitted vision stations during scheduled changeover windows. Contact
iFactory support for a compatibility check on your specific packaging equipment.
How does the system handle SKU changeovers with different label templates?
Every label template is registered in the system as a golden reference tied to a SKU code. When the production order changes, the system automatically loads the correct template pulled from MES. No manual reconfiguration on the line. The processor runs 47 SKUs across 6 lines with dozens of daily changeovers — the system has never held up a changeover, and adding a new SKU takes 20 minutes of template registration plus 200 golden-sample images.
What is the false reject rate, and how much good product gets scrapped?
The 12-month false reject rate ran at 0.8%, compared to the plant’s manual inspection false reject rate of 4.2% under sampling protocols. Because AI decisions route borderline units to a rework lane rather than direct scrap, most false rejects are recovered by operator review. Net product loss to false rejection dropped from 0.19% of production under manual audit to 0.03% under AI — a reduction that on its own paid for a meaningful share of the system cost.
Can the system read labels through condensation, printing variation, or reflective packaging?
Yes. This is where trained deep-learning models substantially outperform traditional OCR. The models learn the distribution of acceptable label appearances across condensation, printer variation, packaging reflectivity, and lighting drift. On this plant’s reflective foil bar wrappers, character accuracy runs at 99.7% versus 89% on the same units using traditional rule-based OCR. For reflective or challenging substrates, the vision engineers validate legibility during the pilot phase before committing to detection accuracy targets.
What happens to the image archive over time — how much storage does it consume?
All inspection images are compressed and stored on-prem. Retention windows are configurable per SKU category based on shelf life and regulatory requirement. Typical setup: full-resolution images retained for 2 years for shelf-stable products, thumbnails for an additional 3 years. This processor runs about 4.2 TB of image data per year across all six lines — well within the on-prem storage budget planned during deployment. For a specific storage sizing on your production volume,
book a call with the iFactory deployment team.
ONE DETECTION EVENT COVERS THE SYSTEM COST
Send Your Labels. Get a Detection Read in 5 Days.
Ship product samples from your highest-risk SKUs or share 200+ label images per template from your existing inspection archive. iFactory engineers return expected detection rates on your SKU mix, allergen profile, and label templates — along with a 5-check inspection stack scoped for your specific packaging lines.
5 days
Feasibility turnaround
6–10 wk
Pilot to production
On-prem
Data stays in your plant
1 event
Typical payback trigger