Every plant running manual inspection has the same evidence on its side: the line ships, most customers accept the product, and the quality team flags problems every single week. That evidence feels conclusive right up until somebody measures the defects nobody caught, the accuracy gap between hour one and hour seven of a shift, and the cost of re-training every inspector who resigns. Justifying AI vision is rarely about proving manual inspection has failed, it is about proving that the word working is being measured against the wrong baseline. Those numbers already sit in your warranty records, scrap tickets, and shift logs, and pulling them into one defensible view is where a credible business case actually begins, which is exactly the conversation our engineering team has with quality leaders every week.
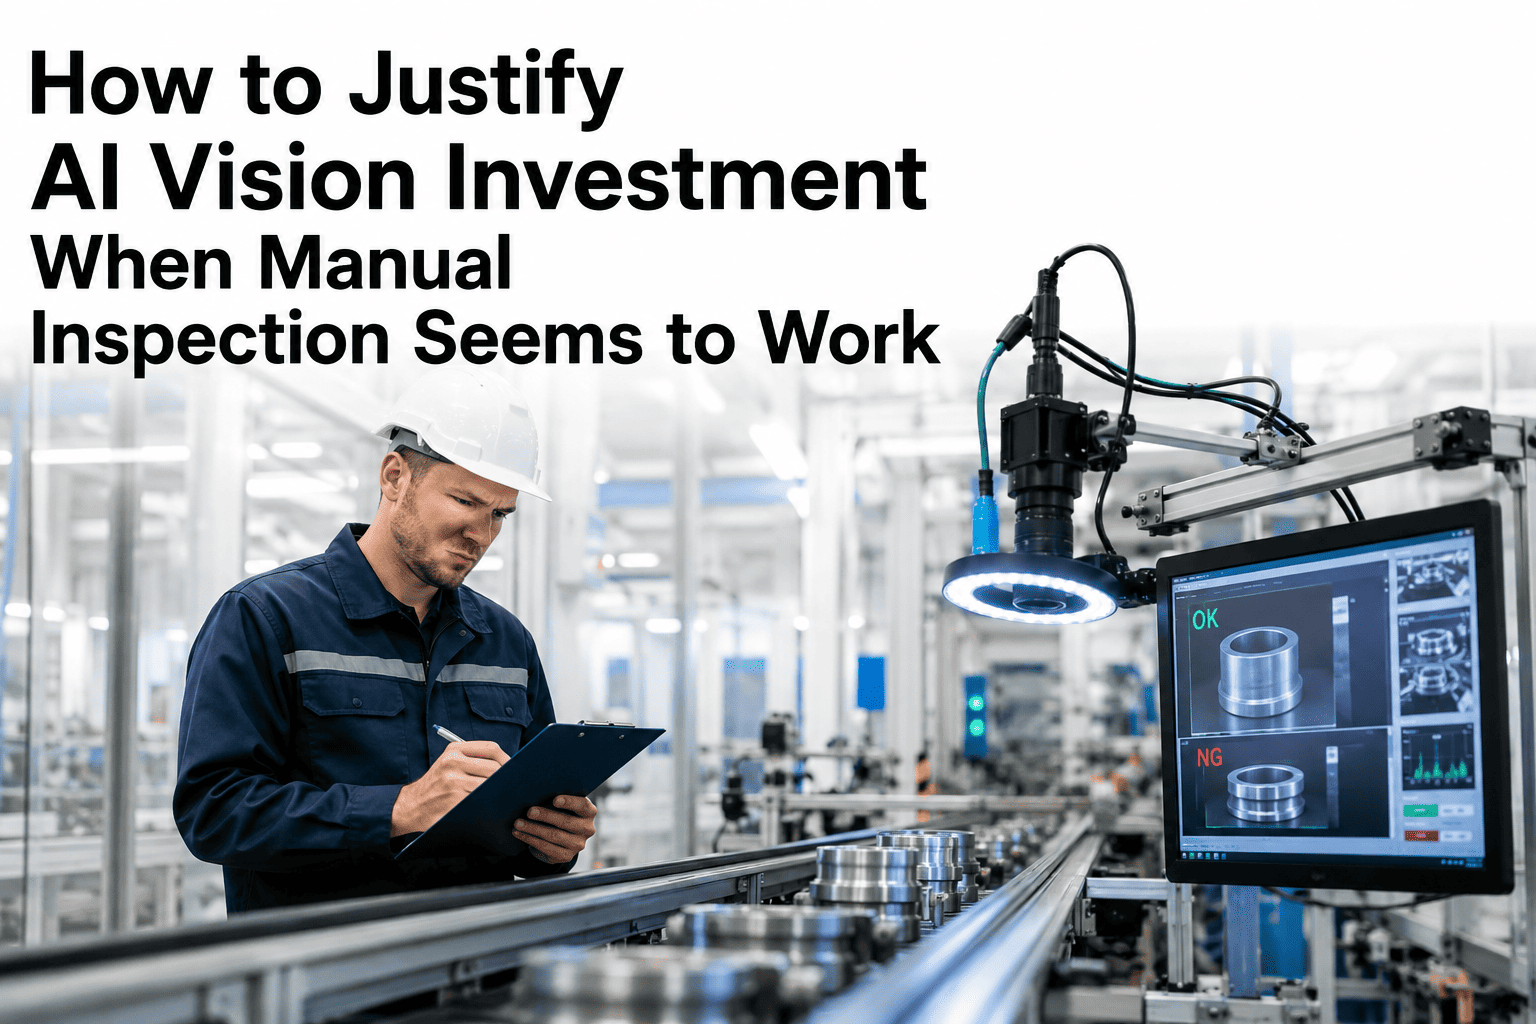
How to Justify AI Vision Investment When Manual Inspection Seems to Work
Manual inspection looks adequate because you only ever see what it catches. Quantify escaped defects, shift variation, inspector fatigue, training churn, and liability exposure, then take a business case to finance that survives scrutiny.
Why It Seems To Work Is the Hardest Objection in the Room
The objection is not irrational. It is a measurement artifact. Manual inspection produces a highly visible stream of evidence that it is doing its job: rejected parts stacked in a red bin, a defect log filling up every shift, inspectors visibly working. What it does not produce is any evidence of what it missed. There is no bin for escaped defects, no log entry for the part that passed at 3:40 in the afternoon when it should not have. The failures of manual inspection are structurally invisible at the point of inspection and only surface weeks later, in a different department, coded as a warranty claim, a customer complaint, or a supplier corrective action request that nobody traces back to the inspection station.
This asymmetry is why quality managers can honestly believe the system is performing while the finance team quietly absorbs the cost of its failures under an entirely different budget line. The entire task of building an AI vision business case is closing that loop, connecting the downstream costs back to the upstream detection gap that created them. Until that connection is made explicit and quantified, any proposal will be read as a solution looking for a problem.
What Everyone Sees
- Parts rejected at the station, counted daily
- A defect log that fills up every shift
- Inspectors present, engaged, and busy
- Customer acceptance on most shipments
- Audit records showing inspection took place
- A quality budget that looks predictable
What Nobody Measures
- Defects that passed and shipped, uncounted
- Accuracy variance between day and night shift
- The same part judged differently by two inspectors
- Warranty claims never traced to a detection gap
- Weeks of ramp time for every replacement hire
- Throughput capped by inspection cycle time
The Hidden Cost Ledger of Manual Inspection
Before you cost an AI vision system, cost the system you already run. Most plants dramatically understate manual inspection spend because they count only inspector wages and treat everything else as unrelated operating expense. A complete ledger typically includes eight distinct cost streams, and in most facilities the visible wage line is not even the largest of them. The relative weight below reflects a common pattern across mid-volume discrete manufacturing, though the exact proportions shift heavily by industry and by how much of your product carries field liability.
Warranty claims, field replacements, return logistics, customer penalties, and the corrective action administration that follows each event. This is external failure cost, the most expensive category in the classic prevention-appraisal-failure model, and it is almost never allocated back to the inspection function that let the defect through.
Every reworked unit consumes labor twice and then requires a second inspection pass that consumes inspection capacity a third time. Because rework is usually booked to production rather than quality, the compounding effect stays invisible in quality reporting even as it eats shift capacity.
Fully loaded inspection cost commonly lands between thirty eight and fifty two thousand dollars per head, and a station covered across three shifts multiplies that immediately. This is the number everyone quotes, and it consistently understates total inspection cost by a wide margin.
A defect caught at end of line has already absorbed every operation, every component, and every minute of machine time in the value stream. Manual end-of-line inspection structurally guarantees late detection, which converts a low-cost material rejection into a high-cost finished goods write-off.
Repetitive visual inspection carries high turnover, and every replacement means weeks of supervised ramp during which detection performance sits below the already-limited baseline. The institutional knowledge of what a marginal defect looks like on your specific product walks out the door with each resignation.
A human inspector performing meaningful examination handles a few hundred parts per hour. When line speed exceeds that, either inspection becomes sampling or the line slows to match the inspector. Both outcomes carry a cost that never appears as an expense entry anywhere.
Manual inspection leaves no image record, so proving what was inspected and what it looked like depends on paperwork reconstructed after the fact. Engineering and quality hours consumed assembling evidence for customer audits and regulatory reviews are real cost with zero production value.
Price concessions after a quality event, removal from a preferred supplier list, or a program awarded elsewhere after a field failure. Finance teams often exclude these because they resist precise measurement, but a single lost program frequently exceeds the entire capital cost of the system under discussion.
The Detection Cascade: Where Defects Actually Go
The most persuasive single exhibit in an AI vision business case is a simple containment cascade. Research from Sandia National Laboratories established that even best-case human inspectors catch roughly eighty percent of defects, and real production conditions routinely push that lower. Running the same inspection twice raises containment but does not close the gap, and it doubles the labor cost to get there. The cascade below traces one thousand true defects through each inspection strategy and shows exactly how many reach a customer under each one.
The commercial argument lives entirely in the right-hand column. If your average escaped defect costs even a hundred dollars once handling, replacement, and administration are counted, the gap between two hundred escapes and ten escapes on every thousand defects is the whole business case, before a single dollar of labor saving is counted.
The Shift Curve Nobody Charts
Manual inspection performance is not a constant, it is a curve that resets every shift change. Detection accuracy degrades measurably within the first hour of repetitive visual work and continues falling through the shift, with night shifts performing consistently worse than day shifts on identical defect sets. This matters for the business case because it means your quality outcome depends on when a part happened to be built, which is not a quality system, it is a lottery with reasonable odds.
Relative detection performance across an eight hour inspection shift compared with a vision model holding constant accuracy. The shape of this curve is well documented across repetitive visual tasks, and it is the reason two identical parts built six hours apart can receive different quality verdicts from the same inspector.
Turning Invisible Cost Into Line Items Finance Accepts
Finance teams reject business cases built on industry averages because industry averages are not their plant. The strongest justification uses your own data, even when that data is imperfect. Every one of the cost streams below can be estimated from records you already hold, and an estimate with a documented method and a stated confidence range is far more persuasive than a vendor benchmark. Build the table below with your own figures before you build a single slide.
| Hidden Cost Stream | How to Measure It From Existing Records | Where the Data Already Lives | Common Annual Range, Single Line |
|---|---|---|---|
| Escaped defect cost | Warranty claims plus returns plus field service, divided by units shipped, applied to annual volume | Warranty system, RMA log, customer credit notes | 150k to 900k |
| Rework and re-inspection | Rework hours booked, multiplied by loaded labor rate, plus second-pass inspection time | Production time booking, ERP work order history | 60k to 300k |
| Inspection headcount | Heads per station multiplied by shifts, at fully loaded cost including benefits and overtime | Payroll, shift rosters, overtime reports | 115k to 300k |
| Late-detection scrap | Scrap value of units rejected after final operation, separated from early-stage scrap | Scrap tickets coded by operation number | 40k to 250k |
| Turnover and ramp | Inspection role departures per year, multiplied by recruitment cost plus supervised ramp weeks | HR turnover reporting, training records | 20k to 90k |
| Throughput constraint | Contribution margin lost on units not produced because line speed was matched to inspection rate | Line speed studies, capacity planning models | Highly variable |
| Audit and documentation | Engineering and quality hours logged against audit preparation and customer evidence requests | Time booking, audit action logs | 15k to 70k |
The ranges above are directional, drawn from published cost of poor quality benchmarks that consistently place total quality failure cost between fifteen and twenty percent of revenue for the average manufacturer, with world class operations holding it below five percent. The purpose of the table is not the numbers in the last column, it is the second and third columns, which tell you exactly where to go and what to pull. Most quality teams can complete this exercise in two weeks using data they already own.
See the Cost Model Built Against Your Own Numbers
Bring your defect rate, line volume, inspection headcount, and warranty exposure to a thirty minute working session. Our engineers build the full hidden-cost ledger and payback model live, using your figures rather than industry averages, so you leave with a business case you can actually present to finance.
Building the Business Case in Five Defensible Steps
A business case that survives a capital committee has a specific shape. It establishes a measured baseline, quantifies the gap, prices the intervention, models the return with conservative assumptions, and proposes a low-risk validation path before full commitment. Skipping any one of these is where most AI vision proposals stall, and the most common failure is jumping straight from technology capability to a purchase request without ever establishing what the current state actually costs.
Measure your real escape rate, do not estimate it
Run a controlled audit where a second team re-inspects a statistically meaningful sample of units that already passed your normal inspection. Whatever they find is your escape rate, measured rather than assumed. This single exercise reframes the entire conversation because it converts an abstract industry statistic into a specific, uncomfortable, local number that nobody in the room can dispute.
Price a single escaped defect end to end
Take twelve months of warranty claims, returns, field service dispatches, customer penalties, and the administrative hours consumed handling them, then divide by the number of quality escapes behind them. The resulting cost per escape is the multiplier that turns your measured escape rate into an annual figure. Most teams are surprised by how large this number becomes once administration and logistics are included alongside replacement cost.
Separate labor saving from quality saving
Present these as two independent value streams, because they carry different levels of certainty and different organisational sensitivities. Labor saving is highly predictable but politically difficult, and framing it as redeployment to higher-value work rather than headcount reduction usually reflects what actually happens. Quality saving is larger but carries wider confidence bands, so present it as a conservative range rather than a point estimate.
Model the return using pessimistic assumptions
If your case only works at ninety nine percent detection and thirty percent defect reduction, it is fragile. Build the model at the low end, assume a partial improvement, assume some false positives requiring human review in the first months, and assume no throughput benefit at all. A case that still clears the hurdle rate under those assumptions is a case that survives cross-examination and gets approved.
Propose one station, not a plant-wide programme
Approval friction scales with capital request size. A single station on your highest-defect line, running in parallel with existing inspectors for a defined validation period, converts a large speculative decision into a small measurable one. It also produces exactly the evidence needed to justify expansion, since the pilot generates a direct head-to-head comparison between the model and your current team on real production output.
The Five Objections You Will Face, and How to Answer Them
Every AI vision proposal meets the same set of challenges, and preparing specific responses in advance is the difference between a deferred decision and an approved one. These objections are legitimate, not obstructive, and answering them dismissively is the fastest way to lose credibility with a capital committee. Each response below works because it concedes what is true in the objection before addressing what is incomplete about it.
Our defect rate is already low and customers are not complaining.
A low recorded defect rate measures what inspection found, not what existed. Run the parallel re-inspection audit and compare the two numbers. If the audit confirms the low rate, you have validated your process at minimal cost. If it does not, you have found the gap, and the absence of complaints simply means escapes are being absorbed quietly by customers who are keeping score.
Our defects are subtle and require human judgement.
Some genuinely do, and those tasks should stay with your inspectors. The relevant question is what proportion of total inspection time is spent on unambiguous, high-repetition checks that a model handles reliably. In most plants that proportion is the large majority, and automating it frees experienced inspectors to concentrate on the judgement calls where their expertise actually creates value.
We tried machine vision before and it produced too many false alarms.
Rule-based machine vision from a decade ago required every acceptable variation to be programmed explicitly, which made it brittle against normal process drift. Deep learning models learn the boundary from labelled examples of conforming and non-conforming units instead. The evaluation criterion should be measured precision and recall on a held-out set of your own parts, reported before any live deployment decision.
We change products too frequently for a fixed vision system.
High-mix operations do take longer to reach full payback, typically landing in the twelve to twenty four month band rather than the six to nine month band. They also frequently deliver larger absolute savings because the parts carry higher value and changeover-related defects are more expensive. Model retraining on a new variant is a data exercise measured in days, not a re-engineering project.
The capital is better spent on production capacity.
Capacity investment increases output of a process that currently ships a measurable percentage of defective units, which scales the escape cost proportionally. Inspection capability is the constraint that determines whether additional capacity converts into revenue or into warranty exposure. In lines where inspection paces the line, vision investment also releases throughput directly, competing with capacity spend on its own terms.
What the Payback Arithmetic Actually Looks Like
The calculation is not complex, and its simplicity is an asset when presenting to a non-technical audience. Deployment cost per inspection station commonly falls between thirty and eighty thousand dollars for a straightforward application, rising toward two hundred thousand for complex multi-angle or high-resolution requirements. Against that, four value streams accumulate, and in most credible models the quality streams dominate the labor stream by a wide margin.
Reduced Escape Cost
The largest and most defensible stream. A twenty five to thirty five percent reduction in escaped defect cost against a typical addressable quality cost base produces the bulk of the annual return in almost every model. This is where the argument is won or lost, so it deserves the most rigorous supporting data.
Redeployed Inspection Labor
Removing or redeploying dedicated inspection headcount across multiple shifts commonly recovers well over a hundred thousand dollars annually per station. Present this as capacity released for root cause work, supplier development, and process improvement rather than as a headcount reduction target.
Earlier Detection, Less Scrap
Moving inspection upstream stops defective work in progress from absorbing further operations. Fifteen to twenty percent scrap cost reduction is a commonly reported outcome, and the effect is strongest in processes with many operations downstream of the inspection point.
Throughput and Audit Value
Removing the inspection bottleneck releases line speed where inspection currently sets the pace, and automatic image retention eliminates most manual audit evidence assembly. Both are real, both are frequently excluded from conservative models, and both strengthen the case when they are included.
Put together, the documented pattern across validated deployments places average payback in the region of seven to eight months, with high-volume lines carrying clear, visible defect types landing at the fast end of four to eight months and complex high-mix operations extending to twelve to twenty four months. Three-year return figures in the region of three hundred percent and above are consistently reported, which places AI vision among the stronger capital returns available on a plant floor. Where a specific plant lands inside those bands depends on four inputs: defect visibility, production volume, current manual detection accuracy, and how many stations you cover. Working those four inputs against your actual figures with an engineering specialist takes under an hour and removes the guesswork entirely.
Designing a Pilot That Settles the Argument
The strongest justification is not a projection, it is a result. A well-designed pilot converts the entire debate into a measurement exercise, and it does so at a fraction of the capital cost of a full programme. The essential design principle is parallel operation: the model runs alongside your existing inspectors without authority to pass or fail anything, and the two sets of verdicts are compared at the end of the period. Nobody has to trust the technology in advance, because the pilot generates the evidence directly.
Capture and Define
Install cameras and lighting at the selected station and begin capturing production imagery. Lighting configuration accounts for a large share of eventual accuracy, so this stage deserves proper attention rather than being rushed. In parallel, agree the defect taxonomy with the quality team so that model classes match how your plant actually categorises and reports defects.
Train and Validate
Label conforming and non-conforming examples, typically requiring several hundred to a couple of thousand images per defect class depending on how visually distinct the defect is. The model is then validated against a held-out test set, with accuracy, precision, recall, and false positive rate reported explicitly before any decision to proceed to live parallel running.
Run Parallel and Compare
Operate the model in shadow mode with no authority over disposition. Every disagreement between model and inspector is adjudicated by a senior quality engineer, which produces a clean head-to-head record. This period also reveals the shift-to-shift variance in your own team, often the single most persuasive finding of the entire exercise.
Report and Decide
Present measured containment improvement, false positive rate, and adjudicated disagreement analysis against the cost model built at the start. At this point the capital request is no longer a projection, it is an extrapolation from your own measured results on your own line, which is a materially easier proposition to approve.
Where Manual Inspection Still Earns Its Place
A business case that claims total replacement of human inspection is less credible than one that does not, and experienced quality leaders will notice immediately. Being explicit about where cameras do not win strengthens every other claim in the proposal. There are real categories of inspection work where a trained inspector remains the better answer, and acknowledging them signals that the analysis was honest rather than promotional.
Novel and Unspecified Defects
A model detects what it has been trained to detect. An inspector encountering something genuinely new, a failure mode nobody anticipated, will flag it as wrong even without a category for it. Retaining human oversight in the loop preserves that capability, which matters most during process changes and new product introduction.
Very Low Volume, Very High Mix
Where a variant runs a handful of times a year, the labelled data required to train a reliable model may never accumulate. These applications are better served by keeping skilled manual inspection and concentrating vision investment on the high-repetition lines where the return is unambiguous.
Multi-Sensory Assessment
Checks that combine visual appearance with sound, feel, smell, or mechanical resistance are not purely visual problems. Vision handles the visual component well, but the complete assessment still requires the operator, and the honest framing is augmentation rather than replacement.
Root Cause Investigation
Vision reports what happened with far better data than manual inspection ever produced, but interpreting a defect pattern and tracing it to a tooling, material, or process cause remains engineering work. The value of automation here is giving those engineers a complete image dataset instead of a partial handwritten log.
Metrics That Prove the Investment After Go-Live
Approval is not the end of the justification, it is the beginning of it. Capital committees remember the projections in the approval paper, and the fastest way to make the next automation request easier is to report against those projections honestly. Track containment improvement measured by the same audit method used to establish the baseline, false positive rate over time, escaped defect cost trend on a rolling twelve month basis, inspection labor hours redeployed, and scrap cost split by detection point. Reporting these five monthly for the first year converts one approved project into an established internal track record.
The plants that scale automation successfully are rarely the ones with the most sophisticated first deployment. They are the ones that measured the before state carefully enough that the after state was undeniable. That discipline is what turns a single station into a plant-wide quality programme, and it starts with the unglamorous work of counting what manual inspection currently costs you.
Frequently Asked Questions
How do I prove our current inspection is missing defects when nothing is being reported?
Run a controlled parallel audit. Take a statistically meaningful sample of units that have already passed normal inspection and have a second, independent team re-inspect them under unhurried conditions with good lighting. Whatever that team finds represents defects your production inspection allowed through. Published research consistently shows that even best-case human inspectors catch around eighty percent of defects, and real floor conditions push that figure lower, so most plants running this audit for the first time find more than they expected. The result gives you a measured local escape rate rather than an industry statistic, which is far harder for anyone to argue against. Our team can help you structure that audit so the sample size and method stand up to scrutiny.
What does a single AI vision inspection station actually cost to deploy?
Deployment cost per station commonly falls between thirty and eighty thousand dollars for a straightforward application, covering industrial cameras, structured lighting, edge compute, integration, and model development. Complex requirements involving multiple angles, very high resolution, or difficult surface finishes push toward the upper end and occasionally beyond. Facilities with existing industrial cameras that support standard streaming protocols can often integrate at the software layer, which removes a significant portion of the hardware cost entirely. The most reliable way to get a real figure rather than a range is to walk one specific line and defect profile through the specification with an engineer, which is exactly what a thirty minute demo session covers.
How long before the investment pays for itself?
Documented deployments cluster around a seven to eight month average payback, but that average hides meaningful variation. High-volume lines with clear, visually distinct defect types frequently reach payback in four to eight months because the escape reduction applies to a large unit count immediately. Complex, high-mix, low-volume operations typically extend into the twelve to twenty four month range, though they often deliver larger absolute savings because the individual parts carry higher value and higher field liability. The four variables that determine where you land are production volume, defect visibility, current manual detection accuracy, and the number of stations covered.
Will we have to reduce headcount to make the numbers work?
In most credible models, no. Labor saving is usually the smaller of the value streams, with reduced escape cost and scrap reduction contributing considerably more to the annual return. Many plants redeploy inspectors into root cause analysis, supplier quality, process auditing, and the adjudication of model uncertainty rather than removing the roles. That framing also tends to produce better outcomes operationally, because experienced inspectors carry product knowledge that becomes more valuable once they are freed from repetitive checking. If your case only clears the hurdle rate through headcount reduction, the underlying quality cost analysis is probably incomplete and worth revisiting before you present it.
What happens if the model flags too many good parts as defective?
False positives are a real deployment risk and should be measured explicitly rather than assumed away. Any credible vendor reports accuracy, precision, recall, and false positive rate against a held-out test set of your own parts before live deployment, and a parallel running period lets you observe the behaviour on real production without any risk to disposition decisions. Where false positive rates run higher than acceptable early on, the correction is usually additional labelled examples of the edge cases causing confusion rather than a fundamental limitation. Building a defined false positive threshold into the pilot acceptance criteria protects the business case, and our support engineers help teams set realistic thresholds for their specific defect classes.
Stop Defending a Baseline Nobody Has Measured
Manual inspection will keep seeming to work until somebody counts what it misses. Book a thirty minute session with an iFactory vision engineer and walk out with a measured escape rate methodology, a hidden cost ledger built on your figures, and a payback model conservative enough to survive your capital committee. One line, one station, one clear answer.