Six boilers, one plant, and a combustion tuning problem that had outgrown what quarterly manual adjustments could fix — that was the starting point for a multi-site industrial energy user running a mix of gas and dual-fuel boilers across a manufacturing campus. Flame color, shape, and flicker carry more information about combustion quality than most operators realize, and for decades that information went unused because no one was watching closely enough, continuously enough, to act on it. Over a twelve-month deployment of AI flame vision across all six units, fuel consumption dropped 11%, carbon monoxide emissions fell 35%, and the plant closed the year with $2.4 million in avoided fuel spend. iFactory's combustion engineering team can walk through how the same flame-vision approach maps to your specific boiler fleet.
Case Study · Process Control
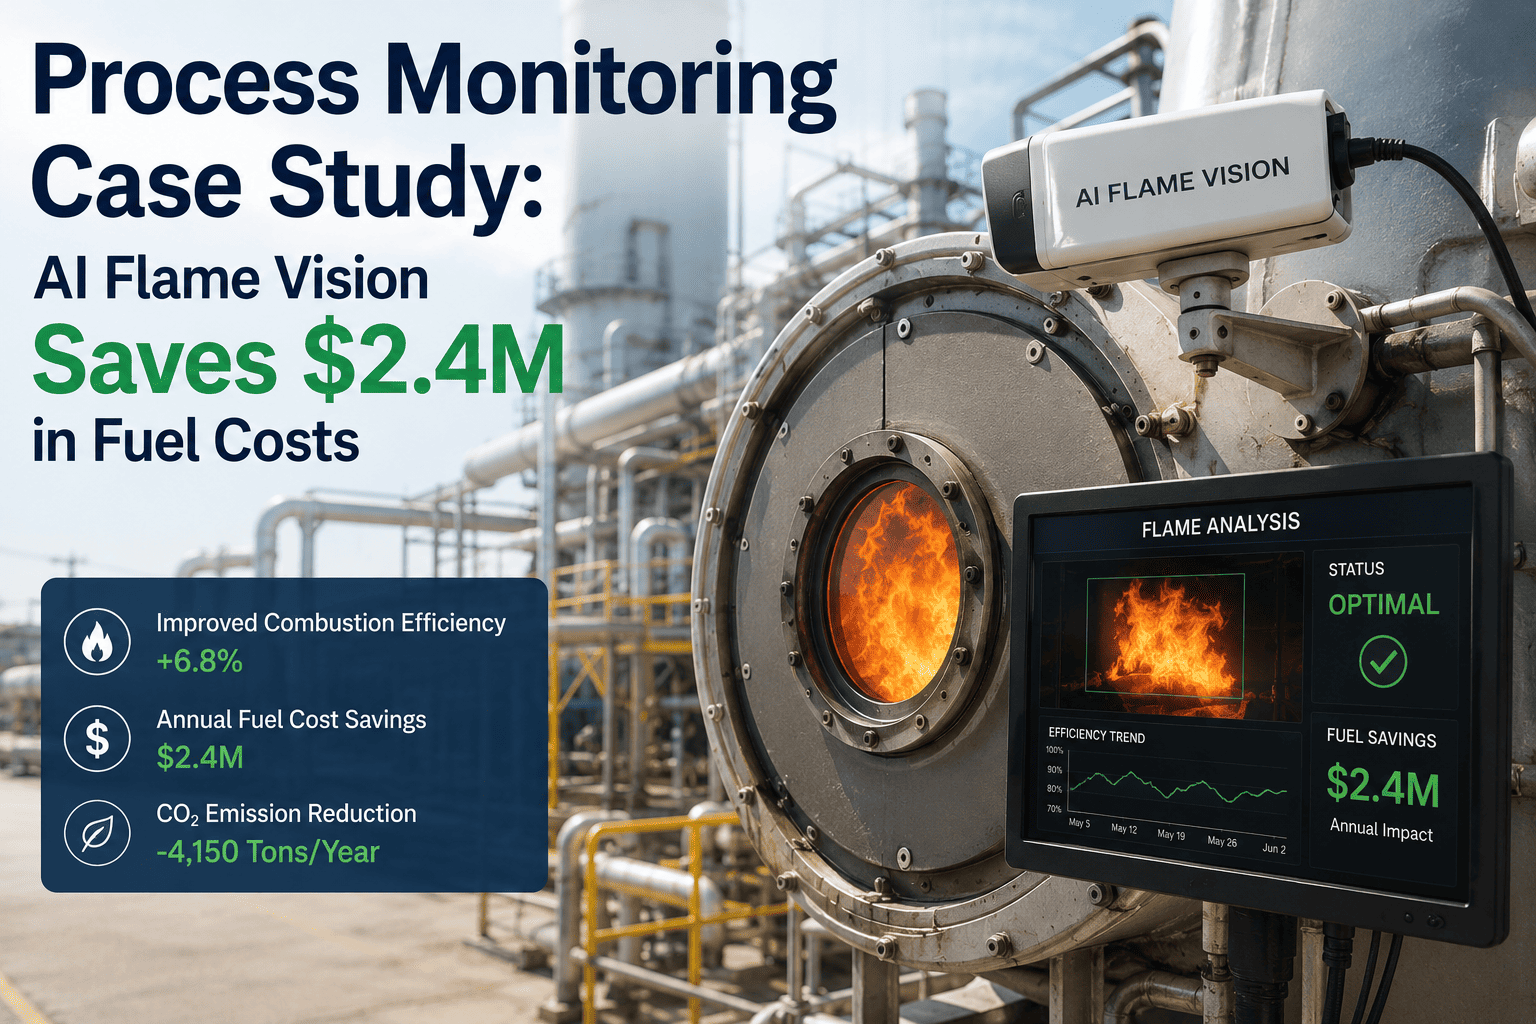
Process Monitoring Case Study: AI Flame Vision Saves $2.4M in Fuel Costs
A six-boiler industrial plant replaced quarterly manual combustion tuning with continuous AI flame vision. The result over twelve months: fuel consumption down 11%, CO emissions down 35%, and $2.4 million in documented annual fuel savings.
Twelve-Month Results Summary
$2.4M
Annual fuel cost savings
11%
Fuel consumption reduction
35%
CO emissions reduction
6
Boilers monitored continuously
Starting Conditions
Where the Plant Stood Before Flame Vision
The plant's six boilers ran a mix of natural gas and dual-fuel burners supplying process steam across a manufacturing campus. Combustion tuning followed the industry-standard pattern: a technician visited each unit on a quarterly schedule, adjusted the air-fuel ratio against a portable combustion gas analyzer, and left the settings in place until the next scheduled visit or an operator noticed a problem.
That approach has a known limitation documented across combustion engineering literature — a manual tuning visit sets the air-fuel ratio correctly for the conditions present that day, but ambient temperature, fuel composition, load demand, and burner wear all drift continuously between visits. Every day between tunings is a day of accumulating inefficiency that nobody is watching. The plant's baseline combustion efficiency sat within a normal range for manually tuned boilers of its type and age, but with no continuous visibility into how far that efficiency drifted between the quarterly resets.
Existing instrumentation included in-stack O2 analyzers and CO monitors on each unit, feeding data to the plant's DCS, but none of it drove automatic correction. The signals existed. Nobody had built the loop connecting them to a continuous adjustment.
The Deployment
How Flame Vision Reads Combustion Quality in Real Time
Flame color, luminosity distribution, shape, and flicker frequency each carry a measurable signature of the air-fuel mixture producing them — a relationship documented in combustion imaging research for over a decade and now practical to run continuously with modern camera hardware and trained vision models rather than only in a lab setting.
01
Camera Installed at Each Burner
A high-temperature-rated camera mounted at each of the six burners captured continuous flame footage, positioned to view the full flame envelope without interfering with existing burner management system components.
↓
02
Flame Signature Extraction
The vision model extracted color distribution, luminosity intensity, flame shape and length, and flicker frequency from each frame — the same visual parameters combustion researchers have shown correlate to air-fuel ratio and combustion completeness.
↓
03
Correlation Against O2 and CO Readings
Flame signatures were correlated in real time against the plant's existing in-stack O2 and CO analyzer readings, building a live model of which flame characteristics corresponded to complete combustion versus excess air or incomplete burn.
↓
04
Continuous Air-Fuel Ratio Recommendation
Rather than waiting for the next quarterly visit, the system generated air-fuel ratio adjustment recommendations continuously, catching drift within the same shift it occurred instead of accumulating for months.
↓
05
Operator Review and Setpoint Application
During the initial deployment phase, recommendations routed to operators for review before setpoint changes applied, building operator trust in the system's judgment before shifting toward more autonomous operation.
↓
06
Fleet-Wide Dashboard and Trend Tracking
All six boilers reported into a single combustion health dashboard, letting plant engineers compare units side by side and spot a burner drifting out of its efficient range before it became a fuel-cost problem.
See the Same Approach on Your Fleet
Walk Through the Flame Vision Model on Your Boilers
iFactory's combustion engineering team can review your current instrumentation, fuel mix, and tuning cadence, then map what a flame-vision deployment would look like on your specific burner configuration.
Twelve-Month Results
What Changed Across the Fleet
The results below reflect the full twelve-month period following go-live, compared against the prior year's baseline consumption and emissions data across the same six units.
Fuel Consumption
11% reduction fleet-wide
Continuous air-fuel ratio correction eliminated the accumulated drift that built up between quarterly manual tunings, keeping every boiler closer to its efficient operating band on every shift rather than only immediately after a tuning visit.
CO Emissions
35% reduction fleet-wide
CO is a direct indicator of incomplete combustion, and the sharp drop reflects flame conditions staying closer to complete combustion continuously instead of drifting toward excess fuel or insufficient air between corrections.
Annual Fuel Savings
$2.4M documented
The 11% consumption reduction translated directly into avoided fuel purchase cost across the plant's annual fuel volume, calculated against the same pricing the plant already paid for its gas and dual-fuel supply.
Tuning Frequency
Quarterly to continuous
Combustion correction shifted from a scheduled quarterly event to a continuous background process, with technician visits repositioned toward mechanical burner maintenance rather than routine tuning.
Cross-Unit Visibility
New capability
Plant engineers gained a fleet-wide view that didn't exist before, identifying which of the six units ran furthest from its efficient band and prioritizing mechanical attention accordingly instead of treating all units identically.
Payback Period
Under 18 months
The combined value of fuel savings and reduced manual tuning labor brought the deployment to payback well within the first two years of operation, consistent with combustion optimization's reputation as one of the highest-return efficiency programs available without capital equipment replacement.
Before and After
Quarterly Manual Tuning vs. Continuous Flame Vision
The comparison below reflects the operational difference between the plant's prior combustion management approach and the flame-vision system now running across all six units.
| Combustion Management |
Before: Quarterly Manual Tuning |
After: Continuous Flame Vision |
| Tuning Frequency |
Once per quarter, per unit |
Continuous, every operating hour |
| Drift Detection |
Undetected between visits |
Flagged within the same shift |
| Fleet Visibility |
Unit-by-unit, no comparison view |
Single dashboard across all six boilers |
| CO Emissions Trend |
Baseline, drifting upward between tunings |
35% lower, sustained across the year |
| Technician Time Allocation |
Routine tuning visits |
Mechanical maintenance, exception review |
The pattern that stands out most in the twelve-month data isn't any single number — it's that the fuel and emissions gains held steady across the full year rather than showing the sawtooth pattern of gradual drift followed by a quarterly correction that the plant's historical data showed before deployment.
Turnkey Deployment
How the Same Deployment Model Applies to Your Fleet
iFactory ships flame vision combustion monitoring as a pre-configured turnkey bundle — pre-racked NVIDIA AI server, high-temperature-rated cameras matched to your burner configuration, software pre-loaded with flame-signature models. Rack it, plug in power and Ethernet, and the AI begins correlating against your existing O2 and CO instrumentation immediately.
Weeks 1–4
Burner Survey and Hardware Ship
Camera placement mapped to each burner's flame envelope and existing instrumentation reviewed for O2 and CO analyzer integration points. Turnkey AI server shipped racked and network-ready.
Weeks 5–8
Correlation Building and Shadow Mode
Flame signature model trained against your specific fuel mix and burner behavior, correlated with existing gas analyzer readings, and run in shadow mode alongside current manual tuning practice to validate recommendations before they drive setpoints.
Weeks 9–12
Go-Live and Continuous Operation
System takes over continuous air-fuel ratio recommendation across the monitored fleet. Operators trained on the combustion health dashboard, with 24×7 remote monitoring by the iFactory support team beginning at go-live.
1000+Clients on iFactory platform
99.9%Platform uptime SLA
24×7Remote AI monitoring
6–12wkLive deployment timeline
Common Questions
Frequently Asked Questions
Does flame vision replace existing O2 and CO analyzers?
No, it works alongside them rather than replacing them. The flame vision model is trained using existing O2 and CO analyzer readings as the ground truth it correlates against, learning which flame color, shape, and flicker signatures correspond to which gas analyzer readings under your specific fuel and burner conditions. Once that correlation is established, the camera can flag combustion drift the moment it starts rather than waiting for the next scheduled analyzer check or manual walk-down, but the underlying gas analyzers remain the calibration reference the whole system is built against. Most industrial boilers already carry this instrumentation as part of their burner management system, which is exactly what
iFactory's combustion team reviews during the initial survey.
How quickly can a plant expect to see fuel savings after deployment?
The case study above reflects a full twelve-month measurement period, but combustion correction begins delivering value as soon as the system exits shadow mode and starts driving setpoint recommendations, typically around the eight-to-ten week mark in a standard deployment. Early gains tend to be the most dramatic, since the first corrections address whatever drift had already accumulated since the last manual tuning, while the ongoing continuous correction produces smaller but compounding gains across every shift afterward. Fuel savings scale with how far a plant's baseline tuning cadence sat from continuous correction — a plant tuning quarterly, like the one in this case study, has more accumulated drift to recover than one already tuning monthly.
Does this work on dual-fuel and biofuel-blend burners, or only natural gas?
Flame vision models are trained on the specific fuel and fuel-blend conditions present at your site, and combustion imaging research has documented flame characterization across natural gas, coal, and biogenic fuel blends, each producing distinct but learnable visual signatures. Dual-fuel burners and variable biofuel blends actually represent one of the stronger use cases for continuous flame monitoring, since fuel composition variability is exactly the kind of drift source that a quarterly manual tuning visit cannot track between visits. The training phase during deployment captures footage across your actual fuel mix and load range so the model learns the real operating envelope rather than a single-fuel assumption.
What happens if the camera view gets obscured by soot or heat distortion?
High-temperature-rated camera housings are specified during the site survey to withstand the thermal environment at each burner, and the vision model is trained to recognize when image quality has degraded below a usable threshold rather than continuing to generate recommendations from a compromised view. When that happens, the system flags the condition for review and falls back to the existing manual tuning process for that unit until the view is restored, rather than silently feeding an unreliable signal into the correction loop. This fail-safe behavior is part of why the system is designed to run alongside existing instrumentation and control constraints rather than as a standalone replacement.
How does this compare to a one-time combustion tuning consulting engagement?
A one-time tuning engagement, whether performed by an in-house technician or an outside combustion consultant, sets the air-fuel ratio correctly for the conditions present on the day of the visit and then holds that setting until someone returns to adjust it again. Flame vision replaces that snapshot-and-hold pattern with continuous correction, addressing the drift that accumulates from ambient conditions, fuel variability, and burner wear in the weeks and months between visits, which is precisely the gap this case study's plant closed. The two approaches aren't mutually exclusive: many deployments keep periodic mechanical inspection and burner maintenance on their existing schedule while flame vision handles the continuous tuning layer.
Book a demo to see how the two fit together on your fleet.
Stop Waiting for the Next Tuning Visit
See What Continuous Flame Vision Could Save on Your Fleet
iFactory's flame vision platform ships as a pre-configured turnkey bundle — hardware racked and ready, software pre-loaded with flame-signature models, correlation against your existing O2 and CO instrumentation scoped upfront, and 24×7 remote monitoring included. Get a turnkey AI quote with the twelve-week delivery timeline, or start with a focused pilot on your highest-fuel-cost unit to validate the savings before scaling fleet-wide.