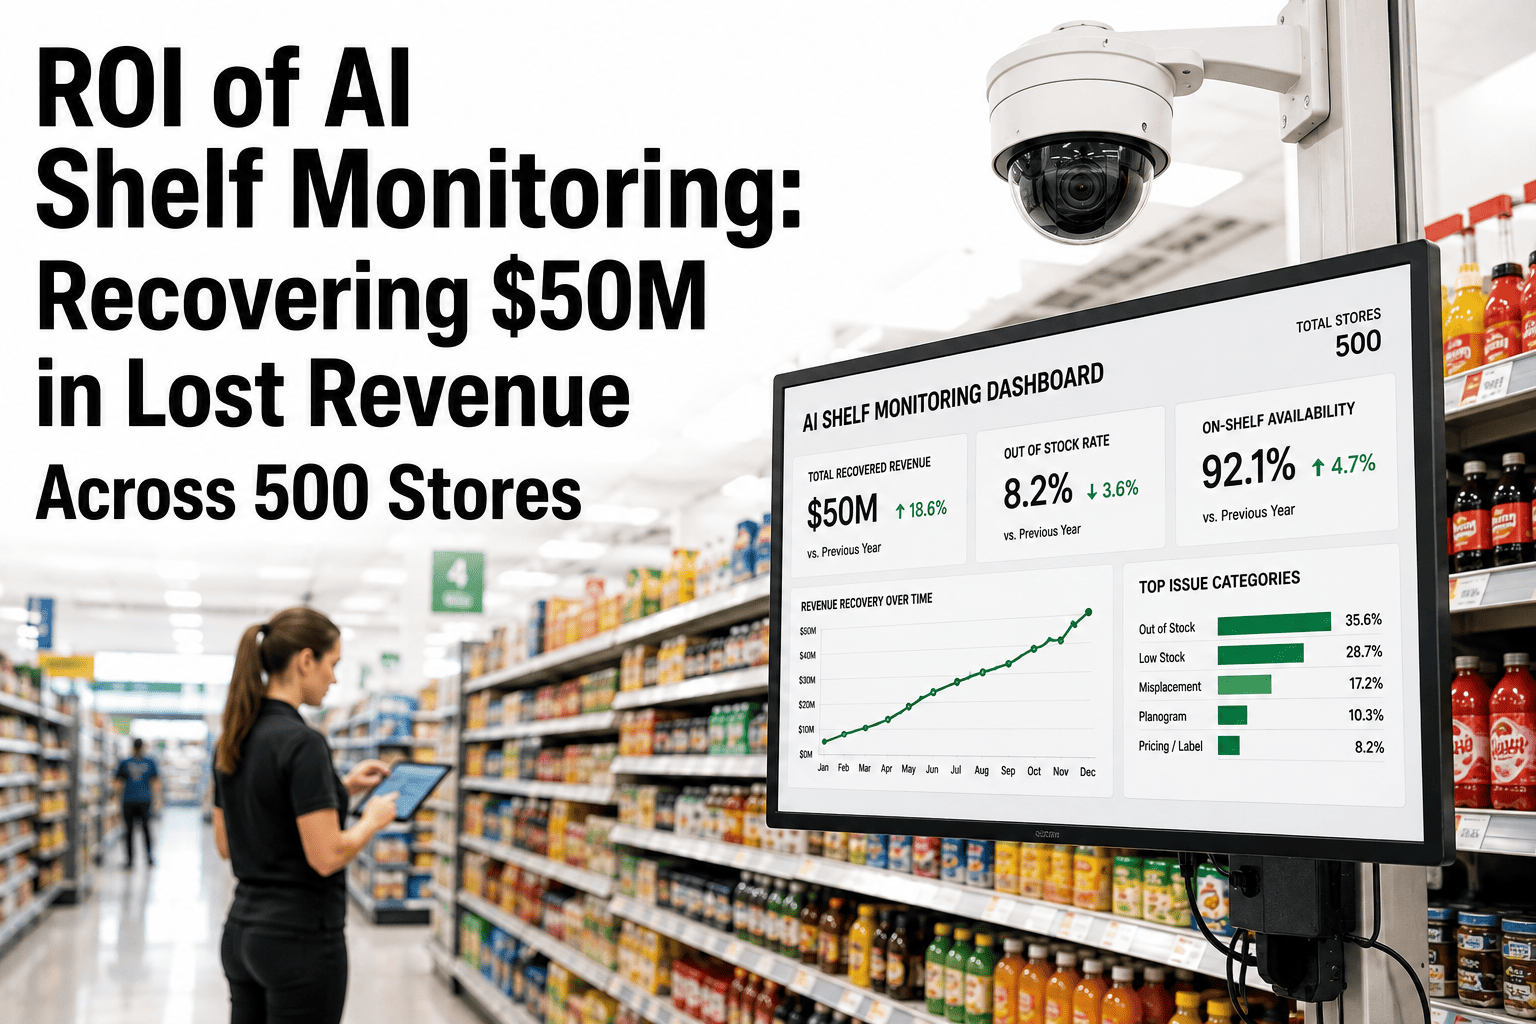
Run the math on 500 stores and the number stops feeling abstract fast. At $10M in average annual revenue per store, a modest 3% stockout rate is $150M walking out the door every year, spread thin enough across regions that most finance teams never see it as one number. Most of that loss is not a supply chain failure — the product is usually in the building, just not on the shelf where a shopper can find it. That is a detection and response problem, and it is exactly the one iFactory's AI shelf monitoring platform was built to close.
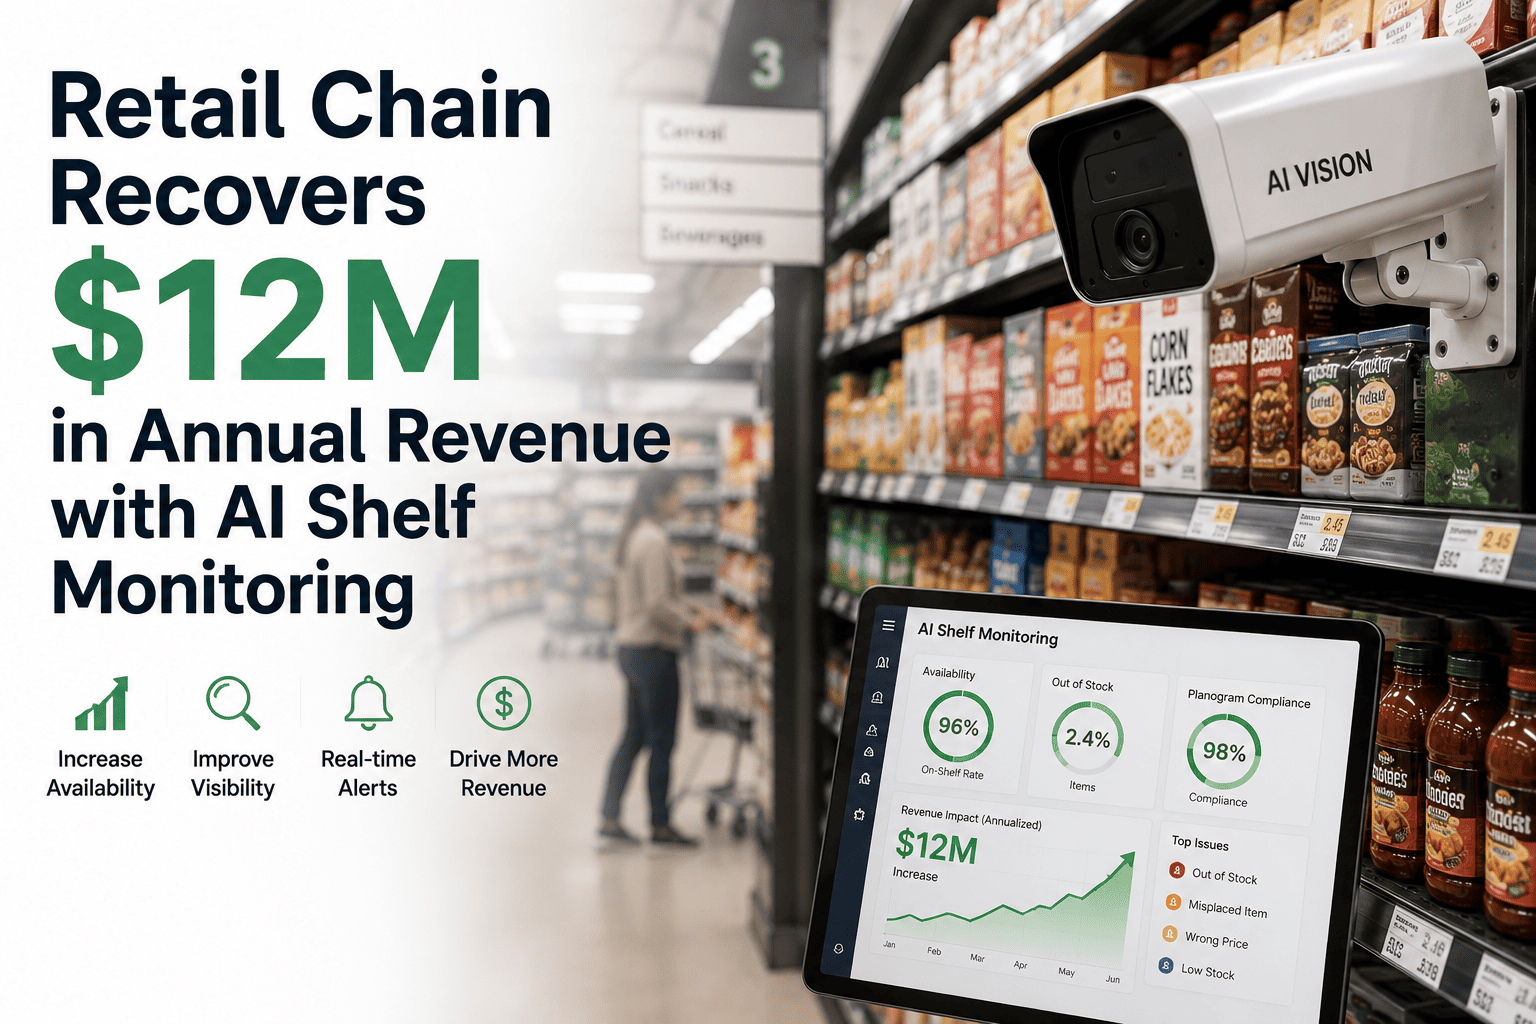
$150M in annual stockout leakage. $50M of it is recoverable within a year.
A 500-store chain at $10M average revenue per store loses roughly $150M a year to a 3% stockout rate. AI shelf monitoring recovers about a third of it — here's the math, the mechanism, and the deployment path.
How a 3% stockout rate becomes a $150M problem
The math is simple on purpose. It is the kind of number a CFO can sanity-check in thirty seconds, which is exactly why it holds up in budget conversations better than a vague efficiency argument about "improved shelf availability." Multiply store count by average revenue per store by stockout rate, and the output is not a modeling exercise — it is the revenue that never made it onto a receipt because a shopper stood in front of an empty facing and left without buying.
Three percent sounds small until it is expressed as a dollar figure at scale. On a single store doing $10M a year, a 3% stockout rate is $300,000 in missed sales — the kind of number a store manager might explain away as "a slow quarter" without ever connecting it to shelf gaps. Multiply that same rate across 500 locations and the explanation stops working, because $300,000 repeated 500 times is not noise. It is the single largest addressable revenue leak most retail finance teams have never formally quantified.
That 3% figure is deliberately conservative. Broader industry benchmarking places out-of-stock rates for U.S. food retail closer to 9-10% in recent years, and industry-wide inventory distortion research pegs the combined global cost of stockouts and overstocks well above a trillion dollars annually. A 500-store chain sitting at 3% is already doing better than most of its category — and still bleeding eight figures a year without knowing it. Chains running at the higher end of the industry range are not looking at a $150M problem; they are looking at a $300M-$500M one, and the recovery math scales with it proportionally.
What makes this figure especially uncomfortable for finance and operations leaders is how invisible it is inside standard reporting. Point-of-sale data only records what was sold — it has no mechanism for recording the sale that would have happened if the shelf had been full. Analysts call this censored demand: the moment a product sells out, the sales curve simply flatlines, and every forecasting model built on that flat line quietly underestimates true demand going forward. The stockout doesn't just cost the sale in the moment — it corrupts the data used to plan the next replenishment cycle, compounding the problem into the following week.
Most chains have never measured stockout rate at the SKU-and-shelf level in real time — only through delayed POS gaps or manual audits. Book a 30-minute walkthrough and we'll estimate your own leakage number using your store count and category mix.
$150M rarely shows up as one line item — that's the problem
No single store manager sees a $150M hole. What they see is a handful of empty facings on a Saturday afternoon, a vendor delivery running two hours late, a planogram reset nobody finished. The loss is real but it is fragmented across thousands of small, local, forgettable moments, which is exactly why it survives budget cycle after budget cycle without ever being named as a priority. Industry research on stockout root causes consistently attributes the large majority of out-of-stock events to retailer-side issues rather than supply chain shortages, meaning most of this loss is not a procurement problem — it is a visibility problem. A problem that never appears as a single number rarely gets a single owner, a single budget line, or a single fix.
The average stockout lasts far longer than anyone assumes
Once a shelf gap opens, it frequently persists for the better part of a day or longer before anyone notices and restocks, because manual shelf checks happen on a fixed schedule, not in response to the actual gap. Multiply that duration by every shopper who passes that section during the window and the missed-sale count climbs fast, even for a single facing on a single shelf.
Store systems say "in stock" when the shelf says otherwise
Phantom inventory — units the system believes are on the shelf but are actually missing, misplaced, or stuck in the backroom — creates a false sense of availability that suppresses reorder triggers entirely.
Shoppers don't complain, they just leave
A customer who can't find an item rarely files a report. They substitute, delay the purchase, or walk to a competitor, and the lost basket never appears in any dashboard as a "stockout event." Without visual confirmation of the gap itself, the loss is effectively invisible to every system built to measure store performance.
High-velocity SKUs are hit hardest and most often
The products that sell fastest are also the ones that run out fastest, which means your best-performing items are frequently the ones silently costing you the most in missed sales.
Manual audits sample a fraction of the store, a fraction of the time
A weekly walk-the-floor audit checks a handful of aisles for a few minutes — a tiny sample of the thousands of shelf-hours where a gap could have gone unnoticed between checks.
Shopping is moving to channels with zero tolerance for empty shelves
The cost of a stockout is not staying flat — it is getting worse, and the shift is structural rather than seasonal. A growing share of purchases now start with an AI shopping assistant or agentic buying tool rather than a browsed aisle, and those tools behave very differently from a human walking past a gap. A shopper who finds an empty shelf might substitute, delay, or grumble and buy anyway. An AI agent tasked with finding an available product simply routes the purchase to whichever retailer actually has it in stock, with no loyalty to the brand that used to carry the sale.
That dynamic converts a formerly forgivable inconvenience into an immediate, permanent revenue transfer to a competitor. It also means the retailers who close their detection gap fastest are not just protecting today's $150M — they are positioning themselves to capture share from competitors who are still relying on scheduled manual walks while demand routes itself toward whoever can prove availability in real time. The chains treating shelf visibility as a nice-to-have Store Ops project are the ones most exposed as this shift accelerates.
Pricing pressure compounds the same trend from a different angle. Retail margins have stayed thin even as merchandise costs and shrink losses have climbed, which means every dollar of avoidable revenue leakage carries a heavier relative weight on the bottom line than it did a few years ago. A recovery plan that doesn't require renegotiating supplier contracts or absorbing new capital expenditure on inventory — one that instead comes from fixing a detection and response gap that already exists inside the four walls of the store — is one of the few remaining levers finance teams can pull without touching margin structure elsewhere.
Why roughly a third of the leakage is realistically recoverable
Recovering 100% of stockout losses isn't a credible claim from any vendor, and you should be skeptical of anyone who makes it. Some stockouts stem from genuine supply constraints — a supplier shortage, a freight delay, a demand spike no forecast predicted — that no shelf camera can fix, because the product simply isn't in the building yet. But research into the root causes of stockouts consistently finds that the majority originate on the retailer's own side of the equation: replenishment that happened too slowly, inventory records that didn't match reality, or a gap that nobody noticed until the next scheduled walk.
That retailer-controllable share is where AI shelf monitoring earns its return, and it is large enough to move the needle materially precisely because the fix is not a supply chain overhaul — it is compressing the time between a gap appearing and a human being told about it. A shelf that sits empty for hours because nobody was watching costs exactly the same in lost sales as a shelf that's empty because the warehouse ran out. The difference is that one of those is fixable with faster detection, and the other isn't. Shelf monitoring targets the one that is.
Continuous shelf detection
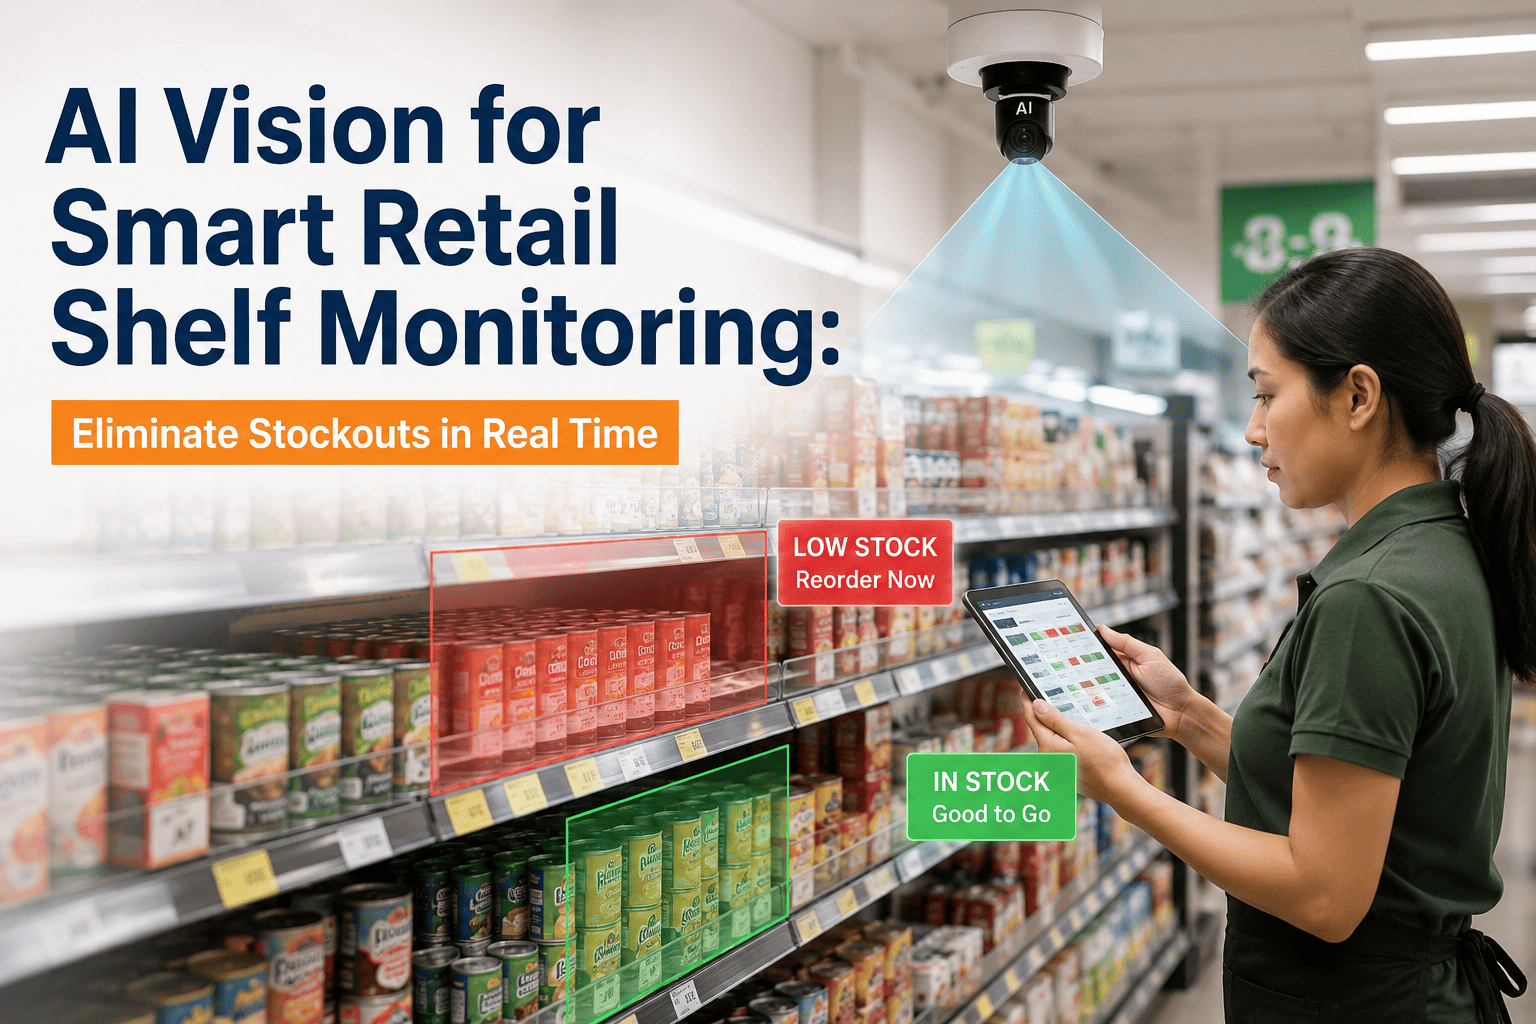
Cameras read every facing across every monitored aisle throughout the day, not on a weekly walk-the-floor schedule.
Gap identified in seconds
An empty or critically low facing is flagged the moment it's detected, with the exact SKU and shelf location attached.
Alert reaches the floor, not a dashboard
Store associates get a mobile alert with location and SKU, turning a same-day fix into a same-minute one.
Recovery compounds across stores
Multiply minutes saved per gap by thousands of gaps a year across 500 stores, and the recovered revenue adds up fast.
Run that mechanism against the $150M leakage figure and the recoverable third — roughly $50M — comes from compressing response time on the controllable share of stockouts: the restocks that were delayed by hours instead of minutes, and the phantom-inventory gaps nobody was actively watching for at all.
What changes at the shelf level
The dollar figures matter, but they are the output of a much simpler operational shift: how quickly a gap on the shelf becomes a person walking toward it with the right product in hand. Everything else in the recovery model traces back to closing that one gap between detection and action.
See what your own leakage number looks like
Bring your store count, average revenue, and current stockout estimate to a 30-minute session and we'll model the recoverable range against your actual footprint, not a generic benchmark.
What a 500-store deployment typically achieves in the first year
What this looks like at your store count
The 500-store, $10M-per-store example is a reference point, not a ceiling. The underlying ratio — roughly a third of stockout leakage being recoverable through faster detection and response — holds directionally across most multi-store formats, though the exact recovery share shifts with category mix, current audit frequency, and how phantom inventory is currently handled.
| Store count | Avg. revenue/store | Est. annual leakage (3%) | Est. recoverable (~33%) |
|---|---|---|---|
| 100 stores | $10M | $30M | ~$10M |
| 250 stores | $10M | $75M | ~$25M |
| 500 stores | $10M | $150M | ~$50M |
| 1,000 stores | $10M | $300M | ~$100M |
These figures are directional planning estimates, not guarantees for any specific chain. Your actual recoverable share depends on today's stockout rate, category velocity, and how much of your current shrinkage is already retailer-controllable versus supply-side. A grocery or convenience format with high-frequency, high-velocity SKUs typically sees stockout rates and recovery potential on the higher end of the range, since fast-moving categories run out more often and get noticed less quickly under a manual audit schedule. A general merchandise or apparel format with slower turnover may see a smaller absolute number but often has more slack in its current audit process to improve, which shows up as a larger relative gain once monitoring goes live.
A pilot against your own store data gives a far more precise number than any table can, because it replaces industry averages with your actual stockout frequency, your actual category mix, and your actual current response time. That's the number that belongs in a board deck — not a benchmark borrowed from a chain with a different footprint.
How a shelf monitoring pilot actually rolls out
None of the recovery math above matters if the rollout itself is disruptive to store operations. The deployment path is built to validate accuracy before any alert ever reaches a store associate, so the first live alert a team receives is one they can already trust rather than one they have to learn to trust over time.
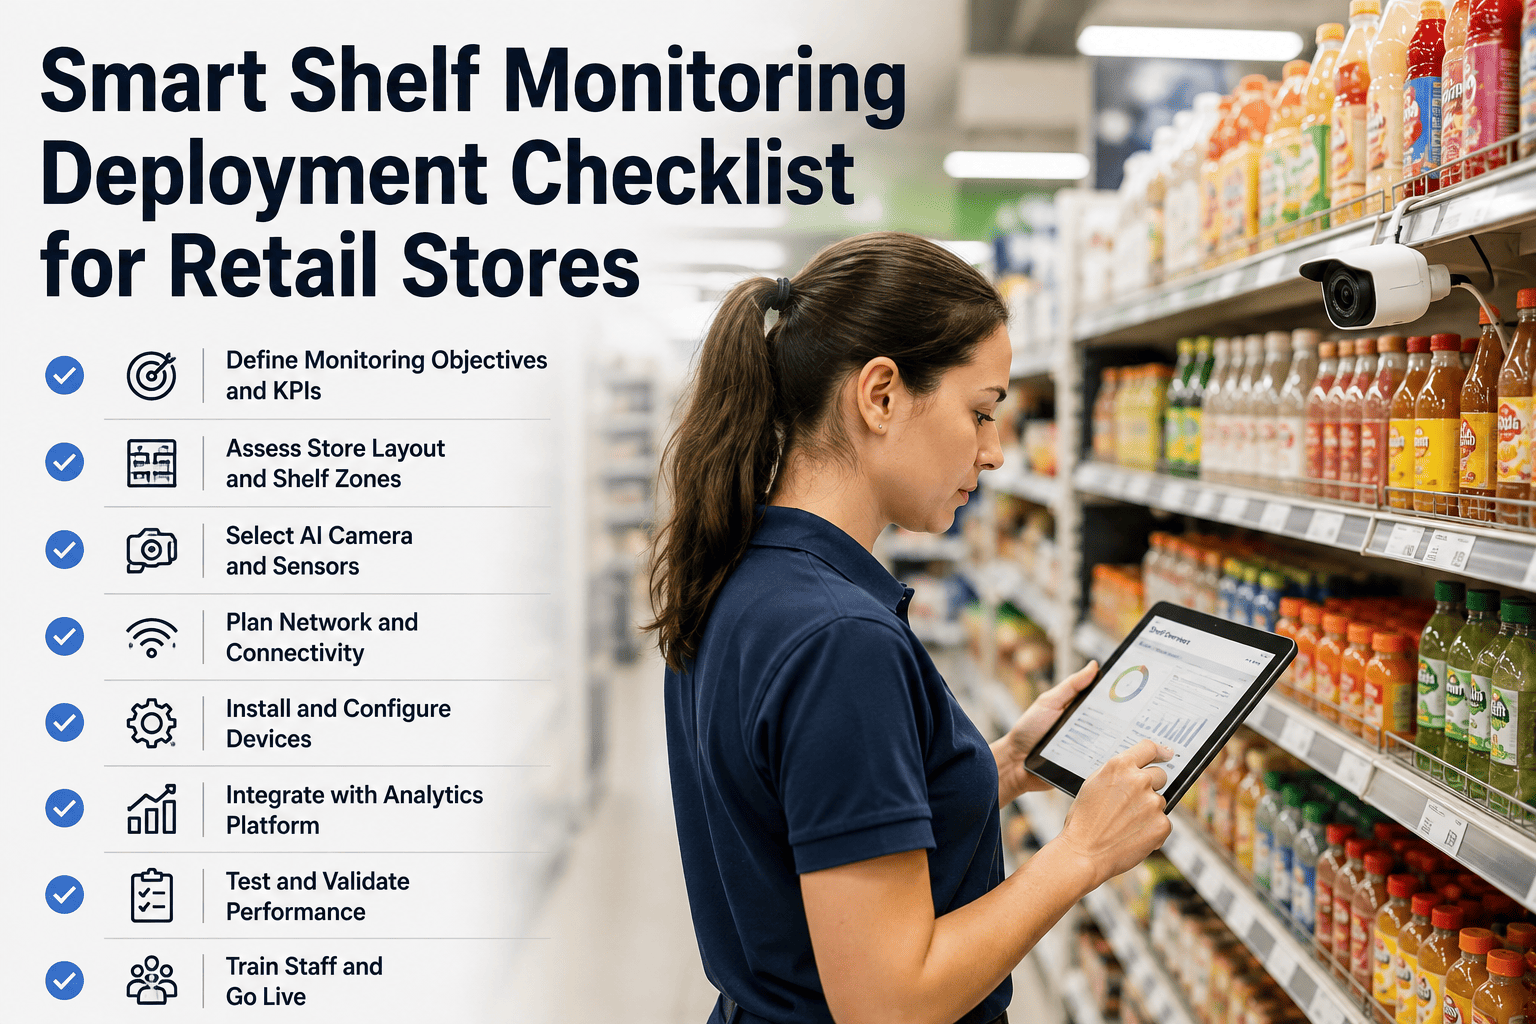
Weeks 1-2: Site assessment and camera planning
Store layout, existing camera infrastructure, and highest-leakage categories are mapped to determine coverage and mounting points before any hardware goes in.
Weeks 3-5: Installation and model calibration
Cameras go live and the recognition model is trained against your specific SKUs, fixtures, and lighting conditions rather than a generic product catalog.
Weeks 6-8: Shadow-mode validation
Detection runs alongside existing manual processes so accuracy is validated against real shelf conditions before alerts start driving staff action.
Weeks 9-10: Live alerts and staff rollout
Store associates start receiving real-time gap alerts on mobile devices, with response time tracked from day one to build the ROI baseline.
Beyond week 10: Chain-wide expansion
Once the pilot stores validate accuracy and response-time improvement, rollout expands store by store using the same calibration and training workflow.
The ROI math, explained plainly
$50M doesn't recover itself — the detection gap has to close first
Every week on manual shelf checks is another week of silent leakage. See what real-time detection would recover across your store count.