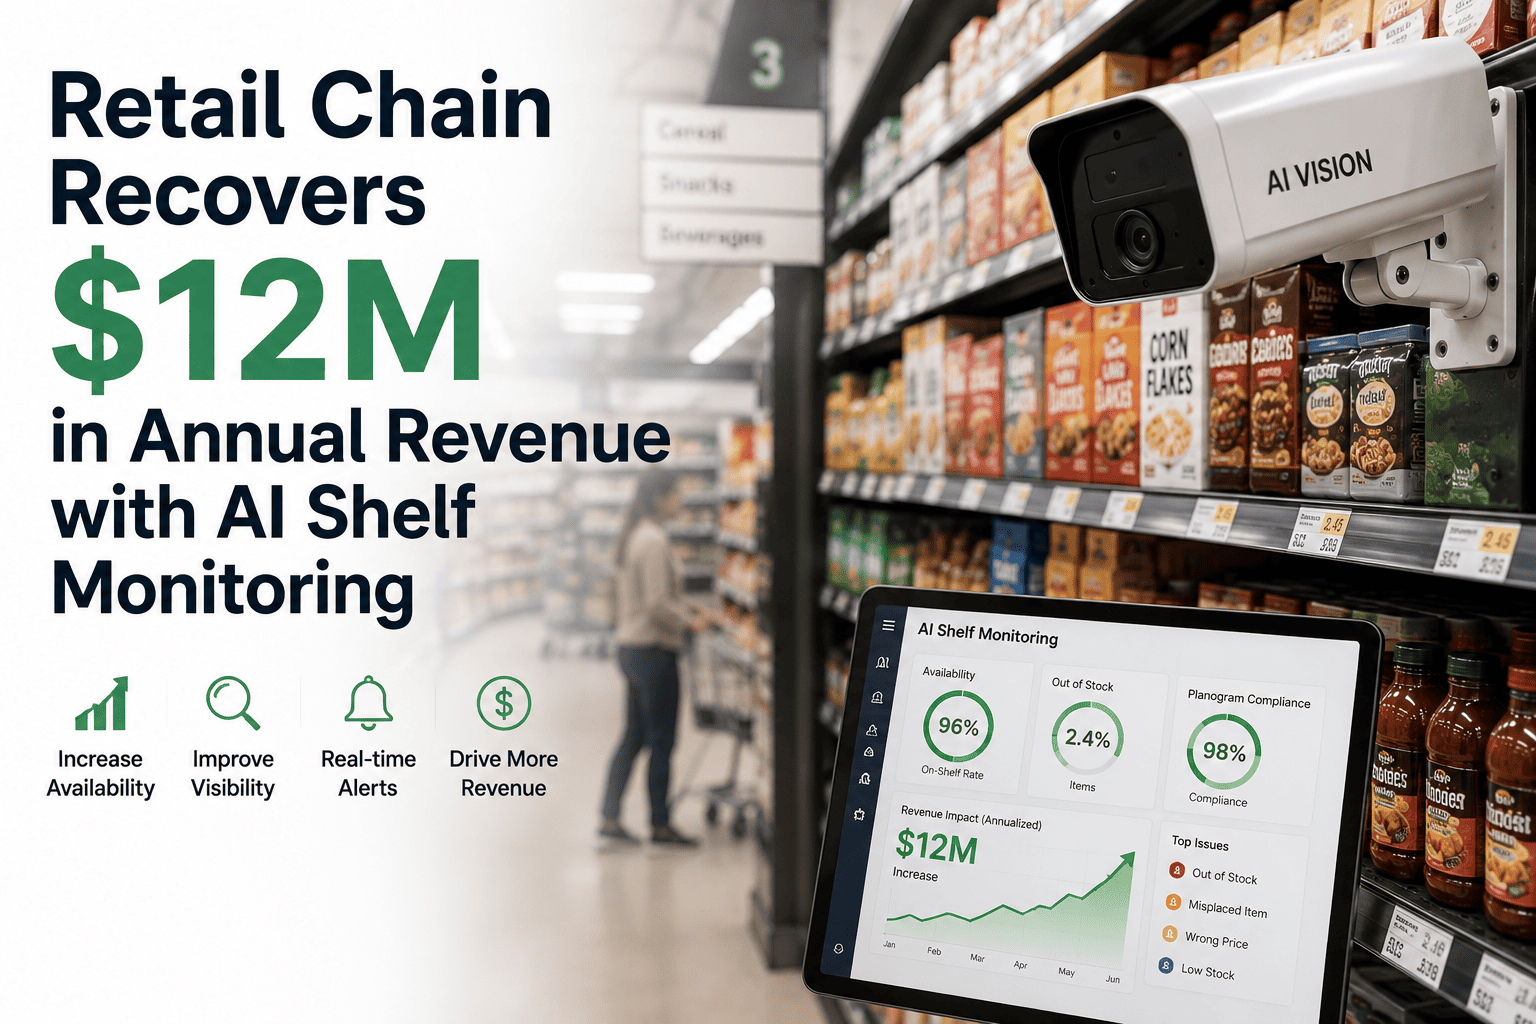
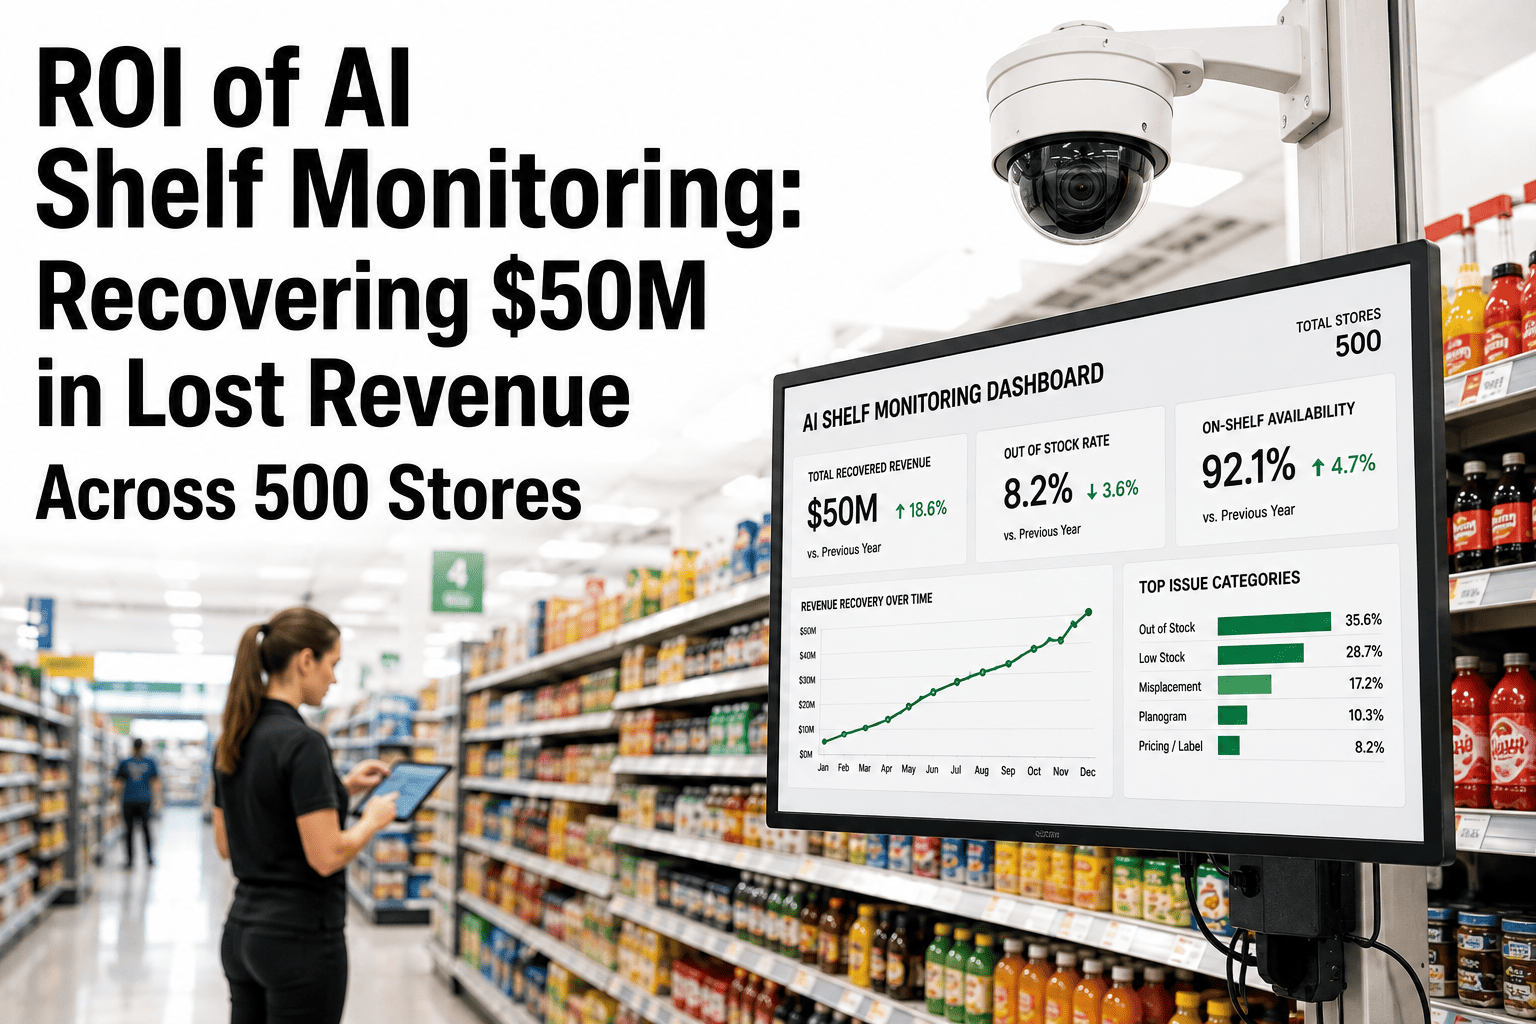
A 200-store grocery chain was losing revenue in a way its own reporting could not see. Sales data only shows what sold — it goes quiet the moment a shelf runs empty, so a gap that sat open for six hours looked identical in the numbers to a slow sales day. Store walks caught some of it, days after the fact, on a schedule too slow to matter. The chain needed to see the shelf itself, in real time, across fresh, dairy, and center store aisles in every location. iFactory deployed AI shelf monitoring cameras across the network, and within the first year the chain recovered $12M in revenue that had been quietly disappearing through empty shelf space.
Smart Retail · Case Study
How a 200-Store Grocery Chain Recovered $12M by Watching Its Shelves in Real Time
Stockouts were costing this chain revenue it never saw in its own sales reports. AI shelf monitoring across fresh, dairy, and center store aisles cut the stockout rate 45% and recovered $12M in Year 1.
Year 1 Snapshot
The Results, at a Glance
Before any category breakdown or rollout detail, here is what changed across the chain's 200 stores in the twelve months after AI shelf monitoring went live. Every figure below reflects the shift from a reactive, schedule-based store walk process to continuous, camera-based shelf visibility.
$12M
Revenue recovered in Year 1 from previously undetected shelf gaps
45%
Reduction in stockout rate across fresh, dairy, and center store
200
Stores covered under a single shelf-monitoring rollout
3
Department categories prioritized: fresh, dairy, center store
The Situation Before
Why Sales Reports Never Showed the Real Problem
Grocery is one of the categories hit hardest by stockouts, because customers visit frequently and encounter gaps often. Industry-wide, the average grocery stockout rate runs close to 8 to 9.5% of SKUs at any given time, and the average stockout does not resolve quickly — it can sit open for weeks before full replenishment catches up. For this chain, the problem was not a lack of inventory. It was a lack of visibility into which shelf, in which store, was empty right now, and how long it had already been that way before anyone walked past to notice.
1
Store walks caught gaps days too late
Manual shelf audits ran on a fixed schedule, often once or twice a day per department. A gap that opened right after a walk could sit empty for hours before anyone noticed it.
2
Sales data went silent exactly when it mattered most
Point-of-sale data only reflects what customers bought. Once a shelf is empty, the data cannot distinguish a stockout from genuinely low demand, hiding the loss inside normal-looking sales curves.
3
Fresh and dairy carried the highest exposure
Perishable categories restock most frequently and run out fastest, making them the departments where a missed shelf check translates most directly into lost same-day sales.
4
Lost sales were invisible to the finance team
Because stockout losses show up as an absence in the data rather than a visible cost line, the chain's leadership had no reliable number to point to — only a general sense that shelves were sometimes empty.
Why Stockouts Cost More Than They Look Like
What Happens the Moment a Shelf Goes Empty
Retail research on shopper response to out-of-stock items shows a consistent pattern: most customers do not wait. A missing item on the shelf sends a meaningful share of shoppers straight to a competitor, and a smaller but real share simply abandons the purchase entirely.
Shoppers who buy the item elsewhere
Shoppers who substitute a different product
Shoppers who simply don't buy at all
Average stockout duration before full replenishment
The Deployment
Cameras Already on the Ceiling, Given a New Job
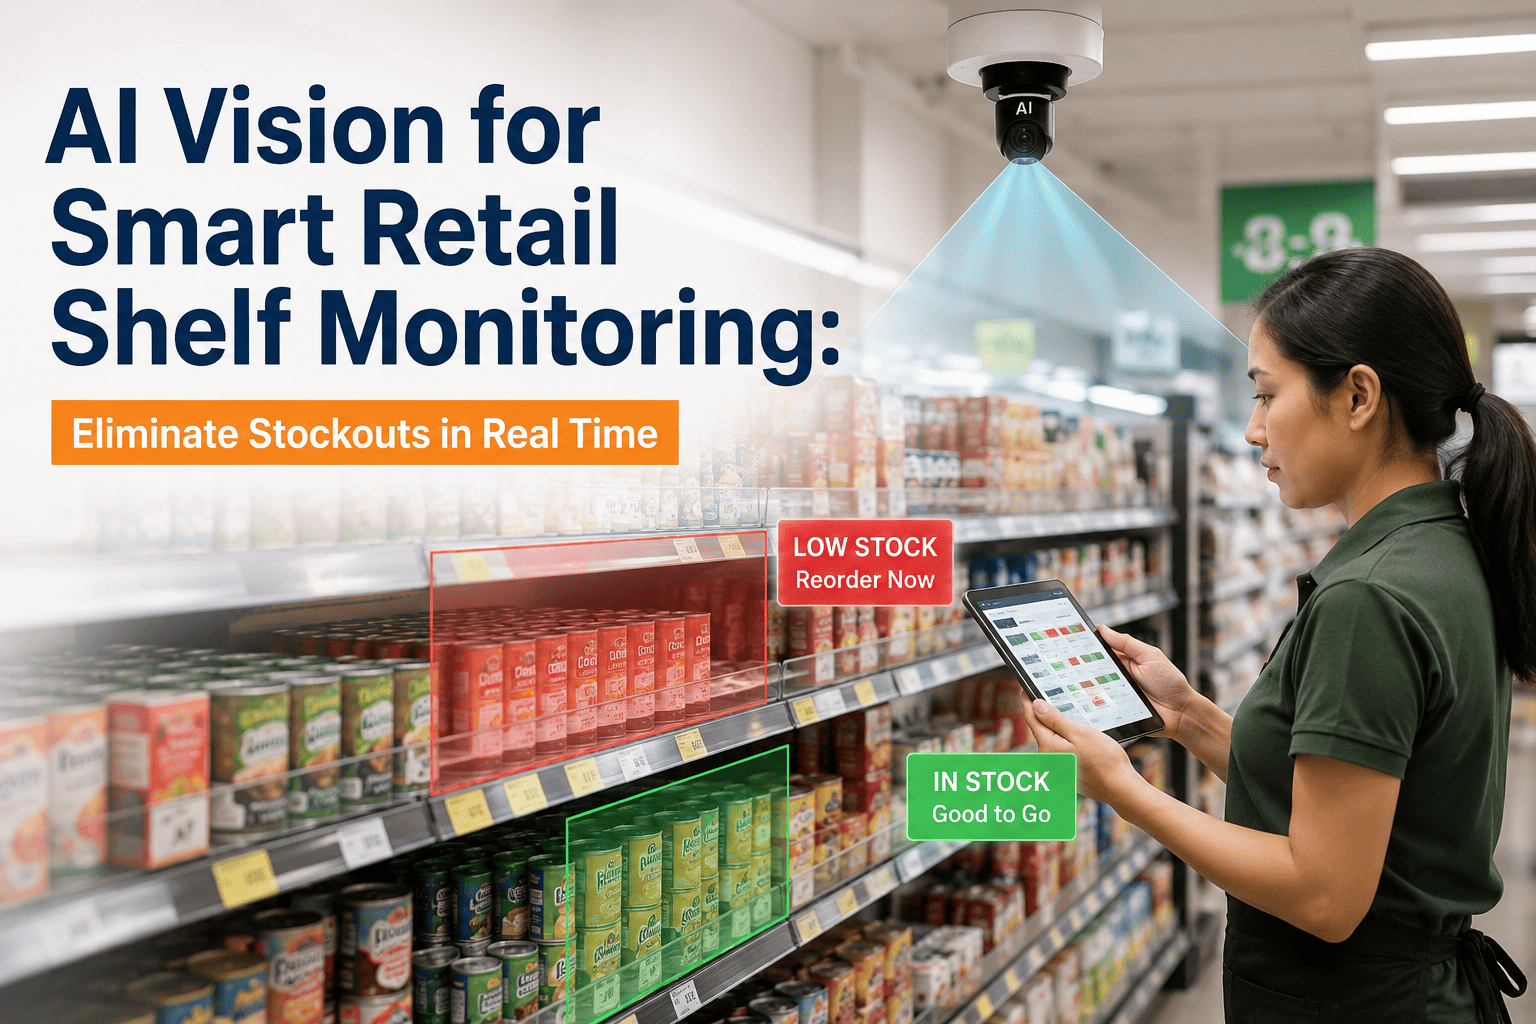
iFactory's AI shelf monitoring connects to camera coverage across store aisles, comparing live shelf conditions against expected stock and planogram layout — flagging gaps the moment they appear, not on the next scheduled walk.
What Changed
From Scheduled Walks to Continuous Shelf Visibility
The rollout gave every store the same real-time visibility a single high-traffic location might have gotten from a full-time shelf auditor — except running continuously, across all 200 stores, at once. Four capabilities did most of the work.
Real-time gap detection
Cameras identify empty shelf space and low-fill conditions as they occur, flagging them to store staff instead of waiting for the next scheduled check.
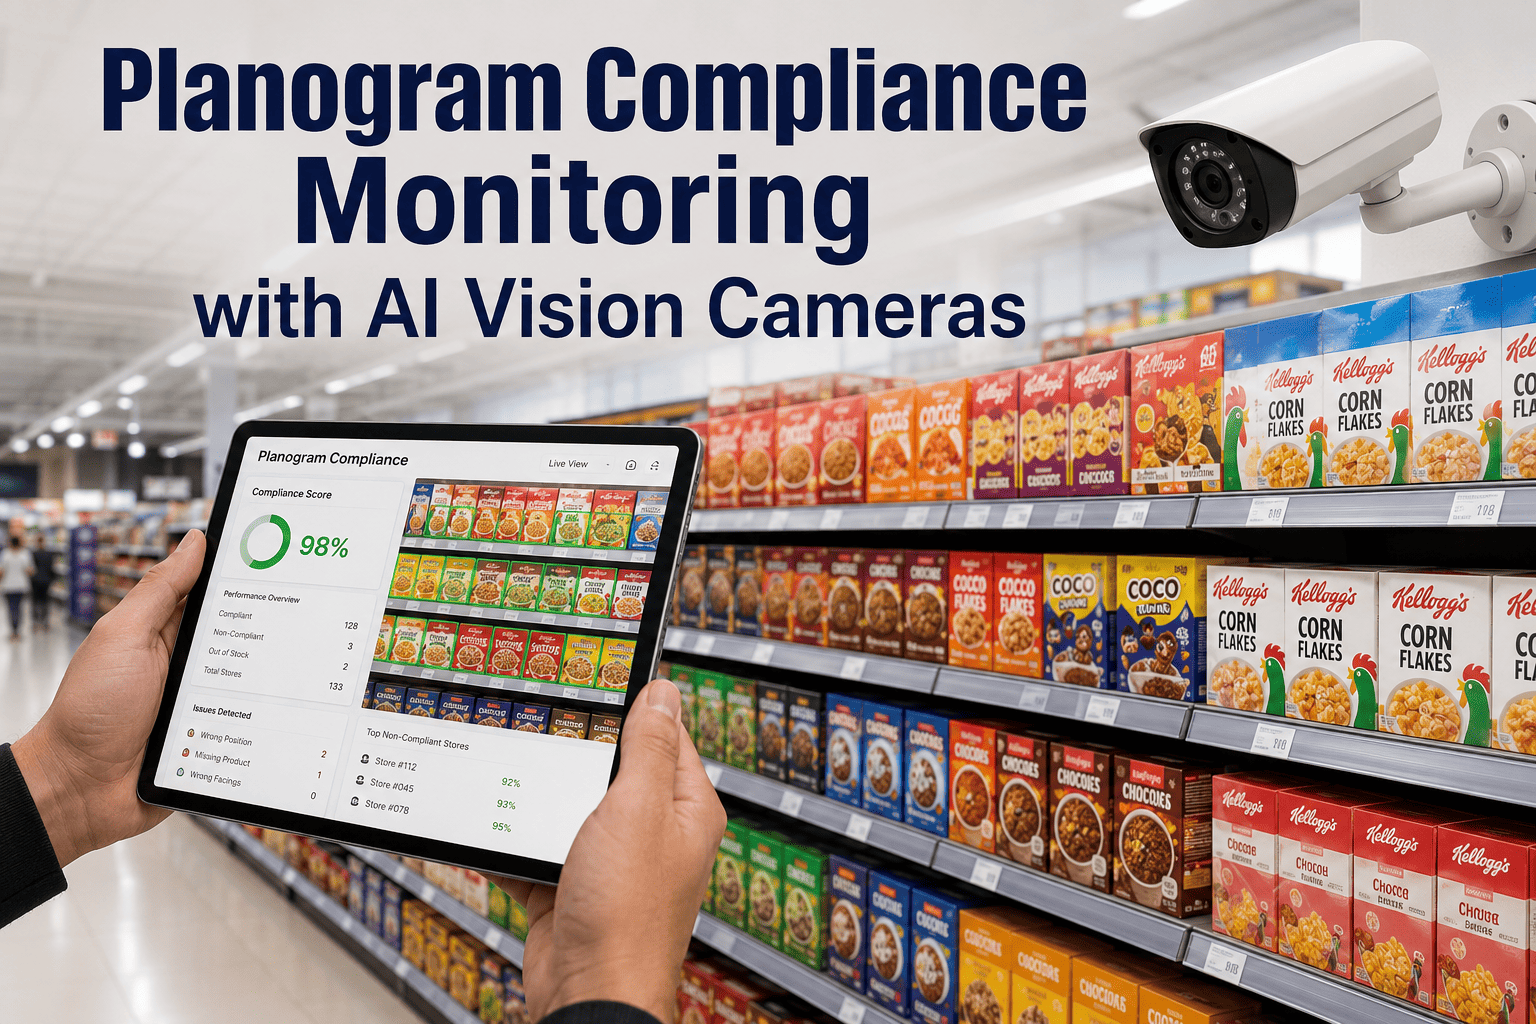
Planogram compliance checks
Live shelf images are compared against the intended layout, surfacing misplacements and out-of-planogram sections alongside pure stockouts.
Category-level prioritization
Fresh and dairy, the fastest-turning and highest-loss categories, were configured with tighter alert thresholds than slower-moving center store aisles.
Store-level accountability data
For the first time, regional managers could see stockout frequency and resolution time by store and by department, rather than relying on anecdotal walk reports.
Why This Wasn't a Staffing Problem
Store Teams Were Working Hard. The Process Was the Bottleneck.
It would be easy to read this case as a story about understaffed stores or inattentive employees. That was not what the data showed. Store associates across the chain were completing their scheduled walks and restocking what they found — the problem was the gap between how often a shelf needed checking and how often a human being could realistically check it. A 200-store chain running fresh, dairy, and center store departments generates far more shelf-state changes per hour than any walk schedule can keep pace with, no matter how disciplined the team executing it.
This is the structural reason a technology fix, rather than a staffing fix, produced the result. Adding more scheduled walks would have added labor cost without closing the detection gap, since the fundamental issue was latency between a shelf going empty and someone noticing — not effort. Continuous camera-based monitoring collapses that latency from hours down to minutes, which is the entire mechanism behind the revenue recovery.
The First Year
How the Results Built Over Twelve Months
The stockout rate did not drop all at once. Early months were about proving the alerts were accurate and getting store teams into a rhythm of acting on them; the larger revenue recovery followed once that rhythm was established.
Wks 1–4
Camera Coverage Mapped and Calibrated
Existing camera coverage across pilot stores was mapped to aisle and shelf zones, with planogram references loaded for fresh, dairy, and center store.
Mos 2–3
Pilot Stores Validate Alert Accuracy
A smaller group of stores ran the system alongside existing store-walk processes, tuning alert thresholds until flagged gaps matched what staff found in person.
Mos 4–6
Chain-Wide Rollout
Coverage expanded to all 200 stores, with regional teams receiving store-level stockout dashboards for the first time.
Mos 7–12
Stockout Rate Drops, Revenue Recovery Compounds
As staff response time to alerts improved, the stockout rate fell 45% from baseline, with the recovered revenue accumulating to $12M by year end.
Where the Recovery Came From
Fresh and Dairy Drove the Largest Share of Recovered Revenue
Not every department contributed equally. The categories with the fastest turnover and shortest shelf life had the most to gain from real-time detection, since a gap in these aisles converts to a lost sale the fastest.
| Department | Baseline Stockout Rate | Year 1 Stockout Rate | Contribution to Recovery |
|---|
| Fresh (produce, bakery) | Above chain average | Reduced sharply, fastest response times | Largest single share of recovered revenue |
| Dairy | Above chain average | Reduced sharply, tightest alert thresholds | Second-largest contributor |
| Center store | At or near chain average | Steady, consistent improvement | Broad, distributed contribution across SKUs |
Where This Pattern Applies
Retail Environments Where Shelf Visibility Pays for Itself Fastest
This chain's results are not unique to a single retailer. The underlying pattern — high-frequency categories where a shelf gap converts to a lost sale within hours — shows up across a range of retail formats, and the size of the opportunity scales roughly with how often a category turns over and how many locations are running on the same manual-walk model.
Multi-store grocery chains
High visit frequency and perishable categories mean stockouts compound fast, and a store-walk schedule can never keep pace across dozens or hundreds of locations.
Convenience and c-store networks
Small footprint stores turn inventory quickly and often run leaner staffing, making automated shelf checks a direct labor-hour saving as well as a revenue recovery tool.
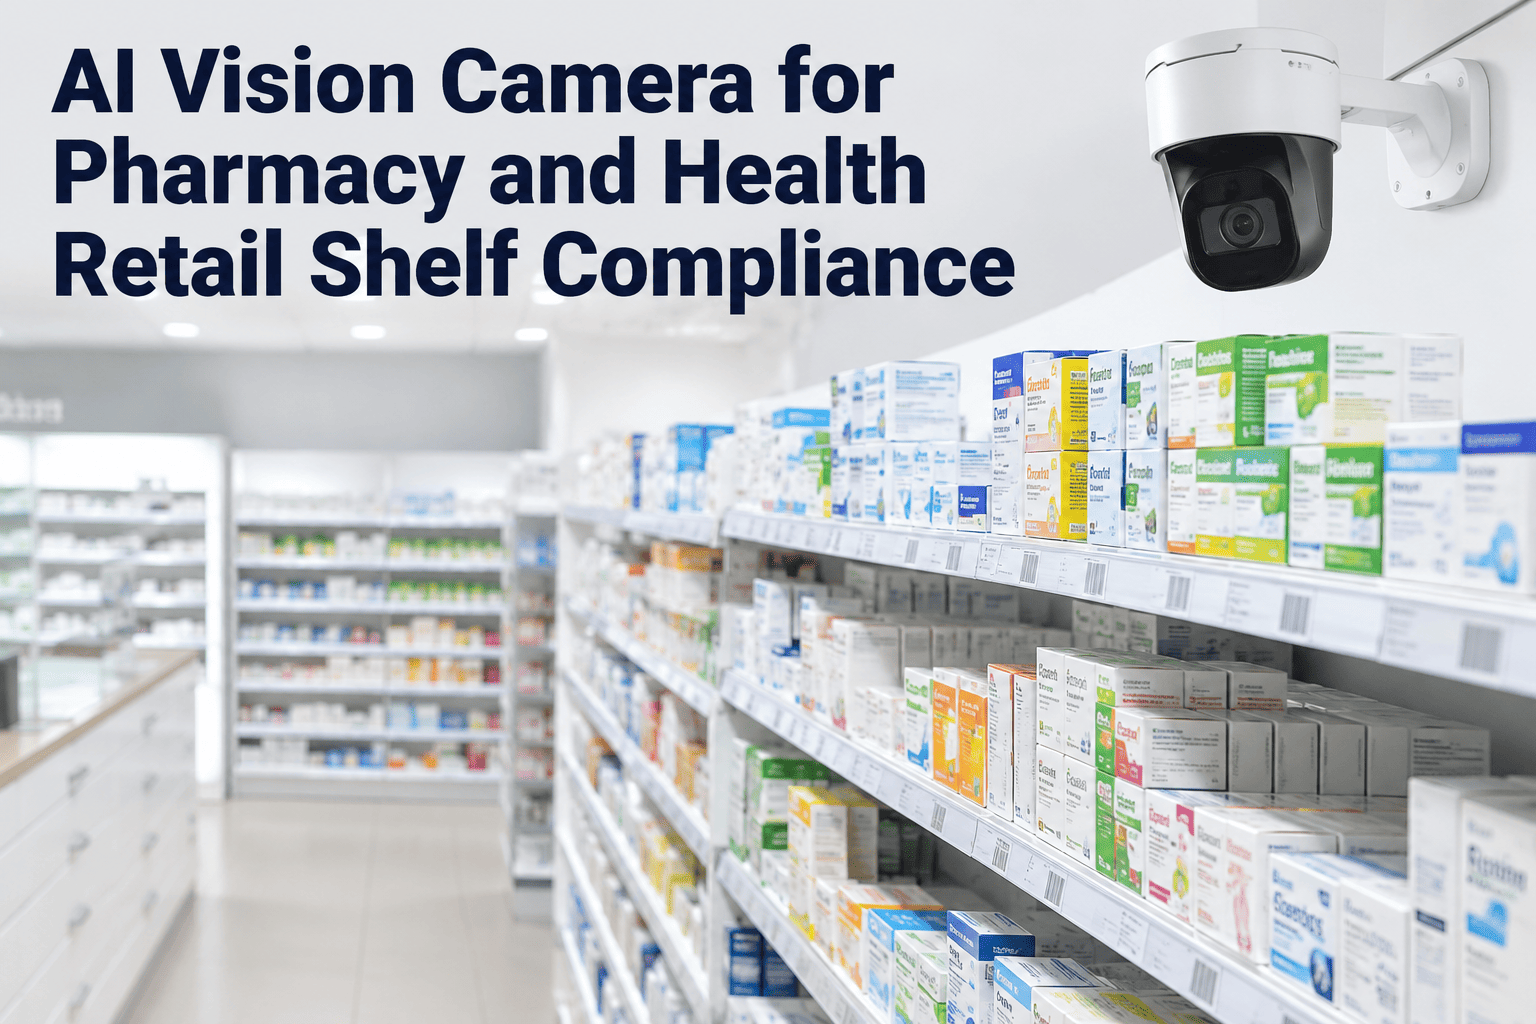
Pharmacy and drug store chains
Planogram compliance carries both a sales and a regulatory dimension, and continuous monitoring catches misplacements that manual audits routinely miss.
Big-box and department retailers
Large floor plans make manual walks slow and incomplete, so camera-based coverage extends visibility to sections a physical audit realistically cannot reach every day.
Common Questions
Frequently Asked Questions
How does AI shelf monitoring actually detect a stockout versus a low-stock condition?
The system compares live camera images of each shelf section against the expected product layout and fill level, distinguishing an empty gap from a section that is simply running low. Detection accuracy for missing items and non-compliance conditions typically runs in the 95 to 99% range once the system is calibrated to a store's actual shelf conditions and lighting. That calibration step, done during a pilot phase, is what keeps the alerts trustworthy enough for staff to act on immediately rather than double-checking every flag.
Does this require installing new cameras, or does it work with what a store already has?
In most cases, existing store camera coverage can be used or supplemented with additional aisle-facing cameras where shelf visibility is currently limited. The system does not require replacing an entire security camera network — it adds shelf-monitoring capability to camera infrastructure a store is often already running for loss prevention.
Support can assess a specific store's existing coverage before recommending any additional camera placement.
Why did fresh and dairy see the largest share of recovered revenue in this case?
Perishable categories restock most frequently and have the shortest window between a shelf going empty and a customer walking away empty-handed, so real-time detection has the most immediate financial effect there. Center store categories still benefited, but with longer shelf life and slower turnover, a delayed restock in those aisles costs less per hour of exposure than the same delay in fresh or dairy.
How long does it take before a multi-store rollout starts showing measurable results?
In this case, the pilot phase ran two to three months to validate alert accuracy before expanding to the full store network, with the larger revenue recovery building over the following six months as staff response time to alerts improved. The pattern is consistent across rollouts of this type: early months establish trust in the alerts, and the compounding financial benefit follows once store teams are consistently acting on them.
Can shelf monitoring results like this be modeled against a specific store network before committing to a rollout?
Yes — a baseline stockout rate, category mix, and store count can be used to estimate the likely scale of recovery for a specific chain before a full deployment begins.
Book a demo to walk through how this case study's approach would translate to a specific store network and category mix.
See What's Sitting on Your Shelves Right Now
The Revenue Was Never Actually Lost. It Was Just Invisible.
iFactory's AI shelf monitoring turns existing store camera coverage into continuous, real-time visibility across every aisle — catching the gaps that sales reports and scheduled store walks miss.