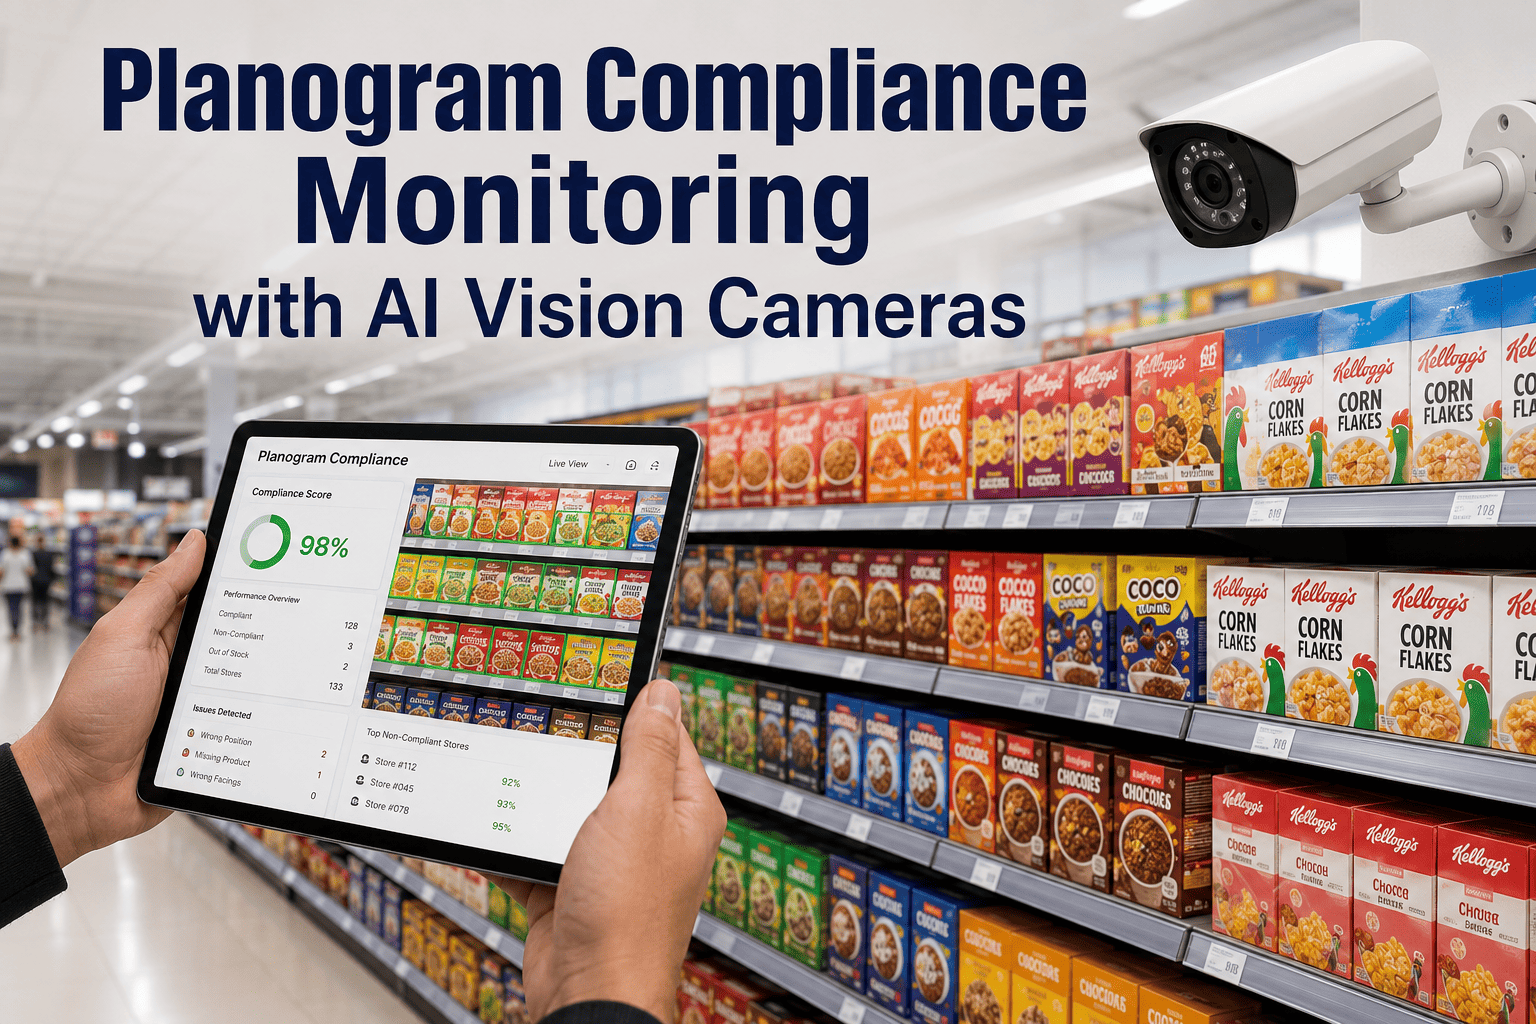
Head office spends months negotiating shelf space, building the planogram, and shipping it to every store. Then a field audit six weeks later finds barely half the stores actually executed it. This is not a rare failure — industry research puts average planogram compliance at around 60 percent, and it keeps eroding roughly 10 percent every week without active monitoring. Most retailers cannot even see this happening, since fewer than six in ten have any real system to measure it. iFactory's AI vision cameras check every shelf against the approved planogram continuously, catching drift before it becomes a lost quarter. Book a demo to see your own compliance rate measured for the first time.
You Built the Perfect Planogram. Does Any Store Still Follow It?
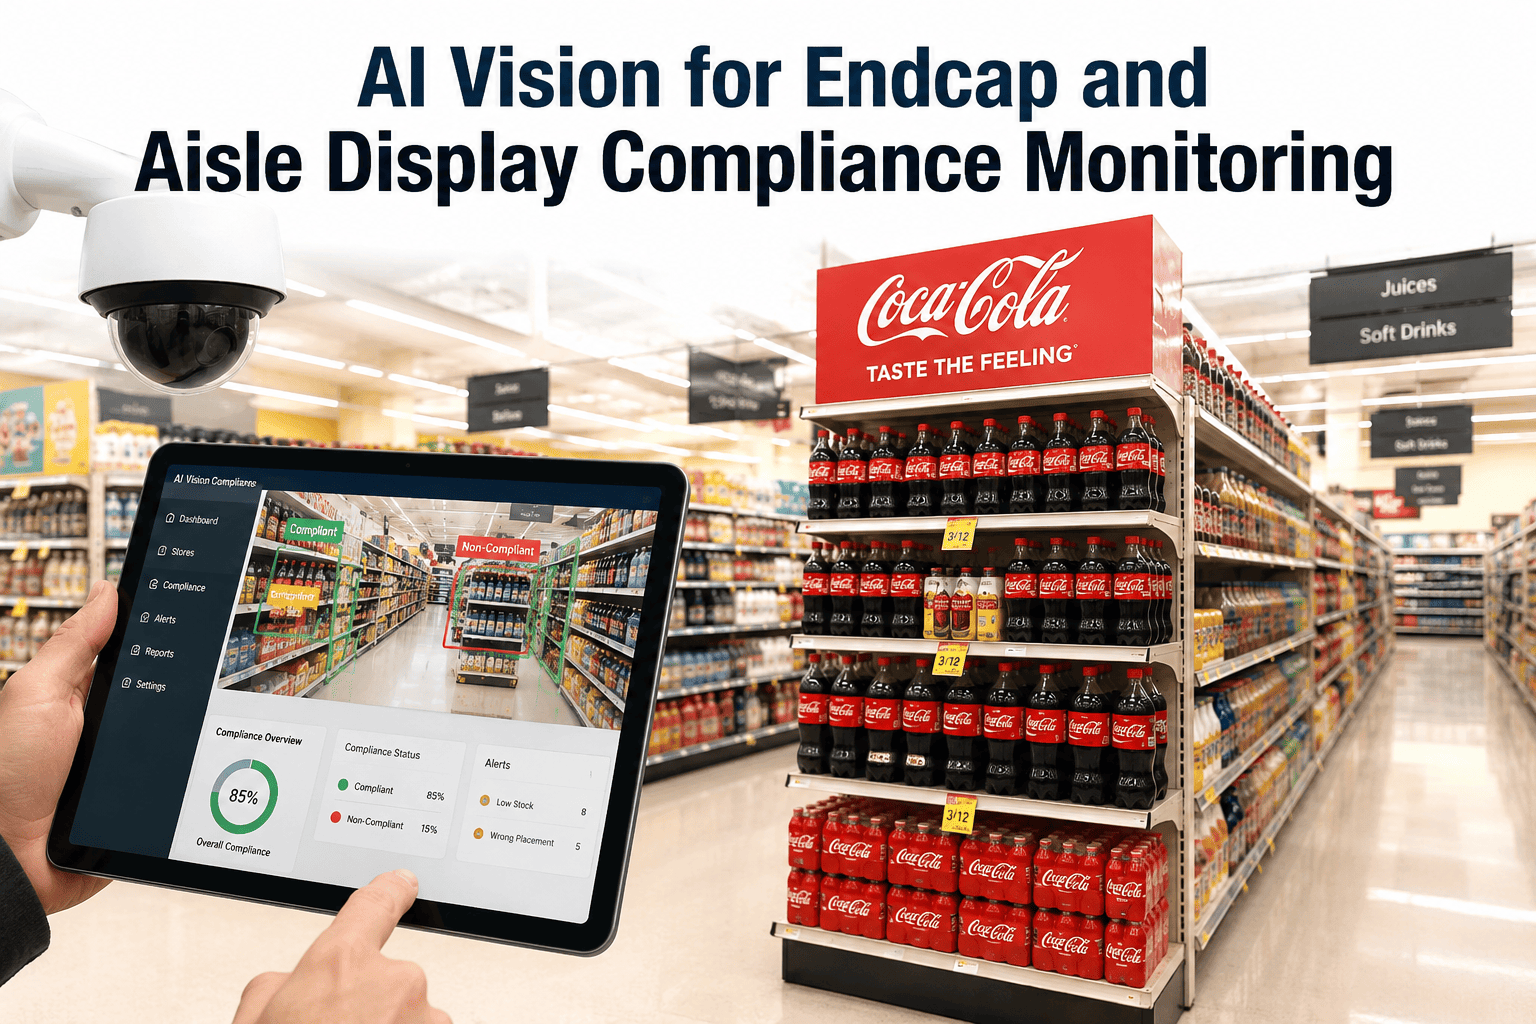
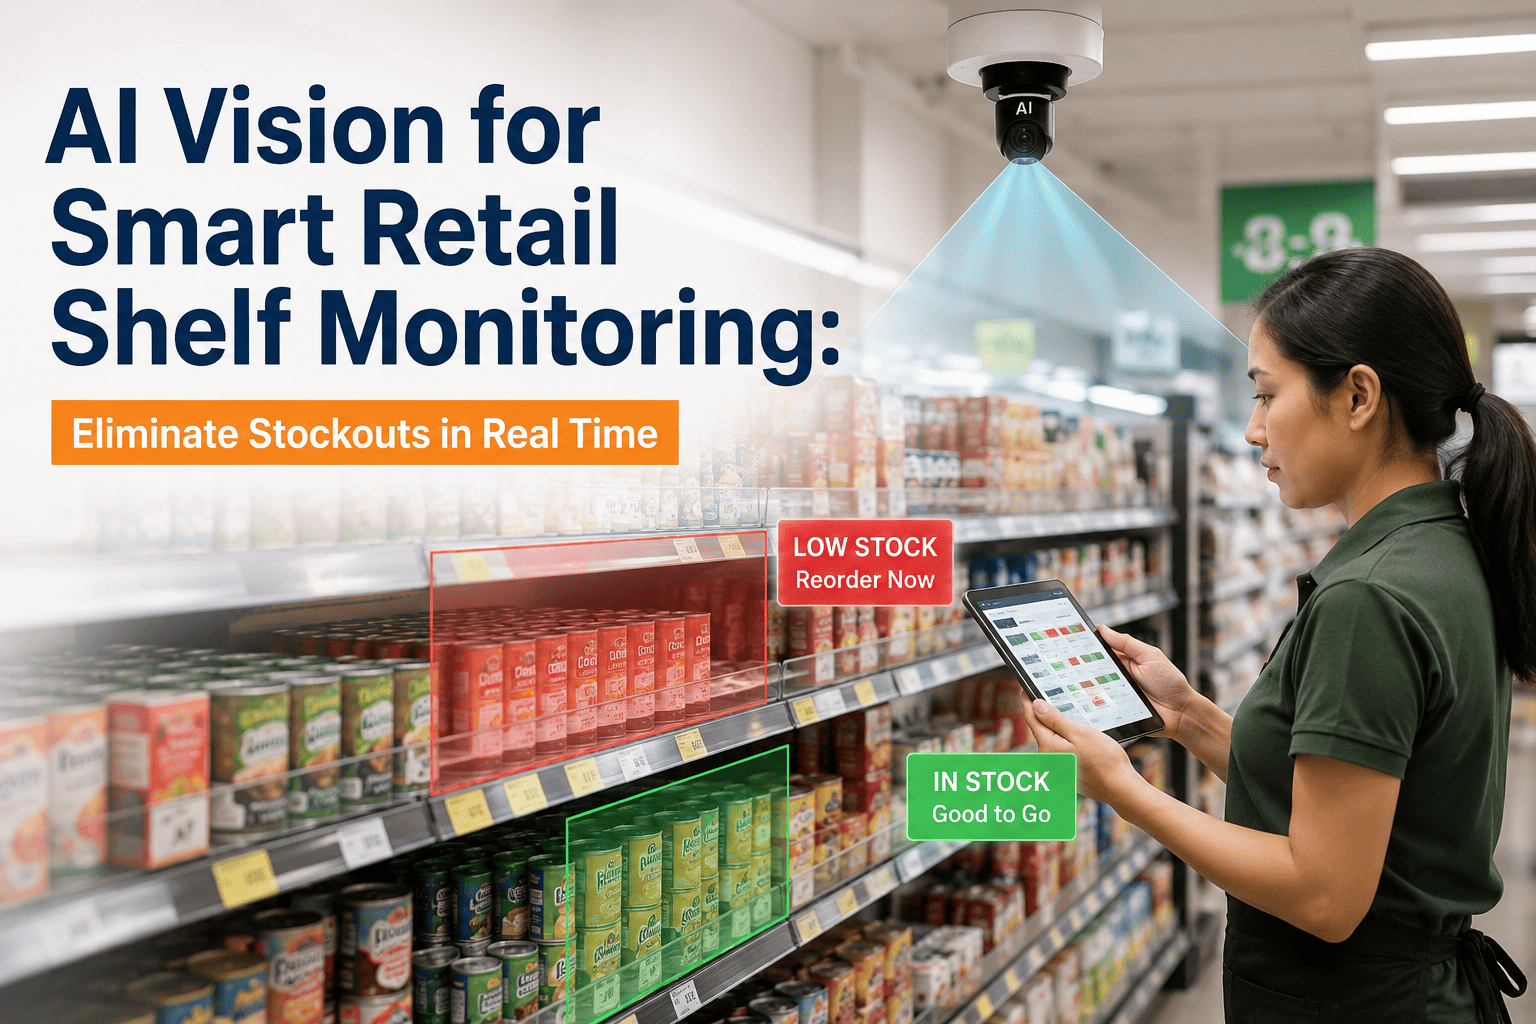
AI cameras verify product position, facing counts, pricing labels, and promotional placement against the approved layout automatically, across every aisle, every day.
The Compliance Scorecard Most Retailers Never See
These figures come from independent retail execution research, and they explain why so much planogram investment quietly evaporates after launch day.
average planogram compliance rate across retail chains, meaning four in ten stores deviate from the approved layout
weekly decay rate once a planogram is fully executed, as stock gaps and staff turnover quietly erode the layout
of retailers that have any structured system in place to actually measure compliance at all
in lost sales opportunity across food, drug, and mass merchandising channels tied to non-compliance annually
The Decay Curve: How a Perfect Reset Falls Apart
A planogram rarely fails all at once. It erodes week by week until nobody remembers what the original layout was supposed to look like.
Reset day, full compliance
The layout is executed exactly as designed. Every facing, every price tag, every promotional display matches the approved plan.
First quiet drift
A restock replaces a facing with the wrong product, or a promotional endcap gets partially dismantled to fill a gap elsewhere. Nobody flags it.
Staff turnover accelerates drift
New associates who never saw the original planogram restock shelves from memory or convenience rather than from the actual approved diagram.
The layout is now a different store
By the time a field audit visits, compliance has often dropped well below the 60 percent average, and nobody can say exactly when it happened.
Find Out Where Your Own Stores Sit on the Curve
Most retailers have never measured their real compliance rate. iFactory can show you that number across your store network before you commit to anything.
Four Things the AI Checks Against Every Planogram
A compliance check is not just "is the shelf full." It is a precise comparison across every element the planogram actually specifies.
Product position
Confirms each SKU sits in its designated shelf location, catching drift that happens one misplaced item at a time during routine restocking.
Facing counts
Verifies the number of facings matches the approved plan, since under-facing a high-margin SKU quietly suppresses its sales without ever showing up as a stockout.
Pricing and labels
Checks that shelf tags match the correct product and current price, catching mismatches that create checkout disputes and compliance risk at audit time.
Promotional placement
Confirms endcaps and promotional displays are built and positioned as agreed, since roughly half of authorized displays go up late or not at all.
Manual Audits vs. Continuous AI Verification
Field audits are the traditional way to measure compliance. They are also slow, expensive, and already outdated by the time the report reaches head office.
- Conducted quarterly or monthly at best, per store
- A single audit is a snapshot, already stale on arrival
- Auditor judgment introduces inconsistency store to store
- Findings take days or weeks to reach store operations
- Expensive to scale across a large multi-store network
- Every aisle checked on a rolling cycle, every day
- Drift is caught within days of first occurring, not months later
- Same objective standard applied identically across every store
- Alerts reach store teams the same day a gap is found
- Scales to a full chain without adding field headcount
A Category Manager's View After Switching to Continuous Monitoring
We used to find out our compliance rate once a quarter, and by then the number was already old news — whatever had drifted had been drifting for weeks. The first time we ran continuous verification, we found nearly half our stores had quietly dropped a facing on our top-selling SKU to make room for something else. That single fix, caught within days instead of months, moved the needle more than the entire quarterly audit program had in a year.
compliance visibility instead of a quarterly snapshot report
typical compliance improvement range once continuous monitoring replaces periodic audits
added field audit headcount required to cover the full store network
Frequently Asked Questions
How is compliance rate actually calculated from camera data?
The AI compares each shelf image against the approved planogram specification for that exact location, checking product position, facing count, and label accuracy simultaneously. Each correct match is scored against the total planned placements for that section, producing the same compliance percentage formula field auditors have always used, but recalculated continuously instead of once per quarter. This gives category managers a live number instead of a stale snapshot that was already outdated by the time it reached a spreadsheet.
Can it tell the difference between an approved layout change and a compliance failure?
Yes. The system checks against the current active planogram version for each store, so when head office pushes an approved seasonal reset or a new promotional layout, that becomes the new baseline immediately rather than being flagged as a deviation. This distinction matters because retail layouts change often and legitimately, and a monitoring system that cannot tell the difference just creates alert fatigue that teams eventually learn to ignore.
Does this work across hundreds of stores with different fixture types?
Yes. Each store's camera setup is calibrated against its own fixtures, lighting, and layout, so detection accuracy holds even when store formats vary significantly within the same chain. This is part of why continuous verification scales more cost-effectively than field audits, which require a trained auditor to physically visit and manually assess every location on its own schedule. Book a demo to see how this maps onto your specific store formats.
Can this integrate with our existing planogram software and retail execution tools?
Yes. The AI layer is built to ingest planogram files from the systems already in use and feed compliance findings back into existing retail execution or category management dashboards, so teams are not asked to adopt a second, disconnected source of truth. Talk to a specialist about connecting your current planogram and execution systems.
What is a realistic compliance target once monitoring is in place?
Highly managed retail environments with strong central merchandising control typically sustain compliance rates between 70 and 85 percent once continuous monitoring closes the visibility gap, compared to the roughly 60 percent industry average without it. The most useful benchmark is not an industry number but a brand's own trend over time, since closing the gap between current and target compliance is where the real revenue recovery happens.
Stop Guessing What's Actually on the Shelf
Book a 30-minute walkthrough. iFactory will map your planogram against a live store feed and show you exactly where compliance is breaking down right now.